


 |
市場調查報告書
商品編碼
1850107
高效能運算:市場佔有率分析、產業趨勢、統計數據和成長預測(2025-2030 年)High Performance Computing - Market Share Analysis, Industry Trends & Statistics, Growth Forecasts (2025 - 2030) |
||||||
※ 本網頁內容可能與最新版本有所差異。詳細情況請與我們聯繫。
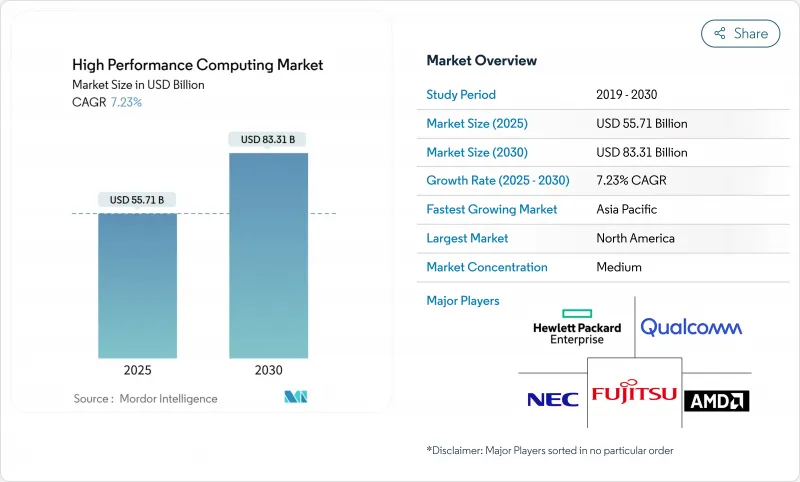
預計到 2025 年,高效能運算市場規模將達到 557 億美元,到 2030 年將達到 833 億美元,年複合成長率為 7.23%。
隨著發展勢頭從純粹的科學模擬轉向以人工智慧為中心的工作負載,需求正轉向配備豐富GPU的集群,以便在運行基於物理的程式碼的同時訓練底層模型。政府人工智慧專案使得政府採購人員與尋求相同加速系統的超大規模資料中心業者展開直接競爭,導致供應緊張,並增強了能夠控制高密度功耗的液冷架構的吸引力。儘管硬體仍然是採購預算的核心,但隨著各組織傾向於採用與難以預測的人工智慧需求曲線相匹配的計量收費模式,託管服務和高效能運算即服務(HPCaaS)正在迅速成長。其他市場促進因素包括混合部署的成長、生命科學研發管線的加速發展以及促使資料中心重新設計的永續性要求。
全球高效能運算市場趨勢與洞察
美國聯邦實驗室和一級雲端服務供應商的人工智慧/機器學習訓練工作負載呈爆炸性成長
聯邦實驗室目前正圍繞混合人工智慧和模擬能力來設計採購方案,這實際上使高效能運算市場的潛在尖峰效能需求加倍。美國衛生與公眾服務部已將人工智慧賦能的運算定位為其2025年研究策略的核心部分,鼓勵實驗室購買GPU密集型節點,以便在百萬兆級模擬和兆參數模型訓練之間靈活切換。美國能源部已在2025財政年度撥款11.52億美元用於人工智慧與高效能運算的整合。一級雲端服務供應商正在積極回應,推出主權人工智慧區,將FIPS檢驗的安全措施與先進的加速器結合。產業追蹤機構估計,2024年上半年70%的人工智慧基礎設施支出將用於以GPU為中心的設計。因此,高效能運算市場頂級系統的價值正在經歷結構性成長,但組件短缺導致價格波動。為了贏得聯邦政府的訂單,供應商現在正將液冷、光連接模組、零信任韌體和通道重構等服務捆綁銷售。
亞洲製藥外包中心對GPU加速分子動力學的需求激增
印度、中國和日本的合約研究組織(CRO)正在擴展其DGX級集群,以縮短先導化合物進入臨床的路徑。三井物產和英偉達宣布將於2024年推出東京1超級電腦,為日本製藥企業提供專為生物分子工作負載客製化的H100實例。預計到2030年,印度的CRO產業規模將達到25億美元,複合年成長率(CAGR)為10.75%。該行業正在將傳統方法與人工智慧驅動的靶點識別相結合,從而推動對雲端超級運算的需求。研究人員目前正在使用GENESIS軟體模擬16億個原子,並開始探索大規模蛋白質交互作用。這種能力鞏固了亞太地區在藥物發現外包領域的領先地位,並增強了該地區在全球加速器供應鏈中的作用。對於高效能運算市場而言,製藥工作負載可以起到對抗週期性生產需求波動的反週期作用。
受乾旱影響的美國收緊資料中心用水規定
維吉尼亞和馬裡蘭州正在製定法律,要求揭露用水量,而鳳凰城正在試驗微軟的零水冷卻技術,每年每個站點可節省1.25億公升水。公用事業公司現在限制新增兆瓦級電力接入,除非營運商承諾採用液體或後門熱交換技術。資本支出可能增加15%至20%,這將擠壓高效能運算市場的利潤,並推動浸沒式或協同空氣冷卻系統轉型。因此,冷板歧管和介電液的供應商正在積極佈局,以期獲得競爭優勢。營運商正在將業務分散到氣候更涼爽的地區,但延遲和數據主權政策限制了搬遷選擇,因此冷卻水資源緊張問題必須透過設計創新來解決,而不是透過搬遷。
細分市場分析
到2024年,硬體將佔高效能運算市場規模的55.3%,反映出企業對伺服器、互連技術和平行儲存的持續投資。然而,託管服務將以14.7%的複合年成長率成長,隨著財務長更傾向於營運支出而非折舊免稅額資產,採購邏輯也將隨之重塑。系統OEM廠商正在引入計量介面,允許按節點小時收費,從而模擬超大規模雲端的經濟模式。更快的AI推理管道會帶來不可預測的突發需求,促使企業轉向避免容量閒置的消費模式。聯想的TruScale、戴爾的Apex和HPE的GreenLake將超級運算節點、調度軟體和服務等級協定捆綁到一張發票中。供應商正透過提供承包液冷和光模組來縮短部署週期,從而在競爭中脫穎而出,將引進週期從數月縮短至數週。
服務的發展勢頭表明,未來的價值將圍繞編配、最佳化和安全封裝展開,而不是通用主機板的數量。遷移有限元素分析和體學工作負載的公司青睞透明的、按作業計費的方式,這種方式能夠將計算使用量與專案津貼和生產里程碑相匹配。合規團隊也傾向於託管服務,這種服務將資料保留在本地,但在高峰期允許資料溢出到提供者營運的附加伺服器上。因此,高效能運算市場正在朝著一個光譜發展:裸機購買和完全公共雲端租賃位於光譜的兩端,而計量收費的本地頻譜則位於中間。
到2024年,本地部署基礎設施將佔據高效能運算市場佔有率的67.8%,因為關鍵任務程式碼需要確定性的延遲和嚴格的資料管治。然而,隨著加速實例按分鐘計費的普及,到2030年,雲叢集的複合年成長率將達到11.2%。共用主權框架允許機構將匿名化的工作負載擴展到商業雲,同時將敏感資料集保留在本機磁碟上。 CoreWeave與OpenAI簽署了一份價值119億美元、為期五年的契約,這表明專為人工智慧打造的雲正在吸引公共和私有客戶。系統架構師目前正在設計軟體定義架構,以便在不同網站之間無縫地重新部署容器。
展望未來,邊緣快取節點、本地液冷機架和租賃GPU叢集的混合部署模式很可能成為主流。 Omnipath和Quantum-2 InfiniBand等互連抽象技術使調度器能夠忽略實體位置,將所有加速器視為一個資源池。這種能力使得工作負載的部署不再受拓樸結構的影響,而是由成本、安全性和永續性等因素驅動。因此,高效能運算市場將朝著聯合資源網路的方向發展,頻寬經濟性和數據快頻寬費用(而非資本支出)將成為籌資策略的核心。
區域分析
到2024年,北美將佔據高效能運算市場40.5%的佔有率,這得益於聯邦機構向旨在促進節能製造的HPC4EI計畫投入700萬美元。 CHIPS法案激發了超過4,500億美元的私人晶圓廠投資承諾,為2032年前全球半導體資本支出的28%奠定了基礎。易受乾旱影響的州立法推行水中性冷卻,使新增產能傾向採用浸沒式和後門液冷循環技術。超大規模資料中心加速推進內部GPU計劃,鞏固其區域優勢,同時,本地HBM模組的供應卻日趨緊張。
亞太地區將以9.3%的複合年成長率領跑,主要得益於主權運算策略和醫藥外包產業叢集的推動。中國通訊業者計劃採購1.7萬台人工智慧伺服器,主要來自浪潮和華為,這將為國內訂單增加41億美元。印度的九座PARAM Rudra設施以及即將推出的Krutrim人工智慧晶片將建構一個垂直整合的生態系統。日本正利用東京-1超級電腦加速國內主要藥廠的臨床候選藥物篩檢。此類投資將透過資本獎勵、本地人才和監管要求的結合,擴大高效能運算的市場規模。
歐洲高效能運算(EuroHPC)發展勢頭強勁,先後運作了LUMI(386 petaflops)、Leonardo(249 petaflops)和MareNostrum 5(215 petaflops)等超級電腦,其中JUPITER億百萬兆級電腦。歐盟「地平線歐洲」(Horizon Europe)計畫投資70億歐元(約76億美元)用於高效能運算和人工智慧的研發。盧森堡的共同資助將推動產學合作,共同設計實現數位主權的方案。區域電力價格波動加速了直接液冷技術的應用,並促使人們採用可再生能源來控制營運成本。南美洲和中東/非洲地區雖然仍在發展中,但正在增加對地震建模、氣候預測和基因組學的投資,為模組化貨櫃叢集創造了待開發區機會。
其他福利:
- Excel格式的市場預測(ME)表
- 3個月的分析師支持
目錄
第1章 引言
- 研究假設和市場定義
- 調查範圍
第2章調查方法
第3章執行摘要
第4章 市場情勢
- 市場概覽
- 市場促進因素
- 美國聯邦實驗室和一級雲端服務供應商的 AI/ML 訓練工作負載爆炸性成長
- 亞洲製藥外包中心對GPU加速分子動力學的需求激增
- 歐盟 Euro-NCAP 2030藍圖強制要求汽車 ADAS 模擬測試
- 國家百萬兆級舉措旨在加速中國和印度國產處理器的普及應用
- 市場限制
- 美國乾旱頻繁的州收緊了對資料中心的用水限制
- 超低延遲邊緣運算要求會削弱集中式雲端的經濟效益。
- 全球HBM3e記憶體短缺將擠壓2024-2026年GPU伺服器出貨量
- 供應鏈分析
- 監理展望
- 技術展望(晶片組、光連接模組)
- 波特五力分析
- 供應商的議價能力
- 買方的議價能力
- 新進入者的威脅
- 替代品的威脅
- 競爭對手之間的競爭
第5章 市場規模與成長預測
- 按組件
- 硬體
- 伺服器
- 通用CPU伺服器
- GPU加速伺服器
- 基於 ARM 的伺服器
- 儲存系統
- 硬碟陣列
- 基於快閃記憶體的陣列
- 物件儲存
- 互連和網路
- InfiniBand
- 乙太網路(25/40/100/400 GbE)
- 客製化/光連接模組
- 軟體
- 系統軟體(作業系統、叢集管理)
- 中介軟體和 RAS 工具
- 平行檔案系統
- 服務
- 專業服務
- 託管式和高效能運算即服務 (HPCaaS)
- 硬體
- 透過部署模式
- 本地部署
- 雲
- 混合
- 按插入類型(帶組件的橫切)
- CPU
- 圖形處理器
- FPGA
- ASIC/AI加速器
- 透過工業應用
- 政府和國防部
- 學術研究機構
- BFSI
- 製造與汽車工程
- 生命科學與醫療保健
- 能源、石油和天然氣
- 其他工業應用
- 按地區
- 北美洲
- 美國
- 加拿大
- 墨西哥
- 歐洲
- 德國
- 英國
- 法國
- 義大利
- 北歐國家(瑞典、挪威、芬蘭)
- 其他歐洲地區
- 亞太地區
- 中國
- 日本
- 印度
- 韓國
- 新加坡
- 亞太其他地區
- 南美洲
- 巴西
- 阿根廷
- 其他南美洲
- 中東
- 以色列
- 阿拉伯聯合大公國
- 沙烏地阿拉伯
- 土耳其
- 其他中東地區
- 非洲
- 南非
- 奈及利亞
- 其他非洲地區
- 北美洲
第6章 競爭情勢
- 市場集中度
- 策略性舉措(MandA、合資、IPO)
- 市佔率分析
- 公司簡介
- Advanced Micro Devices, Inc.
- NEC Corporation
- Fujitsu Limited
- Qualcomm Incorporated
- Hewlett Packard Enterprise
- Dell Technologies
- Lenovo Group
- IBM Corporation
- Atos SE/Eviden
- Cisco Systems
- NVIDIA Corporation
- Intel Corporation
- Penguin Computing(SMART Global)
- Inspur Group
- Huawei Technologies
- Amazon Web Services
- Microsoft Azure
- Google Cloud Platform
- Oracle Cloud Infrastructure
- Alibaba Cloud
- Dassault Systemes
第7章 市場機會與未來展望
The high-performance computing market size is valued at USD 55.7 billion in 2025 and is forecast to reach USD 83.3 billion by 2030, advancing at a 7.23% CAGR.
Momentum is shifting from pure scientific simulation toward AI-centric workloads, so demand is moving to GPU-rich clusters that can train foundation models while still running physics-based codes. Sovereign AI programs are pulling government buyers into direct competition with hyperscalers for the same accelerated systems, tightening supply and reinforcing the appeal of liquid-cooled architectures that tame dense power envelopes. Hardware still anchors procurement budgets, yet managed services and HPC-as-a-Service are rising quickly as organizations prefer pay-per-use models that match unpredictable AI demand curves. Parallel market drivers include broader adoption of hybrid deployments, accelerated life-sciences pipelines, and mounting sustainability mandates that force datacenter redesigns.
Global High Performance Computing Market Trends and Insights
The Explosion of AI/ML Training Workloads in U.S. Federal Labs & Tier-1 Cloud Providers
Federal laboratories now design procurements around mixed AI and simulation capacity, effectively doubling addressable peak-performance demand in the high-performance computing market. The Department of Health and Human Services framed AI-ready compute as core to its 2025 research strategy, spurring labs to buy GPU-dense nodes that pivot between exascale simulations and 1-trillion-parameter model training. The Department of Energy secured USD 1.152 billion for AI-HPC convergence in FY 2025. Tier-1 clouds responded with sovereign AI zones that blend FIPS-validated security and advanced accelerators, and industry trackers estimate 70% of first-half 2024 AI-infrastructure spend went to GPU-centric designs. The high-performance computing market consequently enjoys a structural lift in top-end system value, but component shortages heighten pricing volatility. Vendors now bundle liquid cooling, optical interconnects, and zero-trust firmware to win federal awards, reshaping the channel.
Surging Demand for GPU-Accelerated Molecular Dynamics in Asian Pharma Outsourcing Hubs
Contract research organizations in India, China, and Japan are scaling DGX-class clusters to shorten lead molecules' path to the clinic. Tokyo-1, announced by Mitsui & Co. and NVIDIA in 2024, offers Japanese drug makers dedicated H100 instances tailored for biomolecular workloads. India's CRO sector, projected to reach USD 2.5 billion by 2030 at a 10.75% CAGR, layers AI-driven target identification atop classical dynamics, reinforcing demand for cloud-delivered supercomputing. Researchers now push GENESIS software to simulate 1.6 billion atoms, opening exploration for large-protein interactions. That capability anchors regional leadership in outsourced discovery and amplifies Asia-Pacific's pull on global accelerator supply lines. For the high-performance computing market, pharma workloads act as a counter-cyclical hedge against cyclic manufacturing demand.
Escalating Datacenter Water-Usage Restrictions in Drought-Prone U.S. States
Legislation in Virginia and Maryland forces disclosure of water draw, while Phoenix pilots Microsoft's zero-water cooling that saves 125 million liters per site each year. Utilities now limit new megawatt hookups unless operators commit to liquid or rear-door heat exchange. Capital outlays can climb 15-20%, squeezing return thresholds in the high-performance computing market and prompting a shift toward immersion or cooperative-air systems. Suppliers of cold-plate manifolds and dielectric fluids therefore gain leverage. Operators diversify sites into cooler climates, but latency and data-sovereignty policies constrain relocation options, so design innovation rather than relocation must resolve the cooling-water tension.
Other drivers and restraints analyzed in the detailed report include:
- Mandatory Automotive ADAS Simulation Compliance in EU EURO-NCAP 2030 Roadmap
- National Exascale Initiatives Driving Indigenous Processor Adoption in China & India
- Global Shortage of HBM3e Memory Constraining GPU Server Shipments 2024-26
For complete list of drivers and restraints, kindly check the Table Of Contents.
Segment Analysis
Hardware accounted for 55.3% of the high-performance computing market size in 2024, reflecting continued spend on servers, interconnects, and parallel storage. Managed offerings, however, posted a 14.7% CAGR and reshaped procurement logic as CFOs favor OPEX over depreciating assets. System OEMs embed metering hooks so clusters can be billed by node-hour, mirroring hyperscale cloud economics. The acceleration of AI inference pipelines adds unpredictable burst demand, pushing enterprises toward consumption models that avoid stranded capacity. Lenovo's TruScale, Dell's Apex, and HPE's GreenLake now bundle supercomputing nodes, scheduler software, and service-level agreements under one invoice. Vendors differentiate through turnkey liquid cooling and optics that cut deployment cycles from months to weeks.
Services' momentum signals that future value will center on orchestration, optimization, and security wrappers rather than on commodity motherboard counts. Enterprises migrating finite-element analysis or omics workloads appreciate transparent per-job costing that aligns compute use with grant funding or manufacturing milestones. Compliance teams also prefer managed offerings that keep data on-premise yet allow peaks to spill into provider-operated annex space. The high-performance computing market thus moves toward a spectrum where bare-metal purchase and full public-cloud rental are endpoints, and pay-as-you-go on customer premises sits in the middle.
On-premise infrastructures held 67.8% of the high-performance computing market share in 2024 because mission-critical codes require deterministic latency and tight data governance. Yet cloud-resident clusters grow at 11.2% CAGR through 2030 as accelerated instances become easier to rent by the minute. Shared sovereignty frameworks let agencies keep sensitive datasets on local disks while bursting anonymized workloads to commercial clouds. CoreWeave secured a five-year USD 11.9 billion agreement with OpenAI, signalling how specialized AI clouds attract both public and private customers. System architects now design software-defined fabrics that re-stage containers seamlessly between sites.
Hybrid adoption will likely dominate going forward, blending edge cache nodes, local liquid-cooled racks, and leased GPU pods. Interconnect abstractions such as Omnipath or Quantum-2 InfiniBand allow the scheduler to ignore physical location, treating every accelerator as a pool. That capability makes workload placement a policy decision driven by cost, security, and sustainability rather than topology. As a result, the high-performance computing market evolves into a network of federated resources where procurement strategy centers on bandwidth economics and data-egress fees rather than capex.
The High Performance Computing Market is Segmented by Component (Hardware, Software and Services), Deployment Mode (On-Premise, Cloud, Hybrid), Industrial Application (Government and Defense, Academic and Research Institutions, BFSI, Manufacturing and Automotive Engineering, and More), Chip Type (CPU, GPU, FPGA, ASIC / AI Accelerators) and Geography. The Market Forecasts are Provided in Terms of Value (USD).
Geography Analysis
North America commanded 40.5% of the high-performance computing market in 2024 as federal agencies injected USD 7 million into the HPC4EI program aimed at energy-efficient manufacturing. The CHIPS Act ignited over USD 450 billion of private fab commitments, setting the stage for 28% of global semi capex through 2032. Datacenter power draw may climb to 490 TWh by 2030; drought-prone states therefore legislate water-neutral cooling, tilting new capacity toward immersion and rear-door liquid loops. Hyperscalers accelerate self-designed GPU projects, reinforcing regional dominance but tightening local supply of HBM modules.
Asia-Pacific posts the strongest 9.3% CAGR, driven by sovereign compute agendas and pharma outsourcing clusters. China's carriers intend to buy 17,000 AI servers, mostly from Inspur and Huawei, adding USD 4.1 billion in domestic orders. India's nine PARAM Rudra installations and upcoming Krutrim AI chip build a vertically integrated ecosystem. Japan leverages Tokyo-1 to fast-track clinical candidate screening for large domestic drug makers. These investments enlarge the high-performance computing market size by pairing capital incentives with local talent and regulatory mandates.
Europe sustains momentum through EuroHPC, operating LUMI (386 petaflops), Leonardo (249 petaflops), and MareNostrum 5 (215 petaflops), with JUPITER poised as the region's first exascale machine. Horizon Europe channels EUR 7 billion (USD 7.6 billion) into HPC and AI R&D. Luxembourg's joint funding promotes industry-academia co-design for digital sovereignty. Regional power-price volatility accelerates adoption of direct liquid cooling and renewable matching to control operating costs. South America, the Middle East, and Africa are nascent but invest in seismic modeling, climate forecasting, and genomics, creating greenfield opportunities for modular containerized clusters.
- Advanced Micro Devices, Inc.
- NEC Corporation
- Fujitsu Limited
- Qualcomm Incorporated
- Hewlett Packard Enterprise
- Dell Technologies
- Lenovo Group
- IBM Corporation
- Atos SE / Eviden
- Cisco Systems
- NVIDIA Corporation
- Intel Corporation
- Penguin Computing (SMART Global)
- Inspur Group
- Huawei Technologies
- Amazon Web Services
- Microsoft Azure
- Google Cloud Platform
- Oracle Cloud Infrastructure
- Alibaba Cloud
- Dassault Systemes
Additional Benefits:
- The market estimate (ME) sheet in Excel format
- 3 months of analyst support
TABLE OF CONTENTS
1 INTRODUCTION
- 1.1 Study Assumptions and Market Definition
- 1.2 Scope of the Study
2 RESEARCH METHODOLOGY
3 EXECUTIVE SUMMARY
4 MARKET LANDSCAPE
- 4.1 Market Overview
- 4.2 Market Drivers
- 4.2.1 The Explosion of AI/ML Training Workloads in U.S. Federal Labs and Tier-1 Cloud Providers
- 4.2.2 Surging Demand for GPU-Accelerated Molecular Dynamics in Asian Pharma Outsourcing Hubs
- 4.2.3 Mandatory Automotive ADAS Simulation Compliance in EU EURO-NCAP 2030 Roadmap
- 4.2.4 National Exascale Initiatives Driving Indigenous Processor Adoption in China and India
- 4.3 Market Restraints
- 4.3.1 Escalating Datacenter Water-Usage Restrictions in Drought-Prone U.S. States
- 4.3.2 Ultra-Low-Latency Edge Requirements Undermining Centralized Cloud Economics
- 4.3.3 Global Shortage of HBM3e Memory Constraining GPU Server Shipments 2024-26
- 4.4 Supply-Chain Analysis
- 4.5 Regulatory Outlook
- 4.6 Technological Outlook (Chiplets, Optical Interconnects)
- 4.7 Porter's Five Forces Analysis
- 4.7.1 Bargaining Power of Suppliers
- 4.7.2 Bargaining Power of Buyers
- 4.7.3 Threat of New Entrants
- 4.7.4 Threat of Substitutes
- 4.7.5 Intensity of Competitive Rivalry
5 MARKET SIZE AND GROWTH FORECASTS (VALUES)
- 5.1 By Component
- 5.1.1 Hardware
- 5.1.1.1 Servers
- 5.1.1.1.1 General-Purpose CPU Servers
- 5.1.1.1.2 GPU-Accelerated Servers
- 5.1.1.1.3 ARM-Based Servers
- 5.1.1.2 Storage Systems
- 5.1.1.2.1 HDD Arrays
- 5.1.1.2.2 Flash-Based Arrays
- 5.1.1.2.3 Object Storage
- 5.1.1.3 Interconnect and Networking
- 5.1.1.3.1 InfiniBand
- 5.1.1.3.2 Ethernet (25/40/100/400 GbE)
- 5.1.1.3.3 Custom/Optical Interconnects
- 5.1.2 Software
- 5.1.2.1 System Software (OS, Cluster Mgmt)
- 5.1.2.2 Middleware and RAS Tools
- 5.1.2.3 Parallel File Systems
- 5.1.3 Services
- 5.1.3.1 Professional Services
- 5.1.3.2 Managed and HPC-as-a-Service (HPCaaS)
- 5.1.1 Hardware
- 5.2 By Deployment Mode
- 5.2.1 On-premise
- 5.2.2 Cloud
- 5.2.3 Hybrid
- 5.3 By Chip Type (Cross-Cut with Component)
- 5.3.1 CPU
- 5.3.2 GPU
- 5.3.3 FPGA
- 5.3.4 ASIC / AI Accelerators
- 5.4 By Industrial Application
- 5.4.1 Government and Defense
- 5.4.2 Academic and Research Institutions
- 5.4.3 BFSI
- 5.4.4 Manufacturing and Automotive Engineering
- 5.4.5 Life Sciences and Healthcare
- 5.4.6 Energy, Oil and Gas
- 5.4.7 Other Industry Applications
- 5.5 By Geography
- 5.5.1 North America
- 5.5.1.1 United States
- 5.5.1.2 Canada
- 5.5.1.3 Mexico
- 5.5.2 Europe
- 5.5.2.1 Germany
- 5.5.2.2 United Kingdom
- 5.5.2.3 France
- 5.5.2.4 Italy
- 5.5.2.5 Nordics (Sweden, Norway, Finland)
- 5.5.2.6 Rest of Europe
- 5.5.3 Asia-Pacific
- 5.5.3.1 China
- 5.5.3.2 Japan
- 5.5.3.3 India
- 5.5.3.4 South Korea
- 5.5.3.5 Singapore
- 5.5.3.6 Rest of Asia-Pacific
- 5.5.4 South America
- 5.5.4.1 Brazil
- 5.5.4.2 Argentina
- 5.5.4.3 Rest of South America
- 5.5.5 Middle East
- 5.5.5.1 Israel
- 5.5.5.2 United Arab Emirates
- 5.5.5.3 Saudi Arabia
- 5.5.5.4 Turkey
- 5.5.5.5 Rest of Middle East
- 5.5.6 Africa
- 5.5.6.1 South Africa
- 5.5.6.2 Nigeria
- 5.5.6.3 Rest of Africa
- 5.5.1 North America
6 COMPETITIVE LANDSCAPE
- 6.1 Market Concentration
- 6.2 Strategic Moves (MandA, JVs, IPOs)
- 6.3 Market Share Analysis
- 6.4 Company Profiles {(includes Global level Overview, Market level overview, Core Segments, Financials as available, Strategic Information, Market Rank/Share for key companies, Products and Services, and Recent Developments)}
- 6.4.1 Advanced Micro Devices, Inc.
- 6.4.2 NEC Corporation
- 6.4.3 Fujitsu Limited
- 6.4.4 Qualcomm Incorporated
- 6.4.5 Hewlett Packard Enterprise
- 6.4.6 Dell Technologies
- 6.4.7 Lenovo Group
- 6.4.8 IBM Corporation
- 6.4.9 Atos SE / Eviden
- 6.4.10 Cisco Systems
- 6.4.11 NVIDIA Corporation
- 6.4.12 Intel Corporation
- 6.4.13 Penguin Computing (SMART Global)
- 6.4.14 Inspur Group
- 6.4.15 Huawei Technologies
- 6.4.16 Amazon Web Services
- 6.4.17 Microsoft Azure
- 6.4.18 Google Cloud Platform
- 6.4.19 Oracle Cloud Infrastructure
- 6.4.20 Alibaba Cloud
- 6.4.21 Dassault Systemes
7 MARKET OPPORTUNITIES AND FUTURE OUTLOOK
- 7.1 White-space and Unmet-need Assessment
 高效能運算市場:按組件、技術和最終用戶分類 - 2026-2032年全球市場預測
 2026年全球加速運算伺服器市場報告2026年全球高效能運算市場報告雲端高效能運算市場:按元件、處理器類型、服務模式、部署模式、應用程式和最終用戶產業分類,全球預測,2026-2032年
 高效能運算市場分析及預測(至2035年):依類型、產品類型、服務、技術、組件、應用、部署類型、最終用戶、功能及解決方案分類
 全球高效能運算 (HPC) 市場規模、佔有率、趨勢和成長分析報告,2026-2034 年
 全球異質運算市場:預測(至 2034 年)-按元件、部署方式、應用、最終使用者和地區分類的分析
 高效能運算市場-全球產業規模、佔有率、趨勢、機會及預測(按組件、部署模式、企業類型、垂直產業、地區和競爭格局分類,2021-2031年)混合GPU-CPU市場按產品類型、記憶體容量、部署類型、最終用戶產業和應用分類-2026-2032年全球預測高效能人工智慧晶片市場:按處理器架構、精確度類型、應用和分銷通路分類-2026-2032年全球預測