


 |
市場調查報告書
商品編碼
1850084
公用事業和能源分析:市場佔有率分析、行業趨勢、統計數據和成長預測(2025-2030 年)Utility And Energy Analytics - Market Share Analysis, Industry Trends & Statistics, Growth Forecasts (2025 - 2030) |
||||||
※ 本網頁內容可能與最新版本有所差異。詳細情況請與我們聯繫。
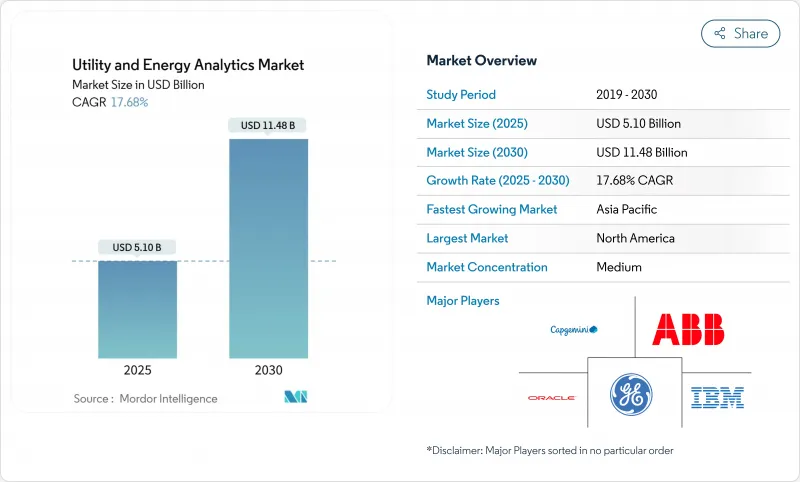
預計到 2025 年,公用事業和能源分析市場規模將達到 51 億美元,到 2030 年將達到 114.8 億美元,複合年成長率為 17.68%。
成長的驅動力來自不斷提高的電氣化率、更嚴格的脫碳目標以及最佳化日益複雜的電網的需求。同時,電力負載預計將成長五倍,從2025年的23吉瓦增加到2030年的128吉瓦,迫使電力公司對其數據基礎設施和決策流程進行現代化改造。批發價格波動加劇、智慧電錶普及速度加快以及雲端運算應用日益廣泛,進一步擴大了先進解決方案的應用範圍。隨著傳統操作技術供應商透過收購和合作擴展其分析產品組合,以及超大規模雲端公司向電力公司提供產業專用的人工智慧服務,競爭日益激烈。
全球公用事業和能源分析市場趨勢與洞察
可再生能源強制規定和脫碳支出
全球為減少碳排放所做的努力正在加速對先進預測和最佳化工具的投資。預計到2025年初,可再生能源將佔全球電力供應的三分之一,這將為電網帶來前所未有的波動性。美國能源局估計,到2030年,如果電力公司能夠即時協調分散式資源,密集型虛擬電廠可以滿足10%至20%的尖峰需求。這些發展趨勢迫使營運商採用能夠處理高頻遙測數據、模擬天氣驅動的發電量波動並最佳化日前和日內市場競標策略的分析平台。
部署 AMI 2.0 並採用邊緣分析
新一代智慧電錶計劃能夠產生連續的資料流,其效能遠超傳統處理工具。預計全球智慧電錶收入將從2024年的266.5億美元成長到2025年的292.9億美元,產生精細的時間間隔數據,供公用事業公司在邊緣進行分析。透過將分析功能嵌入電錶,泰晤士水務公司的管網每天已檢測到超過8萬處漏水,避免了5,700萬公升水的損失。本地運行演算法可最大限度地減少延遲,降低回程傳輸頻寬,並使配電營運商能夠快速觸發電壓和壓力調節,從而在降低成本的同時提高電網彈性。
傳統OT-IT整合成本與資料孤島
許多公用事業公司仍在運作幾十年前的SCADA、停電和收費系統,這些系統當初設計時並未考慮連網互通。將這些系統與雲端閘道器和現代資料湖整合,通常會使初始分析預算翻倍甚至三倍,並延誤計劃進度。透過標準化資料模型、部署API閘道和滾動升級,具有前瞻性的公用事業公司在控制成本的同時,也為未來分析層的開放式架構奠定了基礎。
細分市場分析
預計2025年,雲端平台將貢獻41%的支出成長,而由於嚴格的合規要求,本地部署模式仍維持59%的市場佔有率。然而,彈性運算、託管人工智慧服務和計量收費模式正在改變成本效益格局。受待開發區AMI、需量反應和DERMS部署(這些部署需要水平可擴展架構)的推動,預計到2030年,雲端部署的公用事業和能源分析市場規模將以24.10%的複合年成長率成長。 IBM的軟體即服務(SaaS)套件表明,供應商越來越重視採用電網特定模板的強化型、可審核環境。混合策略十分普遍,敏感的營運資料集保留在資料中心,而預測管道和麵向客戶的儀表板則在雲端運作。
除了韌性之外,公用事業公司也十分欣賞雲端運算快速的創新週期。諸如地理空間視覺化、情境調度模擬器和客戶自助服務入口網站等新功能無需耗時的硬體更新即可部署。服務提供者正在發布針對公共產業的合規藍圖,以幫助風險管理人員獲得董事會核准。隨著信心的增強,輸電業者正在試行雲端原生歷史資料替換方案,目標是在五年內將整體擁有成本降低 50%。
2024年,軟體授權收入仍將佔總收入的69%,這反映出企業對供應商提供的計量資料管理、停電分析和預測工具的高度依賴。然而,服務收入正以20.80%的複合年成長率加速成長,顯示公用事業公司需要整合支援、數據品質改進和持續的模型調優。現場經驗表明,在多年部署專案中,專業服務支出可能與軟體支出相當,尤其是在需要為傳統監控和資料擷取平台配備中間件適配器的情況下。 Cognizant 2024年第四季營收年增6.8%,部分原因是公用事業分析需求的成長,凸顯了企業向增值合約模式的轉變。
隨著電力公司部署變電站相位測量單元和饋線級感測器,邊緣硬體的部署也不斷增加。這些設備預處理大量波形,並將基於事件的摘要傳輸到中央儲存庫。邊緣運算能夠實現近乎瞬時的故障定位和電壓調節器,從而延長設備壽命並提高電能品質。
公用事業和能源分析市場配置(本地部署、雲端部署、混合部署)、組件(軟體、服務、其他)、應用(計量操作和資料管理、負載和發電預測、其他)、最終用戶(發電企業、輸配電營運商、其他)、公用事業類型(電力、天然氣、其他)以及地區進行細分。市場預測以美元計價。
區域分析
北美地區在2024年將維持38%的收入佔有率,這得益於成熟的數位基礎設施、超過70%的AMI普及率以及鼓勵基於績效定價的法律規範。各州的電力系統韌性計畫正將資金投入停電分析、植被侵蝕建模和野火風險評分等領域。德克薩斯州的需求成長就是一個例證,其靈活負載消費量在2025年將達到540億度,迫使電力公司提高負載預測的準確性並增強電網自動化。隨著公用事業公司利用彈性運算來處理高頻電錶讀數和變電站波形,雲端採用率的成長速度超過了本地部署的成長速度。
亞太地區是成長最快的地區,2025年至2030年的複合年成長率將達到21.30%。中國太陽能光電和儲能技術的快速普及以及印度農村電氣化計劃的推進,帶來了大規模的數據挑戰,而分析技術可以有效應對這些挑戰。日本和澳洲的現有企業專注於客戶參與和編配能源(DER)協調,而新興市場則直接跨越傳統調度系統,從一開始就採用智慧電網技術。政府支持的智慧城市計劃透過添加交通、環境感測器和微電網等數據流,並將其與公用事業資料集融合,正在擴大分析平台的覆蓋範圍。
在歐洲,雄心勃勃的脫碳目標持續推動公用事業公司投入巨資,以最佳化可變可再生能源和電氣化需求(包括熱泵和電動車)的整合。嚴格的網路安全法規和GDPR合規性正在推動資料主權要求,並促使架構選擇轉向區域雲區和本地化資料湖。歐盟委員會推動跨境市場耦合,刺激了對分析技術的需求,以協調成員國之間的調度、擁塞管理和能源不平衡結算。北歐營運商正在展示先進的靈活性市場,其中配電級容量近乎即時地進行交易,這需要高解析度遠端檢測和基於人工智慧的調度引擎。
其他福利:
- Excel格式的市場預測(ME)表
- 3個月的分析師支持
目錄
第1章 引言
- 研究假設和市場定義
- 調查範圍
第2章調查方法
第3章執行摘要
第4章 市場情勢
- 市場概覽
- 市場促進因素
- 可再生能源強制規定和脫碳支出
- 部署 AMI 2.0 並採用邊緣分析
- 批發價格波動會影響負載預測的準確性。
- 雲端原生實用分析框架
- 歐盟/美國網路安全彈性合規要求
- 市場限制
- 傳統OT-IT整合成本與資料孤島
- 電力產業資料科學人才短缺
- 網路安全和資料主權問題
- 仔細審查限制數位預算的定價案例
- 價值/供應鏈分析
- 監管環境
- 技術展望
- 波特五力分析
- 供應商的議價能力
- 買方的議價能力
- 新進入者的威脅
- 替代品的威脅
- 競爭對手之間的競爭
第5章 市場規模與成長預測
- 透過部署
- 本地部署
- 雲
- 混合
- 按組件
- 軟體
- 服務
- 硬體/邊緣設備
- 透過使用
- 計量運作和資料管理
- 負載和發電預測
- 需量反應和靈活性
- 配送規劃與最佳化
- 資產績效管理
- 故障管理和可靠性
- 按公用事業類型
- 電
- 氣體
- 水
- 多功能的
- 最終用戶
- 發電設施
- 輸配電公司
- 零售能源供應商
- 獨立電力生產商
- 按地區
- 北美洲
- 美國
- 加拿大
- 墨西哥
- 南美洲
- 巴西
- 阿根廷
- 其他南美洲
- 歐洲
- 英國
- 德國
- 法國
- 義大利
- 西班牙
- 北歐國家
- 俄羅斯
- 其他歐洲地區
- 亞太地區
- 中國
- 日本
- 印度
- 韓國
- 澳洲和紐西蘭
- ASEAN
- 亞太其他地區
- 中東和非洲
- 中東
- 沙烏地阿拉伯
- 阿拉伯聯合大公國
- 以色列
- 土耳其
- 其他中東地區
- 非洲
- 南非
- 埃及
- 奈及利亞
- 其他非洲地區
- 北美洲
第6章 競爭情勢
- 市場集中度
- 策略性措施與資金籌措
- 市佔率分析
- 公司簡介
- Oracle Corporation
- IBM Corporation
- Siemens AG
- Schneider Electric SE
- ABB Ltd
- General Electric Company
- SAS Institute Inc.
- SAP SE
- Capgemini SE
- Teradata Corporation
- Hitachi Energy Ltd.
- Landis+Gyr AG
- Itron Inc.
- AutoGrid Systems Inc.
- Wipro Ltd.
- Accenture plc
- Amazon Web Services(AWS)Utilities
- Microsoft Azure Energy
- Enel X
- Nexant Inc.
- OSIsoft(AVEVA)
- Uptake Technologies
- Bidgely Inc.
- Smarter Grid Solutions
第7章 市場機會與未來展望
The utility and energy analytics market size stands at USD 5.1 billion in 2025 and is forecast to reach USD 11.48 billion by 2030, registering a 17.68% CAGR.
Growth is fuelled by rising electrification, sharper decarbonisation targets and the need to optimise increasingly complex grids. More than 55% of utilities now apply near-real-time analytics to monitor grid assets and customer usage, while a projected five-fold jump in electricity load-from 23 GW in 2025 to 128 GW in 2030-keeps pressure on operators to modernise data infrastructure and decision-making processes. Intensifying wholesale-price volatility accelerated smart-meter rollouts and widening cloud adoption further widen the addressable space for advanced solutions. Competitive intensity is rising as hyperscale cloud firms court utilities with industry-specific AI services, even as traditional operational-technology vendors deepen their analytics portfolios through acquisitions and partnerships.
Global Utility And Energy Analytics Market Trends and Insights
Mandatory Renewable Mandates & Decarbonisation Spend
Global commitments to cut carbon emissions are accelerating investment in sophisticated forecasting and optimisation tools. Renewables are projected to generate one-third of global electricity by early 2025, placing unprecedented variability on grids. Government incentives amplify the trend; the U.S. Department of Energy estimates that aggregated virtual power plants could supply 10-20% of peak demand by 2030, provided utilities can orchestrate distributed resources in real time. These developments compel operators to deploy analytics platforms capable of processing high-frequency telemetry, modelling weather-driven output swings and optimising bid strategies across day-ahead and intra-day markets.
AMI 2.0 Roll-out & Edge Analytics Adoption
Next-generation smart-meter projects create continuous data streams that outstrip legacy processing tools. Global smart-meter revenues are projected to climb from USD 26.65 billion in 2024 to USD 29.29 billion in 2025, producing granular interval data that utilities can analyse at the edge. Thames Water's network already detects more than 80,000 leaks daily and avoids 57 million litres of water losses by embedding analytics inside meters. Running algorithms locally minimises latency, reduces back-haul bandwidth and enables distribution operators to trigger rapid voltage or pressure adjustments, reinforcing grid resilience while containing costs.
Legacy OT-IT Integration Costs & Data Silos
Many utilities still run decades-old SCADA, outage and billing systems that were never designed to interconnect. Integrating these assets with cloud gateways and modern data-lakes often doubles or triples the original analytics budget, delaying project timelines. Forward-thinking operators are standardising data models, deploying API gateways and sequencing upgrades to contain spend while laying an open architecture foundation for future analytics layers.
Other drivers and restraints analyzed in the detailed report include:
- Wholesale-Price Volatility Driving Load-Forecast Accuracy
- Cloud-Native Utility-Analytics Frameworks
- Data-Science Talent Shortage in Power Domain
For complete list of drivers and restraints, kindly check the Table Of Contents.
Segment Analysis
Cloud platforms captured 41% of incremental spend in 2025, yet the on-premises model retained 59% utility and energy analytics market share due to strict compliance requirements. Operators historically kept mission-critical apps within firewalls; however, elastic compute, managed AI services and pay-as-you-go economics are shifting cost-benefit equations. The utility and energy analytics market size for cloud deployments is expected to grow at 24.10% CAGR to 2030, driven by greenfield AMI, demand-response and DERMS rollouts that need horizontally scalable architectures. IBM's sector-focused Software-as-a-Service suite illustrates rising vendor emphasis on hardened, audit-ready environments with grid-specific templates. Hybrid strategies are common: sensitive operational datasets remain in data centres while prediction pipelines and customer-facing dashboards run in the cloud, allowing utilities to stage migration while mitigating sovereignty concerns.
Alongside resilience, utilities value the cloud's rapid innovation cycle. New features-geospatial visualisation, what-if dispatch simulators or customer self-service portals-can be deployed without lengthy hardware refreshes. Providers publish utilities-specific compliance roadmaps, helping risk officers secure board approvals. As confidence rises, transmission operators are piloting cloud-native historian replacements, targeting 50% lower total cost of ownership over a five-year horizon.
Software licences still accounted for 69% of 2024 revenues, reflecting entrenched reliance on vendor-supplied meter-data management, outage analytics and forecasting tools. Yet services revenue is accelerating at 20.80% CAGR, signalling utilities' need for integration support, data-quality remediation and continuous model tuning. Field evidence shows professional-services outlays can equal software spend during multiyear deployments, especially where legacy supervisory control and data acquisition platforms require middleware adaptors. Cognizant's 6.8% year-over-year revenue uptick in Q4 2024, partly propelled by utility analytics mandates, underlines the shift toward value-added engagements.
Edge-hardware uptake is also climbing as utilities deploy substation phasor-measurement units and feeder-level sensors. These devices preprocess high-volume waveforms, forwarding only event-based summaries to central repositories. Edge enables near-instant fault localisation and voltage-control actions, extending equipment life and improving power quality.
Utility and Energy Analytics Market Segmented by Deployment (On-Premises, Cloud and Hybrid), Component (Software, Services and More), Application (Meter Operations and Data Management, Load and Generation Forecasting and More), End-User (Generation Utilities, Transmission and Distribution Operators and More) Utility Type (Electric, Gas and More), and Geography. The Market Forecasts are Provided in Terms of Value (USD).
Geography Analysis
North America retained a 38% revenue share in 2024, backed by mature digital infrastructure, AMI penetration above 70% and supportive regulatory constructs that reward performance-based ratemaking. State-level resilience programmes channel funds toward outage analytics, vegetation-encroachment modelling and wildfire-risk scoring. Texas exemplifies demand growth, with flexible-load consumption set to reach 54 billion kWh in 2025, forcing utilities to refine load-forecast accuracy and bolster grid automation. Cloud deployments outpace on-premises adds as utilities capitalise on elastic compute to process high-frequency meter reads and substation waveforms.
Asia-Pacific represents the fastest expanding pocket with a 21.30% CAGR for 2025-2030. China's rapid solar and storage build-out and India's rural electrification projects create large-scale data challenges that analytics can unlock. Established players in Japan and Australia emphasise customer engagement and DER orchestration, whereas emerging economies leapfrog legacy dispatch systems, installing smart-grid technologies from the outset. Government-backed smart-city initiatives pile on additional data streams-traffic, environmental sensors and microgrids-that converge with utility datasets, increasing analytics platform scope.
Europe sustains significant spend as ambitious decarbonisation obligations drive utilities to optimise variable renewable integration and electrified demand such as heat pumps and EVs. Tight cyber-security rules and GDPR compliance elevate data-sovereignty requirements, shaping architecture choices toward regional cloud zones and localised data-lakes. The European Commission's push for cross-border market coupling stimulates demand for analytics that align scheduling, congestion management and energy imbalance settlements across member states. Nordic operators showcase advanced flexibility markets where distribution-level capacity trades in near-real time, necessitating high-resolution telemetry and AI-based dispatch engines.
- Oracle Corporation
- IBM Corporation
- Siemens AG
- Schneider Electric SE
- ABB Ltd
- General Electric Company
- SAS Institute Inc.
- SAP SE
- Capgemini SE
- Teradata Corporation
- Hitachi Energy Ltd.
- Landis+Gyr AG
- Itron Inc.
- AutoGrid Systems Inc.
- Wipro Ltd.
- Accenture plc
- Amazon Web Services (AWS) Utilities
- Microsoft Azure Energy
- Enel X
- Nexant Inc.
- OSIsoft (AVEVA)
- Uptake Technologies
- Bidgely Inc.
- Smarter Grid Solutions
Additional Benefits:
- The market estimate (ME) sheet in Excel format
- 3 months of analyst support
TABLE OF CONTENTS
1 INTRODUCTION
- 1.1 Study Assumptions and Market Definition
- 1.2 Scope of the Study
2 RESEARCH METHODOLOGY
3 EXECUTIVE SUMMARY
4 MARKET LANDSCAPE
- 4.1 Market Overview
- 4.2 Market Drivers
- 4.2.1 Mandatory renewable mandates and decarbonisation spend
- 4.2.2 AMI 2.0 roll-out and edge analytics adoption
- 4.2.3 Wholesale-price volatility driving load-forecast accuracy
- 4.2.4 Cloud-native utility-analytics frameworks
- 4.2.5 EU/US cyber-resilience compliance requirements
- 4.3 Market Restraints
- 4.3.1 Legacy OT-IT integration costs and data silos
- 4.3.2 Data-science talent shortage in power domain
- 4.3.3 Cyber-security and data-sovereignty concerns
- 4.3.4 Rate-case scrutiny limiting digital budgets
- 4.4 Value / Supply-Chain Analysis
- 4.5 Regulatory Landscape
- 4.6 Technological Outlook
- 4.7 Porter's Five Forces Analysis
- 4.7.1 Bargaining Power of Suppliers
- 4.7.2 Bargaining Power of Buyers
- 4.7.3 Threat of New Entrants
- 4.7.4 Threat of Substitute Products
- 4.7.5 Intensity of Competitive Rivalry
5 MARKET SIZE AND GROWTH FORECASTS (VALUE)
- 5.1 By Deployment
- 5.1.1 On-premise
- 5.1.2 Cloud
- 5.1.3 Hybrid
- 5.2 By Component
- 5.2.1 Software
- 5.2.2 Services
- 5.2.3 Hardware / Edge Devices
- 5.3 By Application
- 5.3.1 Meter Operations and Data Management
- 5.3.2 Load and Generation Forecasting
- 5.3.3 Demand Response and Flexibility
- 5.3.4 Distribution Planning and Optimisation
- 5.3.5 Asset Performance Management
- 5.3.6 Outage Management and Reliability
- 5.4 By Utility Type
- 5.4.1 Electric
- 5.4.2 Gas
- 5.4.3 Water
- 5.4.4 Multi-utility
- 5.5 By End-user
- 5.5.1 Generation Utilities
- 5.5.2 Transmission and Distribution Operators
- 5.5.3 Retail Energy Suppliers
- 5.5.4 Independent Power Producers
- 5.6 By Geography
- 5.6.1 North America
- 5.6.1.1 United States
- 5.6.1.2 Canada
- 5.6.1.3 Mexico
- 5.6.2 South America
- 5.6.2.1 Brazil
- 5.6.2.2 Argentina
- 5.6.2.3 Rest of South America
- 5.6.3 Europe
- 5.6.3.1 United Kingdom
- 5.6.3.2 Germany
- 5.6.3.3 France
- 5.6.3.4 Italy
- 5.6.3.5 Spain
- 5.6.3.6 Nordics
- 5.6.3.7 Russia
- 5.6.3.8 Rest of Europe
- 5.6.4 Asia-Pacific
- 5.6.4.1 China
- 5.6.4.2 Japan
- 5.6.4.3 India
- 5.6.4.4 South Korea
- 5.6.4.5 Australia and New Zealand
- 5.6.4.6 ASEAN
- 5.6.4.7 Rest of Asia-Pacific
- 5.6.5 Middle East and Africa
- 5.6.5.1 Middle East
- 5.6.5.1.1 Saudi Arabia
- 5.6.5.1.2 United Arab Emirates
- 5.6.5.1.3 Israel
- 5.6.5.1.4 Turkey
- 5.6.5.1.5 Rest of Middle East
- 5.6.5.2 Africa
- 5.6.5.2.1 South Africa
- 5.6.5.2.2 Egypt
- 5.6.5.2.3 Nigeria
- 5.6.5.2.4 Rest of Africa
- 5.6.1 North America
6 COMPETITIVE LANDSCAPE
- 6.1 Market Concentration
- 6.2 Strategic Moves and Funding
- 6.3 Market Share Analysis
- 6.4 Company Profiles (includes Global level Overview, Market level overview, Core Segments, Financials as available, Strategic Information, Market Rank/Share for key companies, Products and Services, and Recent Developments)
- 6.4.1 Oracle Corporation
- 6.4.2 IBM Corporation
- 6.4.3 Siemens AG
- 6.4.4 Schneider Electric SE
- 6.4.5 ABB Ltd
- 6.4.6 General Electric Company
- 6.4.7 SAS Institute Inc.
- 6.4.8 SAP SE
- 6.4.9 Capgemini SE
- 6.4.10 Teradata Corporation
- 6.4.11 Hitachi Energy Ltd.
- 6.4.12 Landis+Gyr AG
- 6.4.13 Itron Inc.
- 6.4.14 AutoGrid Systems Inc.
- 6.4.15 Wipro Ltd.
- 6.4.16 Accenture plc
- 6.4.17 Amazon Web Services (AWS) Utilities
- 6.4.18 Microsoft Azure Energy
- 6.4.19 Enel X
- 6.4.20 Nexant Inc.
- 6.4.21 OSIsoft (AVEVA)
- 6.4.22 Uptake Technologies
- 6.4.23 Bidgely Inc.
- 6.4.24 Smarter Grid Solutions
7 MARKET OPPORTUNITIES AND FUTURE OUTLOOK
- 7.1 White-space and Unmet-need Assessment
- 7.2 AI-driven predictive maintenance for DER-rich grids
- 7.3 Grid-edge analytics marketplaces
- 7.4 Green hydrogen and storage optimisation analytics
 公共產業和能源分析市場規模、佔有率和成長分析:按分析類型、應用、部署類型、最終用戶和地區分類-2026-2033年產業預測
 全球能源與公用事業產業分析市場(至2031年):按應用與最終用戶分類
 2026年全球照明能源分析市場報告2026年全球能源使用分析應用市場報告
 能源分析市場預測至2034年-按解決方案類型、組件、部署模式、技術、應用、最終用戶和地區分類的全球分析2026年全球能源與公用事業分析市場報告
 公共產業與能源分析市場規模、佔有率、趨勢和預測:按類型、部署、應用、產業和地區分類,2026-2034 年
 全球能源和公用事業分析市場規模:按類型、部署模型、地區、範圍和預測