


 |
市場調查報告書
商品編碼
1850044
移動式製圖系統:市場佔有率分析、產業趨勢、統計數據和成長預測(2025-2030 年)Mobile Mapping Systems - Market Share Analysis, Industry Trends & Statistics, Growth Forecasts (2025 - 2030) |
||||||
※ 本網頁內容可能與最新版本有所差異。詳細情況請與我們聯繫。
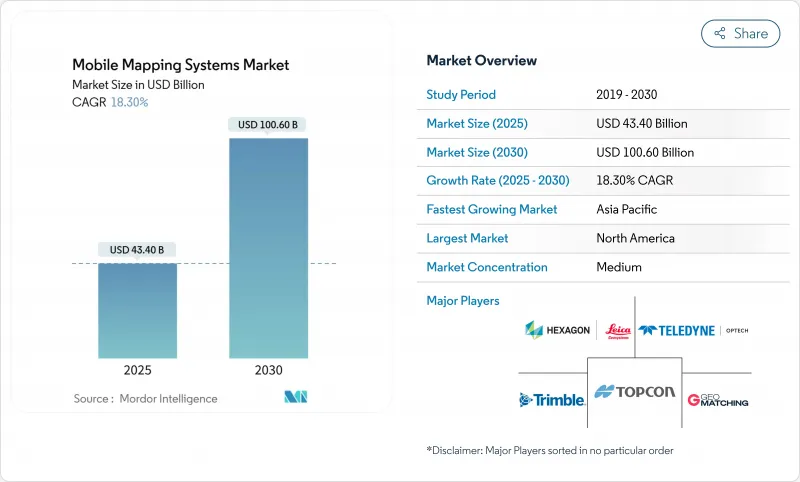
預計到 2025 年,移動式製圖系統市場規模將達到 434 億美元,到 2030 年將達到 1,006 億美元,複合年成長率為 18.30%。
人工智慧驅動的企業級特徵提取技術以及固體雷達價格的持續下降,不斷提升服務供應商和終端用戶的利潤率,重塑了採購經濟格局。政府數位雙胞胎技術的強制要求、與車輛無關的感測器有效載荷的興起以及新型訂閱經營模式的出現,推動了基礎設施、採礦和緊急管理等領域的應用。同時,供應商不斷加強軟體整合,縮短了數據到決策的周期,擴大了移動式製圖系統市場的潛在用戶群,並加劇了對增值分析的競爭。
全球移動式製圖系統市場趨勢與洞察
與任何車輛整合
將感測器應用於鐵路車輛、卡車、自動駕駛班車甚至船舶的能力,拓寬了移動式製圖系統的市場。德國鐵路公司於2022年認證了Trimble的MX9平台,使其能夠以100公里/小時的速度進行鐵路測繪,檢驗了其在歐洲鐵路走廊沿線不間斷的資產採集能力。先前需要安排週末停運進行人工LiDAR掃描的交通運輸機構,現在可以在正常運作期間部署與車輛無關的有效載荷,從而加快檢查週期並降低安全風險。在德國和加拿大城市數位雙胞胎專案中,類似的整合應用也使自動街道清潔車能夠進行夜間路緣級測繪,這表明跨平台相容性正在成為設備製造商的收入成長點。
政府強制推行數位雙胞胎
英國國家數位孿生舉措等國家級計畫制定了強制性資料標準,要求輸入公分級3D資料。各市政當局積極響應,委託開展道路、橋樑和公共建築的高密度移動雷射雷達(LiDAR)測繪,以創建城市尺度的孿生模型,從而簽訂多年服務契約,並刺激了現代化感測器鑽機的採購。烏普薩拉生物多樣性走廊計畫將LiDAR與地理資訊系統(GIS)分析相結合,充分展現了監管推動如何轉化為對動態、可更新空間資料集的即時需求。因此,移動式製圖系統市場受益於與長期基礎設施韌性目標相關的可預測的公共部門資金流。
購置和部署系統成本高昂
頂級行動測繪套裝的價格仍然在25萬美元到75萬美元之間,對於規模較小的土木工程公司而言仍然難以負擔。馬來西亞2022年的一項道路設計研究指出,儘管雷射雷達(LiDAR)具有明顯的技術優勢,但由於資本支出問題,競標被推遲。在拉丁美洲和非洲,資金籌措障礙更大,當地銀行很少提供以資產為抵押的專用地理空間硬體租賃服務。供應商推出了「測繪即服務」訂閱模式,但前期投資仍是限制移動式製圖系統市場潛在需求的最大因素。
細分市場分析
到2024年,硬體部分將佔據移動式製圖系統市場佔有率的51%,這印證了該領域長期以來對資本密集型感測器套件的依賴。高階車載鑽機將3.6MHz雷射掃描器與7,200萬像素全景相機結合,而像徠卡BLK2GO這樣的手持設備則將雷射雷達和視覺SLAM技術整合到僅重一公斤的設備中。然而,感測器尺寸的縮小和固態技術的創新降低了單位成本,使得設備更新換代更加頻繁,並促進了模組化升級。
預計到2030年,服務領域將以20.70%的複合年成長率實現最快成長,這主要得益於企業將複雜的資料處理外包。人工智慧雲端平台能夠將原始點雲資料轉換為可用於CAD的成品,從而降低企業內部營運成本。這種模式已將利潤來源從硬體利潤轉向經常性分析收入,加速了移動式製圖系統市場的結構轉型。隨著按需付費服務在新興經濟體的普及,移動式製圖系統即服務(MaaS)的市場規模預計將進一步擴大。
到2024年,車載平台將佔據移動式製圖系統市場62%的佔有率,主要用於高速公路和鐵路沿線。安裝在SUV上的雙頭掃描儀一次即可採集路面磨損情況和路邊設施資訊,從而整合整個機構的交通預算。
無人機有效載荷以12.90%的複合年成長率快速成長,使得垂直礦井、懸崖峭壁和災區等區域能夠進行快速的雷射雷達覆蓋。更輕的固態感測器提高了飛行續航能力,而機載人工智慧則能即時過濾植被,從而減少後續的作業量。軌道專用滑車和背包式設備滿足了特定需求,豐富了設備配置,這將為未來移動式製圖系統市場規模的成長提供支撐。
移動式製圖市場按組件(硬體、軟體、服務)、安裝類型(車載、軌道交通、其他)、應用(影像服務、航空移動式製圖、其他)、最終用戶(政府、石油天然氣、礦業、軍事、其他)和地區進行細分。市場預測以美元計價。
區域分析
到2024年,北美將佔據移動式製圖系統市場38%的佔有率。聯邦基礎設施建設資金和充足的國防情報、監視與偵察(ISR)預算促進了感測器需求的穩定成長。試驗計畫表明,在全州範圍內投資1美元用於移動雷射雷達(LiDAR)建設,可獲得2美元的回報,從而加強了預算分配。日趨成熟的生態系統、充足的熟練勞動力以及國內供應商積極的研發活動,共同協助該地區保持領先地位。
亞太地區以19.30%的複合年成長率成為成長最快的地區,這主要得益於中國和印度的智慧城市建設投入、日本的韌性規劃以及韓國的自動駕駛車輛測繪走廊計畫。到2025年,亞太地區的用戶將佔到熱門設備比價網站全球流量的近一半,顯示該地區用戶參與度高,並將促成無人機和車輛系統的訂單。低成本感測器正在推動地方政府部門的入門級應用,從而擴大移動式製圖系統市場的基礎。
歐洲、中東和非洲以及南美洲的需求呈現出多樣化的特徵。在歐洲,永續性指令推動了環境監測計劃的發展,例如德國城市中的卡車交通雷射雷達監測。在中東,管道和特大城市計畫佔據了主導地位,而巴西和智利的採礦業則促進了南美洲的銷售。非洲市場仍處於起步階段,但南非的基礎設施勘測計畫為其帶來了成長動力。在所有地區,移動式製圖與雲端運算、物聯網和人工智慧的整合都為垂直產業應用提供了支撐,從而推動了全球移動式製圖系統市場的發展。
其他福利:
- Excel格式的市場預測(ME)表
- 3個月的分析師支持
目錄
第1章 引言
- 研究假設和市場定義
- 調查範圍
第2章調查方法
第3章執行摘要
第4章 市場情勢
- 市場概覽
- 市場促進因素
- 可與任何類型的車輛整合
- 政府數位雙胞胎授權
- 固態LiDAR成本下降
- 利用人工智慧進行自動特徵提取
- 介紹自主機器人和無人機
- 國防情報、監視與偵察現代化預算
- 市場限制
- 購置和實施系統成本高
- 熟練操作人員短缺
- 資料隱私和監控法規
- 建築業資本投資的週期性
- 供應鏈分析
- 監管環境
- 技術展望
- 波特五力分析
- 供應商的議價能力
- 消費者議價能力
- 新進入者的威脅
- 替代品的威脅
- 競爭對手之間的競爭
第5章 市場規模與成長預測
- 按組件
- 硬體
- 軟體
- 服務
- 按安裝類型
- 車載類型
- 鐵路車輛安裝型
- 無人機搭載
- 其他
- 透過使用
- 影像服務
- 空中移動式製圖
- 緊急應變計劃
- 網路應用
- 設施管理
- 衛星
- 按最終用戶行業分類
- 政府
- 石油和天然氣
- 礦業
- 軍隊
- 其他終端用戶產業
- 按地區
- 北美洲
- 美國
- 加拿大
- 墨西哥
- 歐洲
- 英國
- 德國
- 法國
- 義大利
- 其他歐洲地區
- 亞太地區
- 中國
- 日本
- 印度
- 韓國
- 亞太其他地區
- 中東
- 以色列
- 沙烏地阿拉伯
- 阿拉伯聯合大公國
- 土耳其
- 其他中東地區
- 非洲
- 南非
- 埃及
- 其他非洲地區
- 南美洲
- 巴西
- 阿根廷
- 其他南美洲
- 北美洲
第6章 競爭情勢
- 市場集中度
- 策略趨勢
- 市佔率分析
- 公司簡介
- Leica Geosystems AG(Hexagon AB)
- Trimble Inc.
- Topcon Corporation
- Teledyne Optech Inc.
- RIEGL Laser Measurement Systems GmbH
- Zoller+Frohlich GmbH
- NavVis GmbH
- GeoSLAM Ltd.
- Kaarta Inc.
- Mandli Communications Inc.
- Applanix Corporation
- Siteco Informatica Srl
- YellowScan
- Fugro NV
- Cyclomedia Technology BV
- Imajing SAS
- Velodyne Lidar Inc.
- Ouster Inc.
- SureStar Technology Co., Ltd.
- Innoviz Technologies Ltd.
- Hesai Technology Co., Ltd.
- RoboSense(Suteng Innovation Technology Co., Ltd.)
- OxTS Ltd.
第7章 市場機會與未來展望
The mobile mapping systems market size is estimated at USD 43.4 billion in 2025 and is projected to reach USD 100.6 billion by 2030, reflecting an 18.30% CAGR.
Enterprise-grade feature extraction powered by artificial intelligence and steadily falling solid-state LiDAR prices continued to reshape acquisition economics, improving margins for service providers and end users. Government digital-twin mandates, the rise of vehicle-agnostic sensor payloads, and new subscription business models expanded adoption in infrastructure, mining, and emergency management. Meanwhile, vendors increased software integrations that shorten data-to-decision cycles, broadening the mobile mapping systems market addressable base and intensifying competition around value-added analytics.
Global Mobile Mapping Systems Market Trends and Insights
Integration with All Kinds of Vehicles
The ability to mount sensors on railcars, trucks, autonomous shuttles, and even boats widened the mobile mapping systems market scope. Deutsche Bahn certified Trimble's MX9 platform for 100 km/h rail surveys in 2022, validating non-stop asset capture for European rail corridors. Transportation agencies that previously scheduled weekend closures for manual LiDAR scans now deploy vehicle-independent payloads during regular service, accelerating inspection cycles and reducing safety risks. Similar integrations on autonomous road sweepers enabled night-time curb-level mapping for urban digital-twin programs in Germany and Canada, demonstrating how cross-platform compatibility has become a revenue driver for equipment makers.
Government Digital-Twin Mandates
National programs such as the United Kingdom's National Digital Twin initiative established compulsory data standards that require centimeter-grade 3D inputs. Municipalities responded by commissioning high-density mobile LiDAR of roadways, bridges, and public buildings to populate city-scale twins, spawning multi-year service contracts and stimulating procurement of modern sensor rigs. Uppsala's biodiversity corridor planning, which combined LiDAR with GIS analytics, showed how regulatory push translated into immediate demand for dynamic, update-ready spatial datasets. The mobile mapping systems market, therefore, benefited from predictable public-sector funding streams tied to long-range infrastructure resilience goals.
High Cost of System Acquisition and Deployment
Top-tier mobile mapping packages still commanded USD 250,000-750,000, a threshold that remained prohibitive for small civil-engineering firms. A Malaysian road-design study in 2022 highlighted cap-ex as the main reason LiDAR bidding was deferred despite clear technical gains. Financing hurdles were sharper in Latin America and Africa, where local banks rarely offered asset-backed leasing for specialized geospatial hardware. Vendors responded with "mapping-as-a-service" subscriptions, yet up-front investment persisted as the most significant drag on addressable demand within the mobile mapping systems market.
Other drivers and restraints analyzed in the detailed report include:
- Declining Solid-State LiDAR Costs
- AI-Powered Automatic Feature Extraction
- Skilled-Operator Shortage
For complete list of drivers and restraints, kindly check the Table Of Contents.
Segment Analysis
The hardware segment accounted for 51% of the mobile mapping systems market share in 2024, underscoring its past reliance on capital-intensive sensor suites. Premium vehicle rigs paired 3.6 MHz laser scanners with 72 MP panoramic cameras, while handheld units such as Leica's BLK2GO blended LiDAR with visual SLAM in one-kilogram packages. However, shrinking sensor footprints and solid-state innovations compressed unit costs, allowing more frequent refresh cycles and fostering modular upgrades.
The services segment achieved the fastest 20.70% CAGR through 2030 as organizations outsourced complex data processing. AI-enabled cloud platforms converted raw point clouds into CAD-ready deliverables, lowering internal overheads. This model shifted profit pools from hardware margins toward recurring analytics revenue, accelerating a structural transition in the mobile mapping systems market. The mobile mapping systems market size attached to services is projected to widen as pay-per-use offerings broaden access in emerging economies.
Vehicle-mounted platforms controlled 62% of the mobile mapping systems market in 2024, favored for highway and rail corridors where uninterrupted acquisition at posted speeds maximized productivity. Dual-head scanners on SUVs captured both pavement distress and roadside assets during a single pass, consolidating budgets across transportation agencies.
Drone-based payloads, expanding at 12.90% CAGR, opened vertical mines, cliff faces, and disaster zones to rapid LiDAR coverage. Lighter solid-state sensors extended flight endurance while onboard AI filtered vegetation in real time, reducing downstream workload. Railway-specific trolleys and backpack units addressed niche needs yet collectively contributed to a diversified equipment mix underpinning future mobile mapping systems market size momentum.
Mobile Mapping Market is Segmented by Component (Hardware, Software, Services), Mounting Type (Vehicle Mounted, Railway Mounted, and More), Application (Imaging Services, Aerial Mobile Mapping, and More), End-User Verticals (Government, Oil and Gas, Mining, Military, Others), and Geography. The Market Forecasts are Provided in Terms of Value (USD).
Geography Analysis
North America accounted for 38% of the mobile mapping systems market in 2024. Federal infrastructure funding and strong defense ISR budgets nurtured steady sensor demand. Pilot programs demonstrated a USD 2 return for every USD 1 invested in statewide mobile LiDAR, reinforcing budget allocations. Ecosystem maturity, abundant skilled labor, and aggressive R and D by domestic vendors sustained the region's leadership.
Asia-Pacific recorded the fastest 19.30% CAGR, driven by smart-city spending in China and India, Japan's resilience planning, and South Korea's autonomous-vehicle mapping corridors. Nearly half of global traffic on popular equipment-comparison portals originated from Asia-Pacific users in 2025, signaling high engagement that translated into orders for both drone and vehicle systems. Lower-cost sensors broadened entry-level uptake among provincial agencies, expanding the mobile mapping systems market footprint.
Europe, the Middle East, Africa, and South America presented mixed demand profiles. European mandates around sustainability spurred environmental monitoring projects such as truck-traffic lidar in German cities. The Middle East prioritized pipeline and megacity initiatives, while Brazilian and Chilean mines underpinned South American sales. Africa remained nascent but showed momentum in South African infrastructure surveys. Across all regions, integration of mobile mapping with cloud, IoT, and AI underpinned cross-vertical use cases, lifting the global mobile mapping systems market momentum.
- Leica Geosystems AG (Hexagon AB)
- Trimble Inc.
- Topcon Corporation
- Teledyne Optech Inc.
- RIEGL Laser Measurement Systems GmbH
- Zoller+Frohlich GmbH
- NavVis GmbH
- GeoSLAM Ltd.
- Kaarta Inc.
- Mandli Communications Inc.
- Applanix Corporation
- Siteco Informatica Srl
- YellowScan
- Fugro N.V.
- Cyclomedia Technology BV
- Imajing SAS
- Velodyne Lidar Inc.
- Ouster Inc.
- SureStar Technology Co., Ltd.
- Innoviz Technologies Ltd.
- Hesai Technology Co., Ltd.
- RoboSense (Suteng Innovation Technology Co., Ltd.)
- OxTS Ltd.
Additional Benefits:
- The market estimate (ME) sheet in Excel format
- 3 months of analyst support
TABLE OF CONTENTS
1 INTRODUCTION
- 1.1 Study Assumptions and Market Definition
- 1.2 Scope of the Study
2 RESEARCH METHODOLOGY
3 EXECUTIVE SUMMARY
4 MARKET LANDSCAPE
- 4.1 Market Overview
- 4.2 Market Drivers
- 4.2.1 Integration with All Kinds of Vehicles
- 4.2.2 Government Digital-Twin Mandates
- 4.2.3 Declining Solid-State LiDAR Costs
- 4.2.4 AI-Powered Automatic Feature Extraction
- 4.2.5 Autonomous Robots and Drone Adoption
- 4.2.6 Defense ISR Modernization Budgets
- 4.3 Market Restraints
- 4.3.1 High Cost of System Acquisition and Deployment
- 4.3.2 Skilled-Operator Shortage
- 4.3.3 Data-Privacy and Surveillance Regulations
- 4.3.4 Construction-Sector Cap-ex Cyclicality
- 4.4 Supply Chain Analysis
- 4.5 Regulatory Landscape
- 4.6 Technological Outlook
- 4.7 Porter's Five Forces Analysis
- 4.7.1 Bargaining Power of Suppliers
- 4.7.2 Bargaining Power of Consumers
- 4.7.3 Threat of New Entrants
- 4.7.4 Threat of Substitutes
- 4.7.5 Intensity of Competitive Rivalry
5 MARKET SIZE AND GROWTH FORECASTS (VALUE)
- 5.1 By Component
- 5.1.1 Hardware
- 5.1.2 Software
- 5.1.3 Services
- 5.2 By Mounting Type
- 5.2.1 Vehicle Mounted
- 5.2.2 Railway Mounted
- 5.2.3 Drone Mounted
- 5.2.4 Others
- 5.3 By Application
- 5.3.1 Imaging Services
- 5.3.2 Aerial Mobile Mapping
- 5.3.3 Emergency Response Planning
- 5.3.4 Internet Applications
- 5.3.5 Facility Management
- 5.3.6 Satellite
- 5.4 By End-user Verticals
- 5.4.1 Government
- 5.4.2 Oil and Gas
- 5.4.3 Mining
- 5.4.4 Military
- 5.4.5 Other End-user Verticals
- 5.5 By Region
- 5.5.1 North America
- 5.5.1.1 United States
- 5.5.1.2 Canada
- 5.5.1.3 Mexico
- 5.5.2 Europe
- 5.5.2.1 United Kingdom
- 5.5.2.2 Germany
- 5.5.2.3 France
- 5.5.2.4 Italy
- 5.5.2.5 Rest of Europe
- 5.5.3 Asia-Pacific
- 5.5.3.1 China
- 5.5.3.2 Japan
- 5.5.3.3 India
- 5.5.3.4 South Korea
- 5.5.3.5 Rest of Asia-Pacific
- 5.5.4 Middle East
- 5.5.4.1 Israel
- 5.5.4.2 Saudi Arabia
- 5.5.4.3 United Arab Emirates
- 5.5.4.4 Turkey
- 5.5.4.5 Rest of Middle East
- 5.5.5 Africa
- 5.5.5.1 South Africa
- 5.5.5.2 Egypt
- 5.5.5.3 Rest of Africa
- 5.5.6 South America
- 5.5.6.1 Brazil
- 5.5.6.2 Argentina
- 5.5.6.3 Rest of South America
- 5.5.1 North America
6 COMPETITIVE LANDSCAPE
- 6.1 Market Concentration
- 6.2 Strategic Moves
- 6.3 Market Share Analysis
- 6.4 Company Profiles (includes Global Level Overview, Market Level Overview, Core Segments, Financials as available, Strategic Information, Market Rank/Share for key companies, Products and Services, and Recent Developments)
- 6.4.1 Leica Geosystems AG (Hexagon AB)
- 6.4.2 Trimble Inc.
- 6.4.3 Topcon Corporation
- 6.4.4 Teledyne Optech Inc.
- 6.4.5 RIEGL Laser Measurement Systems GmbH
- 6.4.6 Zoller+Frohlich GmbH
- 6.4.7 NavVis GmbH
- 6.4.8 GeoSLAM Ltd.
- 6.4.9 Kaarta Inc.
- 6.4.10 Mandli Communications Inc.
- 6.4.11 Applanix Corporation
- 6.4.12 Siteco Informatica Srl
- 6.4.13 YellowScan
- 6.4.14 Fugro N.V.
- 6.4.15 Cyclomedia Technology BV
- 6.4.16 Imajing SAS
- 6.4.17 Velodyne Lidar Inc.
- 6.4.18 Ouster Inc.
- 6.4.19 SureStar Technology Co., Ltd.
- 6.4.20 Innoviz Technologies Ltd.
- 6.4.21 Hesai Technology Co., Ltd.
- 6.4.22 RoboSense (Suteng Innovation Technology Co., Ltd.)
- 6.4.23 OxTS Ltd.
7 MARKET OPPORTUNITIES AND FUTURE OUTLOOK
- 7.1 White-space and Unmet-need Assessment


