


 |
市場調查報告書
商品編碼
1850035
資料中心刀鋒伺服器:市場佔有率分析、產業趨勢、統計資料和成長預測(2025-2030 年)Data Center Blade Server - Market Share Analysis, Industry Trends & Statistics, Growth Forecasts (2025 - 2030) |
||||||
※ 本網頁內容可能與最新版本有所差異。詳細情況請與我們聯繫。
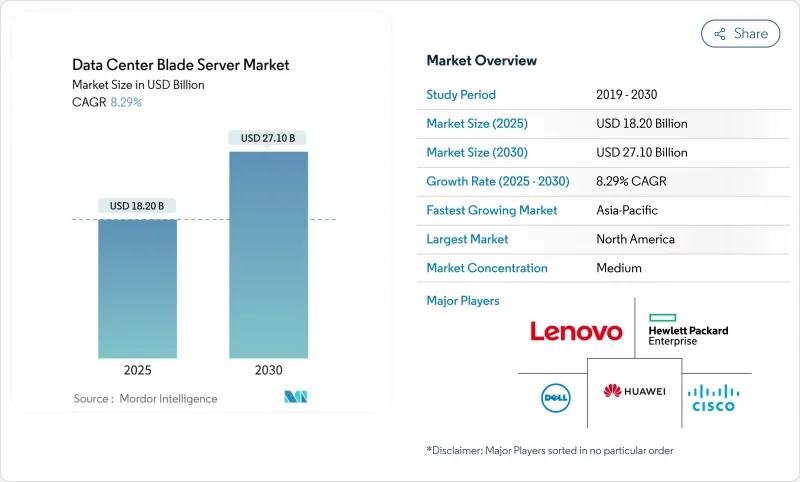
資料中心刀鋒伺服器市場預計將從 2025 年的 182 億美元成長到 2030 年的 271 億美元,複合年成長率為 8.29%。
隨著人工智慧和機器學習工作負載的採用率不斷提高,以及運算密度需求的變化,供應商正轉向可組合、分解的刀片設計,將運算、儲存和網路資源分開。這種架構轉變可實現更高的利用率和更快的工作負載重新分配,而直接液冷、矽光電背板和先進的底盤管理軟體則有助於管理目前超過 30kW 的機架功率。北美仍然是規模領導者,但由於印度、中國和新加坡的大規模待開發區建設,亞太地區正在加速成長。雖然主機託管設施仍然是最大的客戶群,但超大規模資料中心營運商正在製定技術議程,轉向可提供更高機架級效率的專用人工智慧刀片系統。
全球資料中心刀鋒伺服器市場趨勢與洞察
AI/ML 工作負載的機架級功率密度激增
AI推理和訓練集群目前正在將機架功率從10-15千瓦推高至30-50千瓦。開放運算專案的OSAI規範目標機架架構功率範圍為250千瓦至1兆瓦,鼓勵刀鋒伺服器供應商整合高效穩壓器和直接液冷技術。戴爾的PowerEdge XE9680L證明了底盤級氣流、冷卻板迴路和AI專用加速器可以共存,而無需進行熱感節流。國際能源總署(IEA)預測,到2030年,以AI為中心的資料中心的能耗可能達到945太瓦時,因此,節能刀片設計將成為營運商策略的核心。
邊緣和雲融合加速微模組化資料中心的採用
5G 部署和超低延遲服務正在將運算推向網路邊緣,從而催生了對預接線、預冷卻、微模組資料中心的需求。谷歌的模組化邊緣設備專利強調了整合電源和熱交換的安全多租戶機架組件的重要性。電訊營運商正在將其 6000 億美元資本支出計劃中的很大一部分分配給此類邊緣站點,這使得刀片伺服器供應商有機會提供針對有限空間客製化的四分之一高度節點。
矽光電和 800GbE 背板遷移推動資本支出
切換到光子積體電路和 800GbE 結構可以改善延遲和頻寬,但需要新的底盤、中板連接器和重定時器卡。國家機構承認效率提升,但警告稱,初始部署需要大量資本投入,尤其是對中型企業而言。對 CXL 記憶體分區的研究表明,投資回收期需要數年,這迫使營運商錯開升級。
細分分析
到2024年,Tier 3資料中心將佔據資料中心刀鋒伺服器市場的42.21%,因為它們的N+1冗餘配置符合主流企業SLA。 Tier 4資料中心雖然數量較少,但預計在AI訓練叢集的彈性需求推動下,複合年成長率將達到12.2%。這股勢頭使Tier 4成為100%液冷底盤和矽光電互連的試驗場。
一級和二級資料中心設施的營運商通常服務於邊緣聚合和分支工作負載,他們正在採用標準化刀片伺服器,以在提高自動化程度的同時保持成本控制。根據Infrastructure Masons的報告,目前90%的電力成長源自於AI模型訓練,而這種壓力逐漸轉移到規模較小的資料中心,這些資料中心必須適應更高的電力消耗和機架密度。因此,供應商正在打包套件,用於改造具有存儲通道和後門熱交換器的低層機房,從而保持更廣泛的資料中心刀片伺服器市場的強勁成長勢頭。
半高刀鋒伺服器支援雙路 CPU、充足的 DIMM 插槽和 PCIe 擴展,足以處理大多數虛擬化和資料庫任務。半高刀鋒伺服器仍然是企業主機代管機架的主力,而全高刀鋒伺服器則繼續支援四路、記憶體受限的工作負載,例如記憶體內分析。
四分之一高度和微刀片節點是成長最快的切片,複合年成長率為 14.12%,因為它們每個 10U 機架支援 16 到 32 個運算托架,非常適合有限的邊緣空間。供應商現在正在將 GPU 加速器整合到這些緊湊的切片中,以便在基地台站點實現即時推理。與 Open Rack v3 規範的兼容性允許在同一機櫃內進行混合部署,從而支援資料中心刀鋒伺服器市場的邊緣擴展。
資料中心刀鋒伺服器市場報告按類型(一級刀鋒伺服器、二級刀鋒伺服器、其他)、外形規格(半高刀鋒伺服器、全高刀鋒伺服器、其他)、最終用戶垂直領域(金融服務、保險和保險業、製造業、其他)、資料中心類型(超大規模資料中心/雲端服務供應商、其他)和地區(亞太地區、歐洲、其他)對產業進行分類。市場預測以美元計算。
區域分析
受北維吉尼亞、德克薩斯和矽谷超大規模園區的推動,北美將在2024年佔據資料中心刀鋒伺服器市場的42.23%。勞倫斯柏克萊國家實驗室估計,2023年美國資料中心的用電量將達到176太瓦時,無疑加劇了液冷刀片在降低設施PUE的迫切性。加拿大和墨西哥將透過區域主權雲和災難復原區進一步增加對液冷刀片的需求。
亞太地區將成為成長最快的地區,2025年至2030年的複合年成長率將達到12.54%。中國正在部署大型人工智慧雲端叢集,而印度需要在2030年前將裝置容量從1.35兆瓦擴大到50兆瓦,才能實現其數位經濟目標。新加坡的政策框架優先考慮包含高密度刀片和熱回收冷卻器的設計,並賦予其容量許可權。日本和澳洲正在沿海底電纜登陸站擴展其邊緣運算覆蓋範圍,並採用四分之一高度的刀片用於內容快取。
在嚴格的效率和數據主權規則下,歐洲市場正在穩步擴張。生態設計2019/424的修訂鼓勵刀片底盤支援35°C以上的熱水冷卻,從而簡化與區域供熱環路的整合。中東和非洲正在吸引投資,為金融科技和遊戲客戶提供雲端服務。南美地區以巴西的網際網路交換中心為中心的部署正在增加,營運商正在部署可組合刀片以應對季節性流量高峰。這些區域動態正在提升資料中心刀鋒伺服器市場的全球重要性。
其他福利
- Excel 格式的市場預測 (ME) 表
- 3個月的分析師支持
目錄
第1章 引言
- 研究假設和市場定義
- 調查範圍
第2章調查方法
第3章執行摘要
第4章 市場狀況
- 市場概況
- 市場促進因素
- 為 AI/ML 工作負載提供飆升的機架級功率密度
- 透過邊緣雲端整合加速微模組資料中心的部署
- 高度伺服器整合可降低營運成本和房地產成本
- 液冷底盤獲得監管激勵措施(歐盟、新加坡)
- 超超大規模資料中心業者越來越青睞可組合分散式刀片
- 市場限制
- 矽光電和 800 Gb E 背板遷移推動資本支出
- 供應商集中在獨特的底盤生態系統中
- 管理多結構、分散式架構的技能差距
- ORAN/5G收益的延遲將延長通訊業者中心的投資回報
- 供應鏈分析
- 監管和永續性格局
- 技術展望(PCIe 6.0、CXL 3.0、矽光電)
- 波特五力模型
- 新進入者的威脅
- 買方的議價能力
- 供應商的議價能力
- 替代品的威脅
- 競爭的激烈程度
- 評估宏觀經濟趨勢對市場的影響
第5章市場規模與成長預測(價值)
- 資料中心層
- 1級和2級
- 第 3 層
- 第 4 層
- 按外形規格
- 半高刀片
- 全高刀片
- 四分之一高度/微刀片
- 按應用程式/工作負載
- 虛擬化和私有雲端
- 高效能運算 (HPC)
- 人工智慧/機器學習和數據分析
- 以儲存為中心
- 邊緣/物聯網閘道器
- 依資料中心類型
- 超大規模資料中心業者/雲端服務供應商
- 主機代管設施
- 企業和邊緣
- 按最終用途行業
- BFSI
- IT 和通訊/CSP
- 醫療保健和生命科學
- 製造業和工業4.0
- 能源和公共產業
- 政府和國防
- 按地區
- 北美洲
- 美國
- 加拿大
- 墨西哥
- 歐洲
- 英國
- 德國
- 法國
- 義大利
- 西班牙
- 其他歐洲地區
- 亞太地區
- 中國
- 日本
- 印度
- 新加坡
- 澳洲
- 馬來西亞
- 其他亞太地區
- 南美洲
- 巴西
- 智利
- 阿根廷
- 南美洲其他地區
- 中東
- 阿拉伯聯合大公國
- 沙烏地阿拉伯
- 土耳其
- 其他中東地區
- 非洲
- 南非
- 奈及利亞
- 其他非洲國家
- 北美洲
第6章 競爭態勢
- 市場集中度
- Strategic Initiatives
- 市佔率分析
- 公司簡介
- Cisco Systems Inc.
- Dell Technologies
- Hewlett Packard Enterprise
- Huawei Technologies Co. Ltd.
- IBM Corporation
- Fujitsu Ltd.
- Lenovo Group Ltd.
- NEC Corporation
- Oracle Corporation
- Super Micro Computer Inc.
- Inspur Group
- Quanta Cloud Technology
- Gigabyte Technology
- Hitachi Ltd.
- AMD(Pensando)
- Nvidia Corp.(Grace Superchip platforms)
- Marvell Technology(DPU-centric blades)
- Broadcom Inc.(Switch-on-Blade)
- Advantech Co. Ltd.
- Silicom Ltd.
- ZTE Corporation
第7章 市場機會與未來展望
The Data Center Blade Server market is valued at USD 18.2 billion in 2025 and is forecast to reach USD 27.10 billion by 2030, expanding at an 8.29% CAGR.
Rising deployment of AI and machine-learning workloads is reshaping compute density requirements, pushing vendors toward composable, disaggregated blade designs that separate compute, storage and networking resources. This architectural shift enables higher utilization and rapid workload re-allocation, while direct liquid cooling, silicon-photonics backplanes and advanced chassis management software help operators manage rack power envelopes that now exceed 30 kW. North America retains scale leadership, yet Asia-Pacific is growing faster on the back of large greenfield builds in India, China and Singapore. Colocation facilities remain the largest customer group, but hyperscalers are setting the technical agenda as they move to purpose-built AI blade systems that deliver higher rack-level efficiency.
Global Data Center Blade Server Market Trends and Insights
Surging Rack-Level Power Density Accommodates AI/ML Workloads
AI inference and training clusters now push rack envelopes from 10-15 kW toward 30-50 kW. The Open Compute Project's OSAI specification targets 250 kW to 1 MW rack architectures, encouraging blade vendors to integrate high-efficiency voltage regulators and direct liquid cooling. Dell's PowerEdge XE9680L demonstrates how chassis-level airflow, cold-plate loops, and AI-specific accelerators can coexist without thermal throttling. The International Energy Agency projects that AI-focused data centers could consume 945 TWh by 2030, which keeps power-efficient blade design at the center of operator strategies
Edge-Cloud Convergence Accelerating Deployment in Micro-Modular DCs
5G rollouts and ultra-low-latency services push compute to the network edge, spawning demand for micro-modular data centers that can ship pre-wired and pre-cooled. Google's patent for modular edge facilities confirms the importance of secure, multitenant rack assemblies with integrated power and heat exchange. Telecom operators are allocating a sizeable share of their USD 600 billion CAPEX plan to such edge sites, giving blade vendors an opening to supply quarter-height nodes tailored for constrained footprints
CapEx Spike from Silicon-Photonics and 800 GbE Backplane Migration
Switching to photonic integrated circuits and 800 GbE fabrics unlocks latency and bandwidth gains but demands new chassis, mid-plane connectors and retimer cards. National agencies acknowledge the efficiency upside yet caution that early deployments bear heavy capital costs, particularly for mid-sized enterprises. Research into memory disaggregation over CXL suggests a multi-year payback, forcing operators to stagger upgrades
Other drivers and restraints analyzed in the detailed report include:
- High Server Consolidation Ratios Lower OPEX and Real-Estate Cost
- Liquid-Cooling Ready Chassis Gaining Regulatory Incentives
- Supplier Concentration in Proprietary Chassis Ecosystems
For complete list of drivers and restraints, kindly check the Table Of Contents.
Segment Analysis
Tier 3 facilities owned 42.21% of the Data Center Blade Server market in 2024, as their N+1 redundancy profile aligns with mainstream enterprise SLAs. Tier 4 sites, though smaller in count, are forecast to grow at 12.2% CAGR thanks to fault-tolerance demands from AI training clusters. This momentum positions Tier 4 as the proving ground for 100% liquid-cooled chassis and silicon-photonics interconnects.
Operators of Tier 1 and Tier 2 facilities, typically serving edge aggregation or branch workloads, adopt standardized blades to maintain cost discipline while gaining better automation. The Infrastructure Masons report links 90% of current power growth to AI model training, a load now propagating into even modest sites that must accommodate higher power draw and rack density. As a result, vendors are packaging kits that retrofit lower-tier rooms with containment aisles and rear-door heat exchangers, preserving momentum for the wider Data Center Blade Server market.
Half-height blades delivered 48.41% revenue in 2024, supporting dual-socket CPUs, ample DIMM slots and PCIe expansion for most virtualization and database tasks. They remain the workhorse of enterprise colocation racks. Full-height models continue to serve quad-socket, memory-bound workloads such as in-memory analytics.
Quarter-height and micro-blade nodes are the fastest-growing slice at 14.12% CAGR because they fit 16-32 compute sleds per 10U shelf, ideal for limited edge footprints. Vendors now integrate GPU accelerators into these compact sleds, enabling real-time inference at cell-tower sites. Compatibility with Open Rack v3 specifications allows mixed deployment inside the same cabinet, sustaining the Data Center Blade Server market's edge expansion narrative.
Data Center Blade Server Market Report Segments the Industry Into Type (Tier 1, Tier 2, and More), Form Factor(Half-Height Blades, Full-Height Blades, and More), End-User Verticals (BFSI, Manufacturing, and More), Data Center Type(Hyperscalers/Cloud Service Provider, and More) and Geography (Asia-Pacific, Europe, and More). The Market Forecasts are Provided in Terms of Value (USD).
Geography Analysis
North America controlled 42.23% of the Data Center Blade Server market in 2024, fueled by hyperscale campuses in Northern Virginia, Texas and Silicon Valley. The Lawrence Berkeley National Laboratory calculated 176 TWh of US data-center electricity use in 2023, raising urgency for liquid-cooled blades that cut facility PUEs. Canada and Mexico add incremental demand through regional sovereign-cloud and disaster-recovery zones.
Asia-Pacific is the fastest-growing theater at 12.54% CAGR from 2025-2030. China deploys massive AI cloud clusters, while India needs to expand installed capacity from 1.35 GW to 5 GW by 2030 to keep pace with digital-economy targets. Policy frameworks in Singapore award capacity licenses preferentially to designs that include high-density blades and heat-recovery chillers. Japan and Australia extend the edge footprint along subsea cable landing stations, embedding quarter-height blades for content caching.
Europe shows steady expansion under strict efficiency and data-sovereignty rules. Ecodesign 2019/424 revisions encourage blade chassis that support warm-water cooling above 35 °C, easing integration with district-heat loops. The Middle East and Africa attract investment for cloud on-ramps serving fintech and gaming customers. South America's installations cluster around Brazil's internet exchange hubs, where operators deploy composable blades to meet seasonal traffic peaks. These regional dynamics reinforce the global relevance of the Data Center Blade Server market.
- Cisco Systems Inc.
- Dell Technologies
- Hewlett Packard Enterprise
- Huawei Technologies Co. Ltd.
- IBM Corporation
- Fujitsu Ltd.
- Lenovo Group Ltd.
- NEC Corporation
- Oracle Corporation
- Super Micro Computer Inc.
- Inspur Group
- Quanta Cloud Technology
- Gigabyte Technology
- Hitachi Ltd.
- AMD (Pensando)
- Nvidia Corp. (Grace Superchip platforms)
- Marvell Technology (DPU-centric blades)
- Broadcom Inc. (Switch-on-Blade)
- Advantech Co. Ltd.
- Silicom Ltd.
- ZTE Corporation
Additional Benefits:
- The market estimate (ME) sheet in Excel format
- 3 months of analyst support
TABLE OF CONTENTS
1 INTRODUCTION
- 1.1 Study Assumptions and Market Definition
- 1.2 Scope of the Study
2 RESEARCH METHODOLOGY
3 EXECUTIVE SUMMARY
4 MARKET LANDSCAPE
- 4.1 Market Overview
- 4.2 Market Drivers
- 4.2.1 Surging rack-level power density accommodates AI/ML workloads
- 4.2.2 Edge-cloud convergence accelerating deployment in micro-modular DCs
- 4.2.3 High server consolidation ratios lower OPEX and real-estate cost
- 4.2.4 Liquid-cooling ready chassis gaining regulatory incentives (EU, Singapore)
- 4.2.5 Growing hyperscaler preference for composable disaggregated blades
- 4.3 Market Restraints
- 4.3.1 CapEx spike from silicon photonics and 800 Gb E backplane migration
- 4.3.2 Supplier concentration in proprietary chassis ecosystems
- 4.3.3 Skill-gap in managing multi-fabric, disaggregated architectures
- 4.3.4 Delayed ORAN/5G monetisation lengthening ROI for telco DCs
- 4.4 Supply-Chain Analysis
- 4.5 Regulatory and Sustainability Landscape
- 4.6 Technological Outlook (PCIe 6.0, CXL 3.0, silicon photonics)
- 4.7 Porter's Five Forces
- 4.7.1 Threat of New Entrants
- 4.7.2 Bargaining Power of Buyers
- 4.7.3 Bargaining Power of Suppliers
- 4.7.4 Threat of Substitutes
- 4.7.5 Intensity of Rivalry
- 4.8 Assessment of the Impact on Macro Economic Trends on the Market
5 MARKET SIZE AND GROWTH FORECASTS (VALUES)
- 5.1 By Data-Center Tier
- 5.1.1 Tier 1 and 2
- 5.1.2 Tier 3
- 5.1.3 Tier 4
- 5.2 By Form Factor
- 5.2.1 Half-height Blades
- 5.2.2 Full-height Blades
- 5.2.3 Quarter-height / Micro-blades
- 5.3 By Application / Workload
- 5.3.1 Virtualisation and Private Cloud
- 5.3.2 High-Performance Computing (HPC)
- 5.3.3 Artificial Intelligence/Machine Learning and Data Analytics
- 5.3.4 Storage-centric
- 5.3.5 Edge / IoT Gateways
- 5.4 By Data Center Type
- 5.4.1 Hyperscalers/Cloud Service Provider
- 5.4.2 Colocation Facilities
- 5.4.3 Enterprise and Edge
- 5.5 By End-use Industry
- 5.5.1 BFSI
- 5.5.2 IT and Telecom / CSPs
- 5.5.3 Healthcare and Life-Sciences
- 5.5.4 Manufacturing and Industry 4.0
- 5.5.5 Energy and Utilities
- 5.5.6 Government and Defence
- 5.6 By Geography
- 5.6.1 North America
- 5.6.1.1 United States
- 5.6.1.2 Canada
- 5.6.1.3 Mexico
- 5.6.2 Europe
- 5.6.2.1 United Kingdom
- 5.6.2.2 Germany
- 5.6.2.3 France
- 5.6.2.4 Italy
- 5.6.2.5 Spain
- 5.6.2.6 Rest of Europe
- 5.6.3 Asia-Pacific
- 5.6.3.1 China
- 5.6.3.2 Japan
- 5.6.3.3 India
- 5.6.3.4 Singapore
- 5.6.3.5 Australia
- 5.6.3.6 Malaysia
- 5.6.3.7 Rest of Asia-Pacific
- 5.6.4 South America
- 5.6.4.1 Brazil
- 5.6.4.2 Chile
- 5.6.4.3 Argentina
- 5.6.4.4 Rest of South America
- 5.6.5 Middle East
- 5.6.5.1 United Arab Emirate
- 5.6.5.2 Saudi Arabia
- 5.6.5.3 Turkey
- 5.6.5.4 Rest of Middle East
- 5.6.6 Africa
- 5.6.6.1 South Africa
- 5.6.6.2 Nigeria
- 5.6.6.3 Rest of Africa
- 5.6.1 North America
6 COMPETITIVE LANDSCAPE
- 6.1 Market Concentration
- 6.2 Strategic Initiatives
- 6.3 Market Share Analysis
- 6.4 Company Profiles (includes Global level Overview, Market level overview, Core Segments, Financials as available, Strategic Information, Market Rank/Share, Products and Services, Recent Developments)
- 6.4.1 Cisco Systems Inc.
- 6.4.2 Dell Technologies
- 6.4.3 Hewlett Packard Enterprise
- 6.4.4 Huawei Technologies Co. Ltd.
- 6.4.5 IBM Corporation
- 6.4.6 Fujitsu Ltd.
- 6.4.7 Lenovo Group Ltd.
- 6.4.8 NEC Corporation
- 6.4.9 Oracle Corporation
- 6.4.10 Super Micro Computer Inc.
- 6.4.11 Inspur Group
- 6.4.12 Quanta Cloud Technology
- 6.4.13 Gigabyte Technology
- 6.4.14 Hitachi Ltd.
- 6.4.15 AMD (Pensando)
- 6.4.16 Nvidia Corp. (Grace Superchip platforms)
- 6.4.17 Marvell Technology (DPU-centric blades)
- 6.4.18 Broadcom Inc. (Switch-on-Blade)
- 6.4.19 Advantech Co. Ltd.
- 6.4.20 Silicom Ltd.
- 6.4.21 ZTE Corporation
7 MARKET OPPORTUNITIES AND FUTURE OUTLOOK
- 7.1 White-space and Unmet-Need Assessment


