


 |
市場調查報告書
商品編碼
1850033
模組化資料中心:市場佔有率分析、行業趨勢、統計數據和成長預測(2025-2030 年)Modular Data Center - Market Share Analysis, Industry Trends & Statistics, Growth Forecasts (2025 - 2030) |
||||||
※ 本網頁內容可能與最新版本有所差異。詳細情況請與我們聯繫。
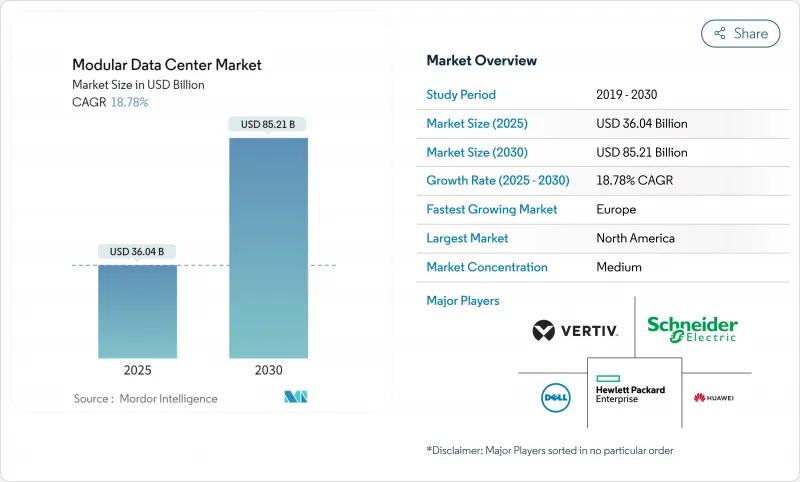
預計2025年模組化資料中心市場規模將達360.4億美元,2030年將達852.1億美元。
這一快速成長軌跡反映了向預製化、工廠整合設施的轉變。人工智慧帶來的高密度需求、靠近用戶的邊緣站點激增以及超大規模雲端營運商的全球建置標準化推動了這一需求。曾經的小眾液冷設計如今已具備商業性可行性,在某些情況下,其PUE值低於1.05,為許多新模組供電。同時,由於企業更傾向於承包整合而非內部組裝,以服務為中心的收益正在加速成長。隨著企業開始著眼於未來的工作負載而非適應過去的架構,待開發區計劃也正在加速發展。
全球模組化資料中心市場趨勢與洞察
邊緣運算的快速部署
由於視訊分析、自主系統和工業IoT要求低於 10 毫秒的延遲,邊緣部署的擴展速度遠快於集中式設施。模組化資料中心市場受益於安裝在零售屋頂、工廠車間和基地台機房的微型設施,因此無需長時間的施工。邊緣資料中心預計將以 37.9% 的複合年成長率成長,電訊和運輸業者擴大選擇一體化預製機殼,這些機櫃在出廠時已經過電源、冷卻和機架的預先測試。Delta的 SmartNode 產品線展示了整合式電池組和直列冷卻系統如何在惡劣的邊緣環境中保持運作。服務供應商也重視在數百個遠端位置複製設計的能力,從而簡化備件和培訓需求。對於供應商而言,分散式佔地面積可以擴大容量,即使每個單獨的佔地面積都小於核心站點。
超大規模和雲端採用激增
超大規模資料中心營運商每月新增的占地面積相當於幾個足球場,而模組化資料中心市場正成為緊跟步伐的首選方式。模組化結構可實現跨大洲的一致品管,並將部署時間從18個月縮短至不到9個月。雲端品牌受益於標準化的電源和網路拓撲,從而實現跨區域容量轉移,並簡化災害復原規劃。 ARANER預測,到2032年,超大規模資料中心產業規模將擴大至9,353億美元,對快速容量擴建的需求持續存在。從機器人佈線到基於人工智慧的氣流調節的整合自動化系統,如今已配備許多模組,並支援遠端位置的「熄燈」運行。這些因素共同增強了飛輪效應,縮短了建設週期,更快地釋放了資金,從而實現了更頻繁的擴張。
初始投資高且供應商鎖定
工廠整合的電源模組成本在每兆瓦75萬美元到100萬美元之間,這對中小型企業來說是一筆不小的開銷。專有互連技術加劇了資金籌措的複雜性,使得後期混合品牌的成本高昂,也加劇了企業對單一供應商鎖定的擔憂。由於低成本資本的取得管道有限,新興市場的門檻更高。營運費用的節省最終抵消了溢價,而財務長通常更重視短期現金流而非全生命週期經濟效益。提供租賃、收入分成或「容量即服務」協議的供應商可以緩解鎖定感,並鼓勵企業採用。
細分分析
到 2024 年,功能模組將佔模組化資料中心市場收入的 62.12%。整合 UPS、冷卻器和機架的標準化鋼骨塊提供了無風險的擴展途徑。營運商確切地知道將到達碼頭的是什麼以及它將如何運作。這種可預測性降低了計劃管理開銷並加快了併網核准。然而,隨著越來越多的客戶將從現場勘測到日常最佳化的所有工作外包出去,服務部門正以 19.45% 的更快複合核准成長。隨著功率密度的增加,管理流體化學和調整 AI 工作負載等問題需要大多數 IT 團隊內部不具備的利基技能。因此,服務提供者正在將設計、施工和長期營運結合到基於結果的合約中,將曾經的資本支出 (CapEx) 轉變為持續的資本支出 (OpEx)。
在許多競標中,功能模組如今整合了特定應用加速器、軟體定義架構和基於人工智慧的遙測技術。最新一代的EPG整合了模組化開關設備、鋰離子電池組和後門熱交換器,無需地板穿透即可支援100kW機架。同時, Delta Power Solutions正在將諮詢部門與附加元件微電網控制器相結合,以實現屋頂太陽能和燃料電池的利用。這些擴展的服務使Delta Power Solutions的服務線變得至關重要,隨著複雜性的不斷增加,其在Delta的模組化資料中心市場的佔有率可能會繼續穩步上升。
模組化資料中心市場報告按解決方案和服務(功能模組化解決方案(獨立功能模組和一體化功能模組)、服務)、應用程式(災難備份、高效能/邊緣運算、資料中心擴充、入門級資料中心)、建置類型(待開發區、棕地)和地區對產業進行分類。市場預測以貨幣單位(美元)提供。
區域分析
2024年,北美以43.44%的收益佔有率引領模組化資料中心市場,這得益於成熟的雲端生態系和雄厚的資本基礎。北維吉尼亞、達拉斯和鳳凰城的大型計劃佔據了新增容量的大部分,由於人工智慧租戶在專案竣工前就領先租下了整個階段,空置率降至歷史最低水平。該地區也受益於波特蘭和哥倫布等強勁的次市場,這些地區的電力成本相對較低,且政府獎勵有利於資本密集的待開發區計畫。以矽谷和奧斯汀為中心的創新叢集更具吸引力,這意味著供應商可以在當地開發液態解決方案的原型,從而縮短迭代週期。
亞太地區是成長最快的地區,到2030年複合年成長率將達到21.23%。中國東海岸正在主要高速公路沿線部署模組化邊緣節點,以支援自動駕駛卡車運輸走廊;而印度的二線城市則正在採用預製貨櫃結構,以避免電網擴建延遲。目前,深圳、班加羅爾和雅加達均已運作預製貨櫃組裝,從而降低了物流成本。對供應商而言,應對不同的管理體制仍然充滿挑戰,但其巨大的市場潛力足以彌補在地化帶來的阻力。
歐洲處於中等水平,但發展勢頭強勁。 GDPR合規要求企業將資料鎖定在其境內,這導致先前依賴跨境託管的較小國家出現了模組化資料中心。永續性也是一個重要議題:北歐業者正在強調使用海水或自由空氣冷卻的貨櫃式資料大廳,以獲得綠色融資。大陸集團的需求也與汽車電氣化息息相關,德國和法國的原始設備製造商在測試軌道附近的模組化單元中安裝用於自動駕駛模型的人工智慧訓練艙。如果安裝階段加速,歐洲模組化資料中心市場到2029年可能接近我們先前預測的645億美元。
中東和非洲是新興但利潤豐厚的市場。海灣國家政府正在推行富有遠見的數位經濟計劃,包括在沙漠邊緣建造兆瓦級的待開發區混合園區。由於環境溫度超過45°C,密封容器中的液體冷卻可減少灰塵侵入,並減少冷凍水機組的佔地面積。同時,非洲國家正利用模組化套件進行區域網路交換,一舉解決延遲和資料主權問題。願意提供建造-營運-轉移模式的供應商將在這些地區超越傳統實體設計的過程中獲得先發優勢。
其他福利:
- Excel 格式的市場預測 (ME) 表
- 3個月的分析師支持
目錄
第1章 引言
- 研究假設和市場定義
- 調查範圍
第2章調查方法
第3章執行摘要
第4章 市場狀況
- 市場概況
- 市場促進因素
- 快速部署邊緣運算
- 超大規模和雲端採用激增
- 行動性和可擴展性優勢
- 5G推動快速建置需求
- AI驅動的高密度液冷模組
- 數據主權微區建設
- 市場限制
- 初始投資高且供應商鎖定
- 電力效率與永續性之間的差距
- 大型設施的客製化有限
- 電網容量和許可瓶頸
- 價值/供應鏈分析
- 技術展望
- 監管格局
- 永續性和能源效率趨勢
- 波特五力模型
- 供應商的議價能力
- 買方的議價能力
- 新進入者的威脅
- 替代品的威脅
- 競爭對手之間的競爭
- 評估宏觀經濟趨勢對市場的影響
- 投資金籌措趨勢
第5章市場規模及成長預測
- 按解決方案和服務
- 功能模組解決方案
- 獨立模組
- 一體化模組
- 服務
- 諮詢與設計
- 整合與部署
- 管理和維護
- 功能模組解決方案
- 按用途
- 災害復原
- 邊緣/高效能運算
- 資料中心擴展
- 新創/小型企業資料中心
- 人工智慧/圖形處理單元訓練艙
- 加密挖礦和 HPC 容器
- 依體質
- 待開發區
- 棕地
- 按地區
- 北美洲
- 美國
- 加拿大
- 墨西哥
- 歐洲
- 英國
- 德國
- 法國
- 義大利
- 西班牙
- 荷蘭
- 其他歐洲地區
- 亞太地區
- 中國
- 日本
- 印度
- 韓國
- 新加坡
- 澳洲
- 馬來西亞
- 其他亞太地區
- 南美洲
- 巴西
- 阿根廷
- 南美洲其他地區
- 中東
- 阿拉伯聯合大公國
- 沙烏地阿拉伯
- 土耳其
- 以色列
- 其他中東地區
- 非洲
- 南非
- 奈及利亞
- 埃及
- 其他非洲國家
- 北美洲
第6章 競爭態勢
- 市場集中度
- 策略趨勢
- 市佔率分析
- 公司簡介
- IBM Corp.
- Huawei Technologies
- Dell Technologies
- Hewlett Packard Enterprise
- Vertiv
- Schneider Electric
- Rittal
- Cannon Technologies
- Baselayer Tech
- Instant Data Centers
- Colt DCS
- Bladeroom Group
- Eaton Corp.
- Delta Electronics
- EdgeConneX
- PCX Holding
- Cisco Systems
- ABB Ltd.
- ZTE Corp.
- Aspen Systems
- DATAPOD Australia
- Synergy Associates
第7章 市場機會與未來展望
The modular data center market size reached USD 36.04 billion in 2025 and is on track to touch USD 85.21 billion by 2030, translating into an 18.78% CAGR over the forecast period.
The steep growth curve mirrors the shift toward prefabricated, factory-integrated facilities that can be deployed in weeks rather than quarters. Demand is fuelled by AI-driven density requirements, the spread of edge locations close to users, and hyperscale cloud operators standardizing global buildouts. Liquid-cool designs, once niche, now underpin many new modules as partial PUE values below 1.05 become commercially viable. At the same time, service-centric revenue is accelerating because enterprises want turnkey integration rather than in-house assembly, while greenfield projects are gathering speed as organisations design for tomorrow's workloads instead of adapting yesterday's shells.
Global Modular Data Center Market Trends and Insights
Rapid Edge-Computing Rollout
Edge deployments are growing much faster than centralised facilities as video analytics, autonomous systems, and industrial IoT call for sub-10 millisecond latency. The modular data center market benefits because micro facilities can be dropped into retail rooftops, factory floors, or base-station shelters without lengthy site work. With edge data centers forecast to expand at 37.9% CAGR, operators in telecom and transportation increasingly select all-in-one prefabricated enclosures that ship with power, cooling, and racks pre-tested. Delta's SmartNode line shows how integrated battery strings and in-row chillers maintain uptime in harsh edge environments. Service providers also value the ability to duplicate designs across hundreds of remote points, streamlining spares and training needs. For vendors, the distributed footprint expands addressable unit volumes even if individual footprints are smaller than core sites.
Hyperscale and Cloud Adoption Surge
Hyperscale operators add floor area equivalent to several football fields every month, and the modular data center market is becoming a preferred way to meet that pace. Modular blocks allow consistent quality control across continents and collapse deployment timelines from 18 months to less than 9 months. Cloud brands benefit from standardised power and network topologies that make capacity fungible across regions, easing disaster-recovery planning. ARANER projects the hyperscale data-center sector will balloon to USD 935.3 billion by 2032, sustaining demand for rapid-build capacity. Integrated automation-ranging from robotic cabling to AI-based airflow tuning-now ships with many modules, supporting remote "lights-out" operations. Collectively, these factors reinforce a flywheel effect: shorter build cycles free capital sooner, enabling more frequent expansions.
High Upfront CAPEX and Vendor Lock-In
Factory-integrated power modules can cost USD 750,000-1 million per MW, a sizeable cheque for smaller enterprises. Financing complexities are compounded by proprietary interconnects that make it costly to mix brands later, raising fears of being tied to a single supplier. In emerging markets, limited access to low-cost capital accentuates the hurdle. While operating savings eventually offset the premium, CFOs often prioritise near-term cash flow over lifetime economics. Vendors that offer leasing, revenue-share, or "capacity as a service" arrangements can mitigate the perception of lock-in and help broaden adoption.
Other drivers and restraints analyzed in the detailed report include:
- AI-Driven High-Density Liquid-Cool Modules
- 5G-Triggered Quick-Build Demand
- Power-Efficiency and Sustainability Gaps
For complete list of drivers and restraints, kindly check the Table Of Contents.
Segment Analysis
Functional modules dominated the modular data center market in 2024, underpinned by their 62.12% share of revenue. Standardised steel-frame blocks equipped with integrated UPS, chillers, and racks have become a de-risked path for expansion: operators know exactly what arrives at the dock and how it will perform. That predictability lowers project management overhead and speeds up grid-tie approvals. Yet, the services segment is on a steeper 19.45% CAGR because clients increasingly outsource everything from site surveys to day-two optimisation. As power densities rise, issues such as fluid chemistry management or AI workload tuning require niche skills that most IT teams do not maintain in-house. Consequently, service providers bundle design, build, and long-term operations into outcome-based contracts, turning what was once CapEx into ongoing OpEx.
In many bids, functional modules now integrate application-specific accelerators, software-defined fabrics, and AI-based telemetry out of the box. EPG's latest generation incorporates modular switchgear, lithium-ion battery strings, and rear-door heat exchangers to support 100 kW racks without floor penetrations. Meanwhile, Delta Power Solutions couples its consulting arm with add-on microgrid controllers so that sites can tap rooftop solar or fuel cells. These extended offerings make the service line indispensable, and its share of the broader modular data center market will likely keep inching upward as complexity snowballs.
Modular Data Center Market Report Segments the Industry Into Solution and Services (Function Module Solution (Individual Function Module and All-In-One Function Module), Services), Application (Disaster Backup, High Performance/ Edge Computing, Data Center Expansion, Starter Data Centers), Build Type (Greenfield, Brownfield), and Geography. The Market Forecasts are Provided in Terms of Value (USD).
Geography Analysis
North America led the modular data center market in 2024 with a 43.44% revenue share thanks to a mature cloud ecosystem and capital depth. Large-scale projects in Northern Virginia, Dallas, and Phoenix accounted for a significant chunk of new capacity, and vacancy rates fell to record lows as AI tenants pre-leased entire phases even before construction completed. The region also benefits from robust secondary markets such as Portland and Columbus, where electricity costs remain comparatively low and state incentives sweeten capital-intensive greenfield deals. Cooling innovation clusters around Silicon Valley and Austin mean suppliers can prototype liquid solutions locally, shortening iteration cycles.
Asia-Pacific ranks as the fastest-growing theatre with a 21.23% CAGR through 2030, reflecting the surge in 5G rollouts, e-commerce penetration, and sovereign-cloud frameworks. China's eastern seaboard is layering modular edge nodes along major highways to support autonomous trucking corridors, while India's tier-2 cities adopt prefabricated shells to bypass grid-expansion delays. Government policies encouraging indigenous manufacturing amplify the move-prefab container assembly lines now operate in Shenzhen, Bangalore, and Jakarta, cutting logistics costs. For suppliers, navigating diverse regulatory regimes remains challenging, but volume potential outweighs localisation friction.
Europe sits mid-pack yet exhibits distinct drivers. GDPR compliance prompts enterprises to ring-fence data within national borders, so modular blocks pop up in smaller countries that previously relied on cross-border hosting. Sustainability imperatives loom large: Nordic operators highlight containerised data halls cooled with seawater or free air to secure green financing. Continental demand also ties to automotive electrification, with OEMs in Germany and France setting up AI training pods for autonomous-driving models inside modular units adjacent to proving grounds. As the fit-out phase accelerates, the modular data center market size for Europe could approach previously forecast USD 64.5 billion by 2029.
The Middle East and Africa represent nascent yet high-margin opportunities. Governments in the Gulf push vision-funded digital-economy plans that include megawatt-class greenfield campuses built on desert outskirts with solar hybrids. Because ambient temperatures exceed 45 °C, liquid cooling inside sealed containers mitigates dust ingress and reduces chill-water plant footprints. African nations, meanwhile, leverage modular kits for regional internet exchanges, addressing latency and data sovereignty in one stroke. Suppliers willing to offer build-operate-transfer models stand to gain early-mover advantage as these regions leapfrog traditional brick-and-mortar designs.
- IBM Corp.
- Huawei Technologies
- Dell Technologies
- Hewlett Packard Enterprise
- Vertiv
- Schneider Electric
- Rittal
- Cannon Technologies
- Baselayer Tech
- Instant Data Centers
- Colt DCS
- Bladeroom Group
- Eaton Corp.
- Delta Electronics
- EdgeConneX
- PCX Holding
- Cisco Systems
- ABB Ltd.
- ZTE Corp.
- Aspen Systems
- DATAPOD Australia
- Synergy Associates
Additional Benefits:
- The market estimate (ME) sheet in Excel format
- 3 months of analyst support
TABLE OF CONTENTS
1 INTRODUCTION
- 1.1 Study Assumptions and Market Definition
- 1.2 Scope of the Study
2 RESEARCH METHODOLOGY
3 EXECUTIVE SUMMARY
4 MARKET LANDSCAPE
- 4.1 Market Overview
- 4.2 Market Drivers
- 4.2.1 Rapid edge-computing rollout
- 4.2.2 Hyperscale and cloud adoption surge
- 4.2.3 Mobility and scalability advantages
- 4.2.4 5G-triggered quick-build demand
- 4.2.5 AI-driven high-density liquid-cool modules
- 4.2.6 Data-sovereignty micro-regional builds
- 4.3 Market Restraints
- 4.3.1 High upfront CAPEX and vendor lock-in
- 4.3.2 Power-efficiency and sustainability gaps
- 4.3.3 Limited customisation for mega-facilities
- 4.3.4 Grid-capacity and permitting bottlenecks
- 4.4 Value / Supply-Chain Analysis
- 4.5 Technological Outlook
- 4.6 Regulatory Landscape
- 4.7 Sustainability and Energy-Efficiency Trends
- 4.8 Porter's Five Forces
- 4.8.1 Bargaining Power of Suppliers
- 4.8.2 Bargaining Power of Buyers
- 4.8.3 Threat of New Entrants
- 4.8.4 Threat of Substitutes
- 4.8.5 Intensity of Competitive Rivalry
- 4.9 Assessment of the impact of Macro Economic Trends on the Market
- 4.10 Investment and Financing Trends
5 MARKET SIZE and GROWTH FORECASTS (VALUE)
- 5.1 By Solution and Services
- 5.1.1 Functional-Module Solution
- 5.1.1.1 Individual Module
- 5.1.1.2 All-in-One Module
- 5.1.2 Services
- 5.1.2.1 Consulting and Design
- 5.1.2.2 Integration and Deployment
- 5.1.2.3 Managed and Maintenance
- 5.1.1 Functional-Module Solution
- 5.2 By Application
- 5.2.1 Disaster Recovery
- 5.2.2 Edge / High-Performance Computing
- 5.2.3 Data Center Expansion
- 5.2.4 Starter / SMB Data Centers
- 5.2.5 Artificial Intelligence / Graphical Processing Units Training Pods
- 5.2.6 Crypto-Mining and HPC Containers
- 5.3 By Build Type
- 5.3.1 Greenfield
- 5.3.2 Brownfield
- 5.4 By Geography
- 5.4.1 North America
- 5.4.1.1 United States
- 5.4.1.2 Canada
- 5.4.1.3 Mexico
- 5.4.2 Europe
- 5.4.2.1 United Kingdom
- 5.4.2.2 Germany
- 5.4.2.3 France
- 5.4.2.4 Italy
- 5.4.2.5 Spain
- 5.4.2.6 Netherlands
- 5.4.2.7 Rest of Europe
- 5.4.3 Asia-Pacific
- 5.4.3.1 China
- 5.4.3.2 Japan
- 5.4.3.3 India
- 5.4.3.4 South Korea
- 5.4.3.5 Singapore
- 5.4.3.6 Australia
- 5.4.3.7 Malaysia
- 5.4.3.8 Rest of Asia-Pacific
- 5.4.4 South America
- 5.4.4.1 Brazil
- 5.4.4.2 Argentina
- 5.4.4.3 Rest of South America
- 5.4.5 Middle East
- 5.4.5.1 UAE
- 5.4.5.2 Saudi Arabia
- 5.4.5.3 Turkey
- 5.4.5.4 Israel
- 5.4.5.5 Rest of Middle East
- 5.4.6 Africa
- 5.4.6.1 South Africa
- 5.4.6.2 Nigeria
- 5.4.6.3 Egypt
- 5.4.6.4 Rest of Africa
- 5.4.1 North America
6 COMPETITIVE LANDSCAPE
- 6.1 Market Concentration
- 6.2 Strategic Moves
- 6.3 Market Share Analysis
- 6.4 Company Profiles (includes Global level Overview, Market level overview, Core Segments, Financials as available, Strategic Information, Market Rank/Share for key companies, Products and Services, and Recent Developments)
- 6.4.1 IBM Corp.
- 6.4.2 Huawei Technologies
- 6.4.3 Dell Technologies
- 6.4.4 Hewlett Packard Enterprise
- 6.4.5 Vertiv
- 6.4.6 Schneider Electric
- 6.4.7 Rittal
- 6.4.8 Cannon Technologies
- 6.4.9 Baselayer Tech
- 6.4.10 Instant Data Centers
- 6.4.11 Colt DCS
- 6.4.12 Bladeroom Group
- 6.4.13 Eaton Corp.
- 6.4.14 Delta Electronics
- 6.4.15 EdgeConneX
- 6.4.16 PCX Holding
- 6.4.17 Cisco Systems
- 6.4.18 ABB Ltd.
- 6.4.19 ZTE Corp.
- 6.4.20 Aspen Systems
- 6.4.21 DATAPOD Australia
- 6.4.22 Synergy Associates
7 MARKET OPPORTUNITIES and FUTURE OUTLOOK
- 7.1 White-space and Unmet-Need Assessment
 模組化資料中心市場:按組件、冷卻技術、資料中心等級、機架容量、應用、產業、部署類型和組織規模分類-2026-2032年全球市場預測
 2026年全球模組化資料中心市場報告
 全球模組化資料中心市場規模、佔有率、趨勢和成長分析報告(2026-2034年)
 模組化資料中心市場-全球產業規模、佔有率、趨勢、機會和預測:按組件、組織規模、產業垂直領域、市場區域和競爭格局分類,2021-2031年
 2026-2030年全球模組化資料中心市場
 日本模組化資料中心市場報告:按組件、資料中心規模、應用、產業和地區分類,2026-2034年
 模組化資料中心市場規模、佔有率和成長分析(按資料中心規模、產業垂直領域、UPS 類型和地區分類)-2026 年至 2033 年產業預測
 預製模組化資料中心:全球市場佔有率和排名、總收入和需求預測(2025-2031年)模組化資料中心市場規模、佔有率、趨勢及預測(按組件、資料中心規模、應用、產業垂直和地區),2025 年至 2033 年全球模組化資料中心市場規模按組件、組織規模、最終用戶、地區和預測分類: