


 |
市場調查報告書
商品編碼
1850003
工作空間即服務 (WaaS):市場佔有率分析、產業趨勢、統計數據和成長預測(2025-2030 年)Workspace As A Service (WaaS) - Market Share Analysis, Industry Trends & Statistics, Growth Forecasts (2025 - 2030) |
||||||
※ 本網頁內容可能與最新版本有所差異。詳細情況請與我們聯繫。
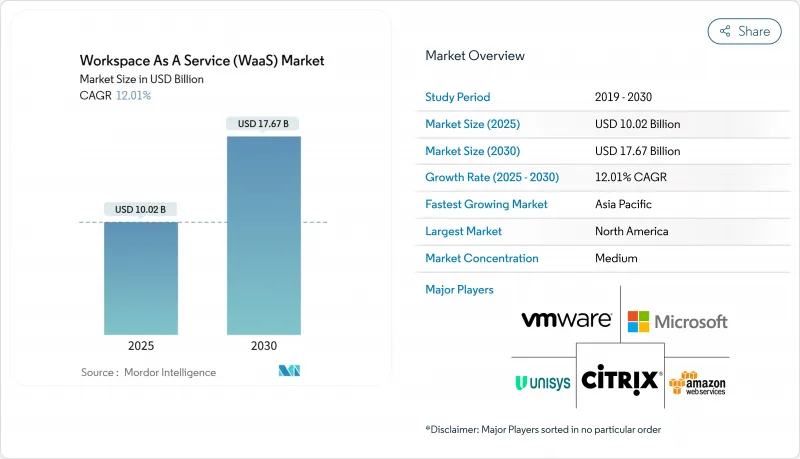
預計工作空間即服務 (WaaS) 市場規模將在 2025 年達到 100.2 億美元,並在 2030 年達到 176.7 億美元。
企業向雲端優先的數位化工作場所架構轉型,將安全性、合規性和生產力工具整合到單一虛擬體驗中,推動了成長。超大規模資料中心的資本支出超過 3,800 億美元,釋放了全球 GPU 容量,以支援 AI主導的虛擬桌面。零信任框架的快速採用、合規性審查的加強以及安全的混合工作需求,正在支撐受監管行業的需求。同時,市場集中度的降低,使得成熟和新興的雲端原生供應商能夠圍繞圖形設計、金融交易和即時協作等專業工作負載進行創新。
全球工作空間即服務 (WaaS) 市場趨勢與洞察
BYOD 的興起推動了對 WaaS 的需求
採用 BYOD(自帶設備)策略的公司越來越依賴集中式虛擬桌面來保護資料並確保統一的安全。 WaaS 內建的多因素身份驗證、細粒度的條件存取和會話隔離功能降低了非託管硬體帶來的風險。會計、法律和設計公司報告稱,由於虛擬應用程式可以即時交付到個人筆記型電腦和平板電腦上,季節性員工的入職速度更快。資訊長也表示,由於設備無關的交付方式將智慧財產權保留在資料中心而非終端,IT 資產的可視性也得到了提升。這種勢頭使 BYOD 成為成熟市場和新興市場的中期驅動力。
雲端 VDI 的成本和可擴展性優勢
雲端託管虛擬桌面透過消除批量硬體更新並將支出轉向基於消費的模式,降低了整體擁有成本。 Amazon WorkSpaces 瘦客戶端裝置起價為 195 美元,可從雲端傳輸加密像素。 Microsoft Azure 虛擬桌面新增多會話 Windows 11 以達到最大密度,其全球資料中心覆蓋範圍可在合併或計劃高峰期即時擴充。這些效率優勢在亞太地區的中小企業中尤為突出,這些企業先前缺乏部署企業級基礎設施的資金。
持續的網路延遲和頻寬差距
虛擬桌面對往返延遲高度敏感。 Citrix 基準測試表明,超過 150 毫秒,使用者體驗會急劇下降,超過 300 毫秒則無法接受。許多農村和新興市場仍然依賴不穩定的寬頻,輸入延遲、音訊遺失和影像模糊等問題阻礙了其普及。超大規模資料中心營運商正在透過鄰近邊緣區域和自適應 UDP 傳輸來緩解限制,但最後一英里的基礎設施仍然參差不齊。政府主導的光纖部署和 5G 固定無線試驗至關重要,尤其對於涉及高清視訊和 CAD 工作負載的部署。
細分分析
2024年,桌面即服務佔據了工作空間即服務市場56.7%的佔有率,這反映出對支援傳統商用軟體的完整作業系統鏡像的強勁需求。企業青睞這種模式,因為與單一筆記型電腦相比,它透過集中式修補程式、黃金鏡像管理和即時回滾功能簡化了合規性。 DaaS的採用還可以順利擴展到按小時收費的承包商和季節性員工。該細分市場的領先地位推動了平台供應商將身分、可觀察性和端點分析等互補功能整合到統一的主機中。
整合協作套件是成長最快的類別,到2030年的複合年成長率將達到13.1%。融合了聊天、通話、文件協作和工作流程自動化的套件可以減少工具的氾濫,並促進許可證整合。 Microsoft Teams在現有的Office 365合約中佔據主導地位,而Google Workspace在教育機構和新興企業中佔據主導地位。供應商現在正在整合會議記錄AI、白板和低程式碼流程建構器,將其套件定位為更廣泛數位體驗平台的墊片。隨著企業走向緊密的生態系統,這種趨勢將逐漸削弱獨立的會議和儲存解決方案。
到 2024 年,本地部署將佔工作空間即服務市場規模的 67.5%。這些設施通常將 VDI 軟體與在私有資料中心運作的超融合叢集相結合,但嚴格的容量規劃、硬體更新週期和單獨的災害復原站點使資本成本居高不下。
到2030年,雲端運算的採用將達到最高的複合年成長率,達到13.8%。供應商提供企業級GPU、自動化彈性和全球冗餘,且無需任何前期成本。微軟基於Azure Stack HCI的Azure虛擬桌面透過在本地端託管虛擬會話主機並從雲端控制它們,連接了兩個世界。歐洲公司正在尋求符合GDPR和Schrems II資料傳輸法規的主權雲端區域。最終,即使對於受到嚴格監管的公司,公共雲端營運模式也將主導新的待開發區部署和工作負載擴展。
區域分析
到2024年,北美將以35.6%的市場佔有率繼續保持其在工作空間即服務市場的領先地位,這得益於成熟的雲端基礎設施、高寬頻普及率以及科技、金融和媒體行業的早期應用。遠端工作資料管理的監管明確加速了相關技術的推廣,而多個大都會圈的超大規模資料中心的密集部署使延遲保持在最佳閾值範圍內。私人部門持續投資於人工智慧最佳化的資料中心,例如亞馬遜斥資100億美元在北卡羅來納州建造的園區,這將繼續增強該地區的供應基礎。
預計到2030年,亞太地區的複合年成長率將達到12.7%,位居榜首。印度、印尼和越南政府已累計補貼和頻譜獎勵,以擴大光纖和5G覆蓋範圍,使中小企業和公共機構能夠從本地IT遷移到雲端桌面。亞馬遜斥資200億澳元用於澳洲資料中心建設,並新建太陽能發電廠,凸顯了該地區在綠色基礎設施方面的雄心。日本和韓國的國內雲端服務供應商也宣布了支援語言模型開發和3D設計的GPU集群,這刺激了鄰近地區對高效能工作站的需求。
歐洲繼續成為以主權雲端框架為中心的成長中心。由於《歐洲數據法案》和行業法規強制工作負載必須限制在區域範圍內,法國、德國和北歐國家正在採用值得信賴的雲端合作夥伴網路。 VMware 的主權雲端參考架構提供了標準化的合規性模板,可快速認證虛擬桌面。隨著硬體更新周期的推進,許多企業正在縮減其本地機架規模,並加入授權的公共雲端區域。中東和非洲正在經歷與經濟多元化計畫相關的新部署,而隨著光纖主幹網路和邊緣節點縮小歷史性的頻寬缺口,拉丁美洲正呈現穩定成長動能。
其他福利:
- Excel 格式的市場預測 (ME) 表
- 3個月的分析師支持
目錄
第1章 引言
- 研究假設和市場定義
- 調查範圍
第2章調查方法
第3章執行摘要
第4章 市場狀況
- 市場概況
- 市場促進因素
- BYOD 的興起推動了對 WaaS 的需求
- 雲端 VDI 的成本和可擴展性優勢
- 混合工作安全要求
- 超大規模資料中心業者擴展 DaaS 產品組合
- 嵌入數位化工作場所的 ESG 儀表板
- GPU加速虛擬工作站(AI/圖形)
- 市場限制
- 持續的網路延遲和頻寬差距
- 整合遺留應用程式的複雜性
- 雲端運算出口費用上漲對TCO帶來壓力
- 資料主權規則強製本地 VDI 覆蓋
- 價值鏈分析
- 監管格局
- 技術展望
- 波特五力分析
- 供應商的議價能力
- 買方的議價能力
- 新進入者的威脅
- 替代品的威脅
- 競爭對手之間的競爭
- 評估宏觀經濟趨勢對市場的影響
第5章市場規模及成長預測
- 按解決方案
- 桌面即服務 (DaaS)
- 應用程式即服務 (AaaS)
- 託管安全與合規性 - aaS
- 整合協作套件
- 按部署模型
- 本地部署
- 雲
- 按組織規模
- 主要企業
- 小型企業
- 按最終用戶
- BFSI
- 教育
- 零售與電子商務
- 政府和公共部門
- 資訊科技和通訊
- 其他最終用戶領域
- 按地區
- 北美洲
- 美國
- 加拿大
- 墨西哥
- 歐洲
- 德國
- 英國
- 法國
- 義大利
- 西班牙
- 其他歐洲地區
- 亞太地區
- 中國
- 日本
- 印度
- 韓國
- 澳洲
- 其他亞太地區
- 南美洲
- 巴西
- 阿根廷
- 南美洲其他地區
- 中東和非洲
- 中東
- 沙烏地阿拉伯
- 阿拉伯聯合大公國
- 土耳其
- 其他中東地區
- 非洲
- 南非
- 埃及
- 奈及利亞
- 其他非洲國家
- 北美洲
第6章 競爭態勢
- 市場集中度
- 策略趨勢
- 市佔率分析
- 公司簡介
- Amazon Web Services Inc.
- VMware Inc.
- Citrix Systems Inc.
- Microsoft Corporation
- Google LLC
- IBM Corporation
- Cisco Systems Inc.
- Accenture plc
- DXC Technology Co.
- Hewlett Packard Enterprise
- Nutanix Inc.
- Workspot Inc.
- Cloudalize NV
- Dizzion Inc.
- Getronics NV
- Unisys Corporation
- NTT DATA Corporation
- Colt Technology Services
- Oracle Corporation
- Huawei Technologies Co. Ltd.
第7章 市場機會與未來展望
The Workspace As A Service (WaaS) Market size reached USD 10.02 billion in 2025 and is projected to climb to USD 17.67 billion by 2030, reflecting a steady 12% CAGR over the forecast period.
Growth is underpinned by enterprises shifting to cloud-first digital workplace architectures that converge security, compliance, and productivity tools into a single virtual experience. Hyperscaler capital spending exceeding USD 380 billion has unlocked global GPU capacity that supports AI-driven virtual desktops, while pay-as-you-go pricing keeps barriers low for small teams in every sector. Rapid adoption of zero-trust frameworks, rising compliance scrutiny, and secure hybrid-work requirements sustain demand across regulated verticals. Meanwhile, moderate market concentration encourages both incumbents and emerging cloud-native vendors to innovate around specialized workloads such as graphics design, financial trading, and real-time collaboration.
Global Workspace As A Service (WaaS) Market Trends and Insights
BYOD Proliferation Boosts WaaS Demand
Organizations adopting Bring Your Own Device policies increasingly rely on centralized virtual desktops to protect data and enforce uniform security. Multi-factor authentication, granular conditional access, and session isolation embedded in WaaS reduce risks tied to unmanaged hardware. Accounting, legal, and design firms report faster onboarding of seasonal staff because virtual apps are delivered instantly to personal laptops and tablets. CIOs also cite improved IT asset visibility, since device-agnostic delivery keeps intellectual property inside the datacenter rather than on endpoints. This momentum positions BYOD as a mid-term driver across mature and emerging markets.
Cloud-VDI Cost and Scalability Advantages
Cloud-hosted virtual desktops lower total cost of ownership by removing bulk hardware refreshes and shifting expenditure to consumption-based models. Amazon WorkSpaces Thin Client devices start at USD 195 and stream encrypted pixels from the cloud, illustrating how central management reduces desk-side support. Microsoft Azure Virtual Desktop adds multi-session Windows 11 to maximize density, while global datacenter footprints enable instant scaling during mergers or peak project phases. These efficiencies resonate most strongly with Asia-Pacific SMEs that previously lacked capital for enterprise-grade infrastructure.
Persistent Network Latency and Bandwidth Gaps
Virtual desktops are highly sensitive to round-trip delay. Citrix benchmark testing shows user experience falls sharply once latency breaches 150 milliseconds and becomes unacceptable beyond 300 milliseconds. Many rural districts and emerging economies still rely on inconsistent broadband, leading to input lag, audio dropouts, and blurred graphics that discourage adoption. Hyperscalers mitigate constraints through nearby edge zones and adaptive UDP transport, yet last-mile infrastructure remains uneven. Government-sponsored fiber rollouts and 5G fixed-wireless pilots will be pivotal, especially for deployments involving high-definition video or CAD workloads.
Other drivers and restraints analyzed in the detailed report include:
- Hybrid-Work Security Requirements
- Hyperscaler DaaS Portfolio Expansion
- Legacy-App Integration Complexity
For complete list of drivers and restraints, kindly check the Table Of Contents.
Segment Analysis
Desktop as a Service secured 56.7% share of the Workspace as a Service market in 2024, reflecting persistent demand for full operating-system images that support legacy line-of-business software. Enterprises favor the model because centralized patching, golden-image management, and instant rollback simplify compliance compared with individual laptops. DaaS adoption also scales smoothly for contractors and seasonal staff thanks to hourly billing. The segment's leadership has prompted platform vendors to merge complementary functions such as identity, observability, and endpoint analytics into unified consoles.
Integrated Collaboration Suites represent the fastest-rising category at 13.1% CAGR through 2030. Bundles combining chat, calling, document co-authoring, and workflow automation reduce tool sprawl and encourage license consolidation. Microsoft Teams inside existing Office 365 agreements and Google Workspace in education and startup cohorts dominate volumes. Vendors now embed meeting-transcription AI, whiteboarding, and low-code process builders, positioning suites as a launchpad for broader digital experience platforms. This trajectory will gradually dilute standalone conferencing or storage solutions as firms gravitate toward cohesive ecosystems.
On-premise deployments controlled 67.5% of the Workspace as a Service market size in 2024 as enterprises leveraged sunk investments and asserted data sovereignty. Such estates often pair VDI software with hyperconverged clusters running in private datacenters. However, stringent capacity planning, hardware refresh cycles, and separate disaster-recovery sites keep capital costs high.
Cloud deployment is set to register the strongest 13.8% CAGR to 2030. Providers deliver enterprise-grade GPUs, automated elasticity, and global redundancy without upfront spend. Microsoft's Azure Virtual Desktop on Azure Stack HCI bridges both worlds by hosting virtual session hosts on-premise while controlling them from the cloud. European organizations gravitate toward sovereign cloud regions that address GDPR and Schrems II data transfer rulings. Over time, the public-cloud operating model will dominate new greenfield deployments and workload expansion even among highly regulated entities.
The Workspace As A Service (WaaS) Market Report is Segmented by Solution (Desktop As A Service (DaaS), Application As A Service (AaaS), and More), Deployment Model (On-Premise and Cloud), Organization Size (Large Enterprises and Small and Medium Enterprises (SMEs)), End-User Vertical (BFSI, Education, Retail and E-Commerce, and More) and Geography. The Market Forecasts are Provided in Terms of Value (USD).
Geography Analysis
North America retained leadership with 35.6% share of the Workspace as a Service market in 2024, supported by mature cloud infrastructure, high broadband penetration, and early adoption across technology, finance, and media. Regulatory clarity around remote work data controls accelerated rollouts, while hyperscaler density in multiple metropolitan zones kept latency within optimal thresholds. Ongoing private-sector investments in AI-optimized datacenters, including Amazon's USD 10 billion North Carolina campus, continue to reinforce the regional supply base.
Asia-Pacific is projected to record the fastest 12.7% CAGR to 2030. Governments in India, Indonesia, and Vietnam earmark grants and spectrum incentives to extend fiber and 5G coverage, enabling SMEs and public agencies to leapfrog on-premise IT in favor of cloud desktops. Amazon's AU$20 billion allocation for Australian datacenters paired with new solar farms underscores regional appetite for green infrastructure. Domestic cloud providers in Japan and South Korea are also launching GPU-rich clusters to support language-model development and 3D design, fueling demand for high-performance workstations served from nearby zones.
Europe remains a growth pivot anchored on sovereign cloud frameworks. The European Data Act and sector-specific mandates force workloads to stay inside regional boundaries, prompting France, Germany, and the Nordics to adopt trusted cloud partner networks. VMware's sovereign-cloud reference architecture offers standardized compliance templates that expedite virtual desktop certification. As firms renew hardware cycles, many downsize on-premise racks and subscribe to sanctioned public-cloud regions, blending performance with legal assurance. The Middle East and Africa register nascent uptake tied to economic diversification programs, while Latin America sees steady momentum where fiber backbones and edge nodes close historic bandwidth gaps.
- Amazon Web Services Inc.
- VMware Inc.
- Citrix Systems Inc.
- Microsoft Corporation
- Google LLC
- IBM Corporation
- Cisco Systems Inc.
- Accenture plc
- DXC Technology Co.
- Hewlett Packard Enterprise
- Nutanix Inc.
- Workspot Inc.
- Cloudalize NV
- Dizzion Inc.
- Getronics NV
- Unisys Corporation
- NTT DATA Corporation
- Colt Technology Services
- Oracle Corporation
- Huawei Technologies Co. Ltd.
Additional Benefits:
- The market estimate (ME) sheet in Excel format
- 3 months of analyst support
TABLE OF CONTENTS
1 INTRODUCTION
- 1.1 Study Assumptions and Market Definition
- 1.2 Scope of the Study
2 RESEARCH METHODOLOGY
3 EXECUTIVE SUMMARY
4 MARKET LANDSCAPE
- 4.1 Market Overview
- 4.2 Market Drivers
- 4.2.1 BYOD proliferation boosts WaaS demand
- 4.2.2 Cloud-VDI cost and scalability advantages
- 4.2.3 Hybrid-work security requirements
- 4.2.4 Hyperscaler DaaS portfolio expansion
- 4.2.5 ESG dashboards embedded in digital workplace
- 4.2.6 GPU-accelerated virtual workstations (AI/graphics)
- 4.3 Market Restraints
- 4.3.1 Persistent network latency and bandwidth gaps
- 4.3.2 Legacy-app integration complexity
- 4.3.3 Rising cloud egress fees erode TCO
- 4.3.4 Data-sovereignty rules force local VDI footprint
- 4.4 Value Chain Analysis
- 4.5 Regulatory Landscape
- 4.6 Technological Outlook
- 4.7 Porter's Five Forces Analysis
- 4.7.1 Bargaining Power of Suppliers
- 4.7.2 Bargaining Power of Buyers
- 4.7.3 Threat of New Entrants
- 4.7.4 Threat of Substitutes
- 4.7.5 Intensity of Competitive Rivalry
- 4.8 Assessment of the Impact of Macroeconomic Trends on the Market
5 MARKET SIZE AND GROWTH FORECASTS (VALUE)
- 5.1 By Solution
- 5.1.1 Desktop as a Service (DaaS)
- 5.1.2 Application as a Service (AaaS)
- 5.1.3 Managed Security and Compliance-aaS
- 5.1.4 Integrated Collaboration Suites
- 5.2 By Deployment Model
- 5.2.1 On-Premise
- 5.2.2 Cloud
- 5.3 By Organization Size
- 5.3.1 Large Enterprises
- 5.3.2 Small and Medium Enterprises (SMEs)
- 5.4 By End-user Vertical
- 5.4.1 BFSI
- 5.4.2 Education
- 5.4.3 Retail and e-Commerce
- 5.4.4 Government and Public Sector
- 5.4.5 IT and Telecom
- 5.4.6 Other End-user Verticals
- 5.5 By Geography
- 5.5.1 North America
- 5.5.1.1 United States
- 5.5.1.2 Canada
- 5.5.1.3 Mexico
- 5.5.2 Europe
- 5.5.2.1 Germany
- 5.5.2.2 United Kingdom
- 5.5.2.3 France
- 5.5.2.4 Italy
- 5.5.2.5 Spain
- 5.5.2.6 Rest of Europe
- 5.5.3 Asia-Pacific
- 5.5.3.1 China
- 5.5.3.2 Japan
- 5.5.3.3 India
- 5.5.3.4 South Korea
- 5.5.3.5 Australia
- 5.5.3.6 Rest of Asia-Pacific
- 5.5.4 South America
- 5.5.4.1 Brazil
- 5.5.4.2 Argentina
- 5.5.4.3 Rest of South America
- 5.5.5 Middle East and Africa
- 5.5.5.1 Middle East
- 5.5.5.1.1 Saudi Arabia
- 5.5.5.1.2 United Arab Emirates
- 5.5.5.1.3 Turkey
- 5.5.5.1.4 Rest of Middle East
- 5.5.5.2 Africa
- 5.5.5.2.1 South Africa
- 5.5.5.2.2 Egypt
- 5.5.5.2.3 Nigeria
- 5.5.5.2.4 Rest of Africa
- 5.5.1 North America
6 COMPETITIVE LANDSCAPE
- 6.1 Market Concentration
- 6.2 Strategic Moves
- 6.3 Market Share Analysis
- 6.4 Company Profiles (includes Global level Overview, Market level overview, Core Segments, Financials as available, Strategic Information, Market Rank/Share, Products and Services, Recent Developments)
- 6.4.1 Amazon Web Services Inc.
- 6.4.2 VMware Inc.
- 6.4.3 Citrix Systems Inc.
- 6.4.4 Microsoft Corporation
- 6.4.5 Google LLC
- 6.4.6 IBM Corporation
- 6.4.7 Cisco Systems Inc.
- 6.4.8 Accenture plc
- 6.4.9 DXC Technology Co.
- 6.4.10 Hewlett Packard Enterprise
- 6.4.11 Nutanix Inc.
- 6.4.12 Workspot Inc.
- 6.4.13 Cloudalize NV
- 6.4.14 Dizzion Inc.
- 6.4.15 Getronics NV
- 6.4.16 Unisys Corporation
- 6.4.17 NTT DATA Corporation
- 6.4.18 Colt Technology Services
- 6.4.19 Oracle Corporation
- 6.4.20 Huawei Technologies Co. Ltd.
7 MARKET OPPORTUNITIES AND FUTURE OUTLOOK
- 7.1 White-space and Unmet-Need Assessment


