


 |
市場調查報告書
商品編碼
1849934
自助服務:市場佔有率分析、產業趨勢、統計數據和成長預測(2025-2030 年)Self-Service - Market Share Analysis, Industry Trends & Statistics, Growth Forecasts (2025 - 2030) |
||||||
※ 本網頁內容可能與最新版本有所差異。詳細情況請與我們聯繫。
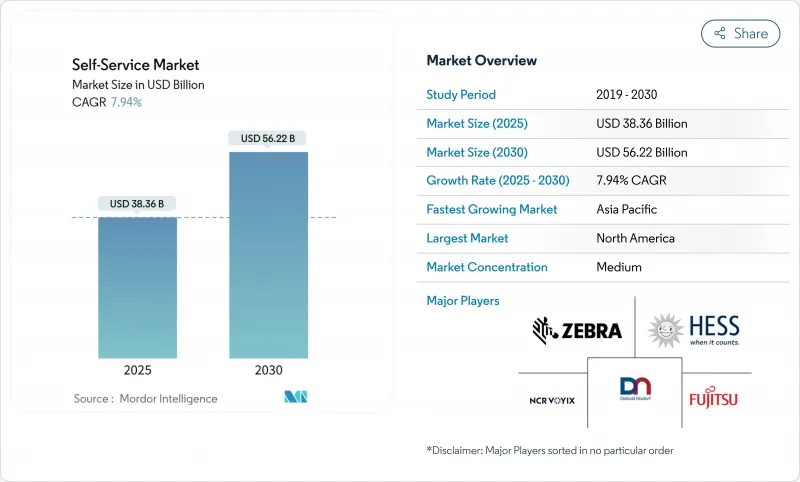
預計到 2025 年自助服務市場規模將成長至 383.6 億美元,到 2030 年將成長至 562.2 億美元,在此期間的複合年成長率為 7.9%。
這種成長與疫情後非接觸式支付的加速轉變、企業對數位化的要求不斷提高以及公眾對數位錢包的廣泛喜愛直接相關。硬體和軟體供應商正在透過整合人工智慧、電腦視覺和生物識別模組來應對這一趨勢,這些模組可以減少等待時間、增強安全性並在銀行、零售、醫療保健、公共場所等領域開闢新的用例。基於2D碼和 NFC 構建的支付生態系統現已成為許多城市中心的主流,支持了對可接受用戶喜歡的任何憑證的自助終端的穩定需求。供應商也正在強調服務合約和平台費用,將曾經的一次性硬體銷售轉變為平滑現金流的經常性收益來源。然而,抵禦破壞、極端戶外天氣和電子商務替代品仍然是獲利部署的先決條件。
全球自助服務市場趨勢與洞察
新冠疫情後非接觸式交易的興起
到2022年,全球數位支付參與率將從2014年的44%飆升至三分之二的成年人,證實了無現金支付行為的永久轉變。歐洲的調查顯示,出於衛生方面的考慮,人們持續傾向於避免使用現金,小型市場營運商報告稱,安裝無現金模組後收益增加。像瑞典這樣的國家,過去十年現金使用量減少了一半,凸顯了政策、商家和消費者正迅速轉向數位化。這種偏好也延伸到了生物識別辨識和語音提示,推動了自助服務市場非接觸式身分驗證的普及。
智慧零售業態快速發展
預計依賴RFID門、電腦視覺和智慧貨架的無人商店將大幅成長。德國自助結帳商店數量近期已突破5,000家,零售商計畫進一步加速發展。在美國,山姆會員商店等批發連鎖店正在部署人工智慧增強型設備,可在幾秒鐘內掃描購物車,從而減少排隊並重新部署員工。微型倉配中心雖然整合存在問題,但承諾在人口密集地區實現當日補貨,從而吸引人們購買儲物櫃和混合自助服務終端,這些設備可以全天候提供取貨和送貨服務。
處理現金時持續存在的破壞行為和安全風險
根據英國電信的數據,在重型鎖和警報器遏制此類事件之前,每年都有數萬起針對付費電話的攻擊事件發生。預計到2032年,複雜的累積獎金和盜刷詐騙將推動實體和網路安全市場規模達到324億美元。營運商正在添加指紋認證、臉部認證和多因素提示以打擊詐騙,但每個新模組都會增加成本並延長認證週期。聯合警務巡邏和人工智慧監控可以減少損失,但無法完全消除損失。
細分分析
到 2024 年,自助服務終端將佔據自助服務市場佔有率的 36.2%,這突顯了它們在辦理登機、票務和支付帳單方面的靈活性。自助服務終端相關的自助服務市場規模受益於持續的軟體更新,增加了語言包、人工智慧頭像和支付選項。隨著雜貨店和百貨公司控制人事費用並縮短結帳排隊時間,自助結帳正以 8.3% 的複合年成長率成長。雖然 ATM 仍然是現金生態系統的支柱,但由於行動支付滿足了許多低價值支付需求,年度安裝量已趨於平穩。自動販賣機正在將其社交足跡從零嘴零食擴展到成藥、個人防護裝備和時間緊迫的疫苗。在降低最後一哩成本的壓力下,智慧儲物櫃正在記錄來自物流公司的有效訂單,以便在非工作時間提取小包裹。醫療保健自助服務終端的市場規模預計將從2024年的8億美元成長到2028年的18.1億美元,這表明診斷、遠端醫療和處方箋續訂功能將在一個緊湊的空間內融合。零售商正在積極擁抱電腦視覺技術,利用攝影機自動稱重商品,以最大限度地減少錯誤和消費者的不滿。產品組合將持續惠及那些兼具耐用性和雲端功能、能夠提供即時洞察和遠端服務的供應商。
自助服務終端供應商正在投資抗菌處理、觸覺回饋、輪椅無障礙佈局等技術,以領先無障礙法規。自助結帳機製造商正在與金融科技閘道合作,在遵守支付安全標準的同時,提供「先買後付」服務。 ATM供應商正在轉向視訊櫃員和加密貨幣模組,以保持市場競爭力。自動販賣機專家正在測試動態冷凍和人工智慧貨架圖,透過優先展示快速週轉的庫存來提高每平方英吋的銷售額。儲物櫃供應商正在為食品雜貨和藥品部門增加溫控功能。因此,投資組合的廣度仍然是自助服務市場中應對消費者流量和商家經濟變化的一種對沖手段。
雖然硬體將佔2024年收益的54.0%,但軟體每年成長9.0%,使其成為終身收益的關鍵。供應商正在部署容器化作業系統,無需現場存取即可進行安全更新,從而加快新功能的上市時間。雲端儀表板突出顯示使用量峰值,使零售商僅在流量需要時才預先加載人員。 Diebold Nixdorf的DN Vynamic套件連接了超過230,000個端點,並推送預測性維護警報,以減少非計劃性停機時間。人工智慧引擎位於邊緣,可在幾毫秒內標記可疑的提款模式並支援即時鎖定。與忠誠度平台的整合還可以實現螢幕提升銷售。
服務完善了組件功能,包括安裝、移除、軟體修補和合規性審核。隨著固定期限合約的成長,服務利潤率可能會超過硬體運輸利潤率。無障礙顧問確保符合《聯邦公報》中規定的觸覺、聽覺和視覺標準。將 ERP 和 POS 資料與自助服務終端遠端檢測結合的公司能夠實現閉合迴路分析,顯示按 SKU、班次和位置分類的銷售提升情況。對於在自助服務市場中資本支出週期較短且在全球範圍內部署自助服務終端的大型連鎖企業而言,這種視覺性對於採購決策至關重要。
自助服務市場報告按產品類型(自助服務終端、ATM、其他)、組件(硬體、軟體、服務)、最終用戶行業(BFSI、零售、快餐店、其他)、技術(生物識別、NFC/非接觸式、人工智慧、電腦視覺、其他)、部署位置(室內、室外)和地區進行細分。
區域分析
2024年,北美將佔總收入的39.4%,這反映了自動提款機技術的長期採用、零售店的廣泛存在以及對保護條例的支持。支付卡的使用率幾乎達到普遍水平,數位錢包佔據主導地位,這促使商家優先考慮接受晶片、感應卡和行動憑證的終端。聯邦機構將利用獎勵策略資金資助寬頻和數位政府入口網站,並在公共服務亭打造一致的用戶體驗。企業對人工智慧、雲端運算和網路安全的需求隨著每個預算週期而成長,推動了在現有硬體基礎上進行以軟體為中心的升級的需求。
歐洲在永續性和包容性之間取得平衡。歐盟委員會正在推廣生態設計和透明的供應鏈,鼓勵製造商延長設備使用壽命並揭露其碳足跡。無障礙法規要求使用觸覺小鍵盤、語音提示和可調字體大小,這些都會影響材料清單清單和韌體設計。德國的EHI舉措透過統計數千條自助結帳通道展示了商業性雄心,同時該地區正在討論能夠與自助服務終端和ATM無縫連接的數位歐元的最佳格式。營運商正在實施遠端遙測,以減少服務車行駛里程並實現氣候變遷目標。
受惠於數位化措施和智慧型手機QR CODE支付的爆炸性成長,亞太地區的複合年成長率達到 8.5%。印度每月透過 UPI 匯款金額達數十億,在農村自助服務終端,2D碼支付也越來越普遍。中國正在試行一種央行數位貨幣,該貨幣可能會融入交通和自動販賣機網路,這要求業者快速更新韌體。東協各國政府正在資助郵局內部的電子政府遊說活動,以確保偏遠地區的公民獲得平等的服務,同時減少繁文縟節。南美和中東地區落後,但隨著通訊業者大力推廣行動貨幣以及旅遊業重新激發人們對多語種票務的興趣,該地區的發展正在加速。
其他福利:
- Excel 格式的市場預測 (ME) 表
- 3個月的分析師支持
目錄
第1章 引言
- 研究假設和市場定義
- 調查範圍
第2章調查方法
第3章執行摘要
第4章 市場狀況
- 市場概況
- 市場促進因素
- 新冠疫情後非接觸式交易的興起
- 智慧零售業態快速發展
- 全通路銀行自動化浪潮
- 政府推動低現金社會
- 人工智慧驅動的自適應使用者介面
- 微型倉配和全天候無人駕駛營運概念
- 市場限制
- 持續存在的破壞行為與現金處理安全風險
- 在惡劣氣候條件下進行戶外部署時,整體擁有成本更高
- 無障礙標準的協調有限
- 不涉及自動販賣機的電子商務的興起
- 價值鏈分析
- 技術展望
- 波特五力分析
- 供應商的議價能力
- 買方的議價能力
- 新進入者的威脅
- 替代品的威脅
- 競爭對手之間的競爭
- 主要技術發展
- 自助服務亭的演變
- 無障礙自助服務終端標準與工作小組
- 關鍵案例研究和使用者研究
第5章市場規模及成長預測
- 依產品類型
- 亭
- ATM
- 自動販賣機
- 自助結帳系統系統
- 智慧儲物櫃/包裹站
- 按組件
- 硬體
- 軟體
- 服務
- 按最終用戶產業
- BFSI
- 零售店和速食店
- 飯店業
- 衛生保健
- 交通和旅遊樞紐
- 政府和公共部門
- 依技術
- 支援生物識別
- NFC/非接觸式
- 人工智慧驅動和電腦視覺
- 雲端連線
- 按位置
- 室內的
- 戶外
- 按地區
- 北美洲
- 美國
- 加拿大
- 墨西哥
- 歐洲
- 德國
- 英國
- 法國
- 義大利
- 西班牙
- 俄羅斯
- 其他歐洲地區
- 亞太地區
- 中國
- 日本
- 印度
- 韓國
- ASEAN
- 澳洲和紐西蘭
- 其他亞太地區
- 南美洲
- 巴西
- 阿根廷
- 南美洲其他地區
- 中東和非洲
- 中東
- 沙烏地阿拉伯
- 阿拉伯聯合大公國
- 土耳其
- 其他中東地區
- 非洲
- 南非
- 奈及利亞
- 其他非洲國家
- 北美洲
第6章 競爭態勢
- 市場集中度
- 策略趨勢
- 市佔率分析
- 公司簡介
- NCR Corporation
- Diebold Nixdorf
- Crane Payment Innovations
- Fujitsu Ltd.
- Glory Global Solutions
- Zebra Technologies
- Advantech Co. Ltd.
- Frank Mayer and Associates Inc.
- HESS Cash Systems GmbH
- Azkoyen Group
- Embross
- SEDCO
- IER Group
- Maas International BV
- RedyRef Interactive
- Olea Kiosks Inc.
- Posiflex Technology Inc.
- SlabbKiosks
- KIOSK Information Systems
第7章 市場機會與未來展望
The self-service market size stood at USD 38.36 billion in 2025 and is forecast to advance to USD 56.22 billion by 2030, reflecting a 7.9% CAGR over the period.
This growth links directly to the shift toward contactless engagement that gathered pace after the pandemic, tighter corporate mandates for digitization, and broad public familiarity with digital wallets. Hardware and software suppliers are responding by embedding AI, computer vision, and biometric modules that cut wait times, strengthen security, and open new use-cases across banking, retail, healthcare, and public venues. Payment ecosystems built on QR and NFC are now mainstream in many urban centers, and they underpin steady demand for self-service terminals able to accept any credential the user prefers. Vendors also highlight service contracts and platform fees, turning what was once a one-off hardware sale into a recurring revenue stream that smooths cash flow. However, resilience against vandalism, outdoor weather extremes, and e-commerce substitution remains a prerequisite for profitable roll-outs.
Global Self-Service Market Trends and Insights
Ubiquity of Contact-Free Transactions Post-COVID
Global digital payment participation jumped from 44% in 2014 to two-thirds of adults in 2022, confirming a permanent tilt toward cashless behaviors. European research shows sustained intentions to avoid cash because of hygiene concerns, and operators of micro-markets report higher revenues after installing cashless modules. Countries like Sweden, where cash use halved in the past decade, underscore how rapidly policy, merchants, and consumers converge on digital rails. This preference extends to biometric taps and voice prompts, driving every corner of the self-service market to support no-touch authentication.
Rapid Rollout of Smart Retail Formats
Autonomous stores relying on RFID gates, computer vision, and smart shelving are projected to grow significantly. Germany counted more than 5,000 self-checkout outlets recently, and retailers plan further acceleration. In the United States, wholesale chains such as Sam's Club deployed AI-enhanced devices that scan carts in seconds, shrinking queues and redeploying staff. Micro-fulfilment hubs, despite integration headaches, promise same-hour replenishment for densely populated districts, creating a pull for lockers and hybrid kiosks able to dispense and accept goods around the clock.
Persistent Vandalism and Cash-Handling Security Risks
Data from British Telecom revealed tens of thousands of attacks on pay-phones each year until ruggedized locks and alarms curbed incidents. Sophisticated jackpotting and skimming drives a physical and cyber security market forecast to reach USD 32.4 billion by 2032. Operators add fingerprint, facial recognition and multi-factor prompts to counter fraud, yet every new module raises cost per unit and elongates certification cycles. Collaborative patrols with police and AI-driven surveillance mitigate losses but cannot erase them entirely.
Other drivers and restraints analyzed in the detailed report include:
- Omni-Channel Banking Automation Wave
- Government Push for Cash-Lite Societies
- High TCO for Outdoor Deployments in Harsh Climates
For complete list of drivers and restraints, kindly check the Table Of Contents.
Segment Analysis
Kiosks controlled 36.2% self-service market share in 2024, highlighting their flexibility across check-in, ticketing, and bill payment. The self-service market size tied to kiosks benefits from continuous software refreshes that add language packs, AI avatars, and payment choices. Self-checkout lanes are growing at an 8.3% CAGR as grocers and general merchandisers curb labor expenses and speed the line. ATMs still anchor cash ecosystems, yet annual installations are plateauing because mobile transfers now satisfy many low-value needs. Vending machines move beyond snacks into OTC medicines, PPE, and time-sensitive vaccines, which widens their social footprint. Smart lockers registered brisk orders from logistics firms under pressure to cut last-mile costs and allow after-hours parcel pick-up. Healthcare kiosks, projected to ramp from USD 0.8 billion in 2024 to USD 1.81 billion by 2028, illustrate how diagnosis, telehealth, and prescription renewal can converge in compact footprints. Retailers adopt computer vision so cameras automatically weigh produce, minimizing errors and shopper frustration. The product mix will continue to reward vendors who merge durability with cloud hooks that unlock real-time insights and remote service.
Kiosk suppliers invest in antimicrobial surfaces, haptic feedback, and wheelchair-friendly layouts to stay ahead of accessibility rules. Self-checkout makers partner with fintech gateways to switch on buy-now-pay-later while still conforming to payment security standards. ATM vendors pivot toward Video Teller Machines and cryptocurrency modules to preserve relevance. Vending specialists test dynamic refrigeration and AI planograms to display fast-moving inventory first, which uplifts sales per square inch. Locker providers add temperature control for the grocery and pharmaceutical segments. Portfolio breadth, therefore, remains a hedge against shifts in consumer flow and merchant economics within the self-service market.
Hardware was responsible for 54.0% of revenue in 2024, yet software is advancing 9.0% each year and is the key to lifetime monetization. Vendors deploy containerized operating systems that permit secure updates without field visits, shortening mean-time-to-market for new features. Cloud dashboards spotlight usage spikes, allowing retailers to preload staff only when traffic demands. Diebold Nixdorf's DN Vynamic suite connects more than 230,000 endpoints and pushes predictive maintenance alerts that reduce unscheduled downtime. AI engines sit at the edge, flagging suspicious withdrawal patterns within milliseconds and supporting instant lockouts. Integrations with loyalty platforms also open upsell moments right on the screen.
Services round out the component play, spanning installation, decommissioning, software patching, and compliance audits. As recurring contracts expand, service margins may eclipse those of hardware shipments. Accessibility consultants ensure adherence to tactile, speech, and visual standards laid out in the Federal Register. Firms that couple ERP and point-of-sale data with kiosk telemetry enable closed-loop analytics showing sales uplift by SKU, shift, and location. This visibility is central to procurement decisions at large chains that roll kiosks worldwide on thin capex cycles within the self-service market.
The Self-Service Market Report is Segmented by Product Type (Kiosk, ATM, and More), Component (Hardware, Software, and Services), End-User Industry (BFSI, Retail and Quick-Service Restaurant, and More), Technology (Biometric-Enabled, NFC / Contactless, AI-Driven and Computer-Vision, and More), Deployment Location (Indoor and Outdoor), and Geography.
Geography Analysis
North America held 39.4% of revenue in 2024, reflecting long-standing adoption of automated teller technology, wide retail deployment, and supportive privacy regulations. Payment card penetration is nearly universal, and digital wallets are mainstream, so merchants prioritize terminals that handle chip, tap, and mobile credentials. Federal agencies devote stimulus budgets to broadband and digital government portals, fostering a consistent user experience in public service kiosks. Corporate appetite for AI, cloud, and cybersecurity rises each budget cycle, reinforcing demand for software-centric upgrades that sit atop existing hardware.
Europe balances sustainability and inclusion. The European Commission urges eco-design and transparent supply chains, pushing manufacturers to lengthen device lifespans and publish carbon footprints. Accessibility law compels tactile keypads, audio prompts, and adjustable font sizes, which influence BOM and firmware design. Germany's EHI initiative demonstrates commercial appetite by counting thousands of self-checkout lanes, while the region debates best formats for a digital euro that could seamlessly link to kiosks and ATMs. Operators retrofit remote telemetry to trim service van miles, aligning with climate targets.
Asia-Pacific, advancing at an 8.5% CAGR, benefits from pro-digitization edicts and an explosion of smartphone-linked QR payments. India stages billions of UPI transfers each month, normalizing QR taps even in rural kiosks. China pilots a central bank digital currency that will likely integrate into transit and vending networks, placing pressure on operators to update firmware fast. Governments in ASEAN fund e-government lobbies inside post offices, reducing red tape while ensuring remote citizens receive equal service. South America and the Middle East trail but accelerate as telcos push mobile money and as tourism revives interest in multi-language ticketing stations.
- NCR Corporation
- Diebold Nixdorf
- Crane Payment Innovations
- Fujitsu Ltd.
- Glory Global Solutions
- Zebra Technologies
- Advantech Co. Ltd.
- Frank Mayer and Associates Inc.
- HESS Cash Systems GmbH
- Azkoyen Group
- Embross
- SEDCO
- IER Group
- Maas International B.V.
- RedyRef Interactive
- Olea Kiosks Inc.
- Posiflex Technology Inc.
- SlabbKiosks
- KIOSK Information Systems
Additional Benefits:
- The market estimate (ME) sheet in Excel format
- 3 months of analyst support
TABLE OF CONTENTS
1 INTRODUCTION
- 1.1 Study Assumptions and Market Definition
- 1.2 Scope of the Study
2 RESEARCH METHODOLOGY
3 EXECUTIVE SUMMARY
4 MARKET LANDSCAPE
- 4.1 Market Overview
- 4.2 Market Drivers
- 4.2.1 Ubiquity of contact-free transactions post-COVID
- 4.2.2 Rapid rollout of smart retail formats
- 4.2.3 Omni-channel banking automation wave
- 4.2.4 Government push for cash-lite societies
- 4.2.5 AI-powered adaptive user interfaces
- 4.2.6 Micro-fulfilment and 24/7 unmanned concepts
- 4.3 Market Restraints
- 4.3.1 Persistent vandalism and cash-handling security risks
- 4.3.2 High TCO for outdoor deployments in harsh climates
- 4.3.3 Limited accessibility standards harmonisation
- 4.3.4 Rising e-commerce bypassing vending channels
- 4.4 Value Chain Analysis
- 4.5 Technological Outlook
- 4.6 Porter's Five Forces Analysis
- 4.6.1 Bargaining Power of Suppliers
- 4.6.2 Bargaining Power of Buyers
- 4.6.3 Threat of New Entrants
- 4.6.4 Threat of Substitutes
- 4.6.5 Competitive Rivalry
- 4.7 Major Technological Developments
- 4.7.1 Evolution of Self-Service Kiosks
- 4.7.2 Barrier-Free Kiosk Standards and Working Groups
- 4.7.3 Leading Case Studies and User-Surveys
5 MARKET SIZE AND GROWTH FORECASTS (VALUE)
- 5.1 By Product Type
- 5.1.1 Kiosk
- 5.1.2 ATM
- 5.1.3 Vending Machine
- 5.1.4 Self-Checkout System
- 5.1.5 Smart Locker / Parcel Station
- 5.2 By Component
- 5.2.1 Hardware
- 5.2.2 Software
- 5.2.3 Services
- 5.3 By End-user Industry
- 5.3.1 BFSI
- 5.3.2 Retail and Quick-Service Restaurant
- 5.3.3 Hospitality
- 5.3.4 Healthcare
- 5.3.5 Transportation and Travel Hubs
- 5.3.6 Government and Public Sector
- 5.4 By Technology
- 5.4.1 Biometric-Enabled
- 5.4.2 NFC / Contactless
- 5.4.3 AI-Driven and Computer-Vision
- 5.4.4 Cloud-Connected
- 5.5 By Deployment Location
- 5.5.1 Indoor
- 5.5.2 Outdoor
- 5.6 By Geography
- 5.6.1 North America
- 5.6.1.1 United States
- 5.6.1.2 Canada
- 5.6.1.3 Mexico
- 5.6.2 Europe
- 5.6.2.1 Germany
- 5.6.2.2 United Kingdom
- 5.6.2.3 France
- 5.6.2.4 Italy
- 5.6.2.5 Spain
- 5.6.2.6 Russia
- 5.6.2.7 Rest of Europe
- 5.6.3 Asia-Pacific
- 5.6.3.1 China
- 5.6.3.2 Japan
- 5.6.3.3 India
- 5.6.3.4 South Korea
- 5.6.3.5 ASEAN
- 5.6.3.6 Australia and New Zealand
- 5.6.3.7 Rest of Asia-Pacific
- 5.6.4 South America
- 5.6.4.1 Brazil
- 5.6.4.2 Argentina
- 5.6.4.3 Rest of South America
- 5.6.5 Middle East and Africa
- 5.6.5.1 Middle East
- 5.6.5.1.1 Saudi Arabia
- 5.6.5.1.2 UAE
- 5.6.5.1.3 Turkey
- 5.6.5.1.4 Rest of Middle East
- 5.6.5.2 Africa
- 5.6.5.2.1 South Africa
- 5.6.5.2.2 Nigeria
- 5.6.5.2.3 Rest of Africa
- 5.6.1 North America
6 COMPETITIVE LANDSCAPE
- 6.1 Market Concentration
- 6.2 Strategic Moves
- 6.3 Market Share Analysis
- 6.4 Company Profiles (includes Global level Overview, Market level overview, Core Segments, Financials as available, Strategic Information, Market Rank/Share for key companies, Products and Services, and Recent Developments)
- 6.4.1 NCR Corporation
- 6.4.2 Diebold Nixdorf
- 6.4.3 Crane Payment Innovations
- 6.4.4 Fujitsu Ltd.
- 6.4.5 Glory Global Solutions
- 6.4.6 Zebra Technologies
- 6.4.7 Advantech Co. Ltd.
- 6.4.8 Frank Mayer and Associates Inc.
- 6.4.9 HESS Cash Systems GmbH
- 6.4.10 Azkoyen Group
- 6.4.11 Embross
- 6.4.12 SEDCO
- 6.4.13 IER Group
- 6.4.14 Maas International B.V.
- 6.4.15 RedyRef Interactive
- 6.4.16 Olea Kiosks Inc.
- 6.4.17 Posiflex Technology Inc.
- 6.4.18 SlabbKiosks
- 6.4.19 KIOSK Information Systems
7 MARKET OPPORTUNITIES AND FUTURE OUTLOOK
- 7.1 White-Space and Unmet-Need Assessment
 自助式超級市場市場規模、佔有率及成長分析(依技術、配送類型、應用、最終用戶及地區分類)-2026-2033年產業預測
 自助服務市場規模、佔有率和成長分析(按類型、最終用戶和地區分類)-2026-2033年產業預測
 2032 年自助服務技術市場預測:按產品類型、部署模式、技術、應用、最終用戶和地區進行的全球分析自助服務技術市場至2030年的預測:按產品類型、部署模式、介面、最終用戶和地區的全球分析
 自助服務技術的全球市場
 自助服務應用程式市場,按產品類型、按組件、按部署、按應用程式、按國家和地區 - 2024-2032 年行業分析、市場規模、市場佔有率和預測
 自助服務技術的全球市場 2024-2028