


 |
市場調查報告書
商品編碼
1849933
勒索軟體防護:市場佔有率分析、產業趨勢、統計數據和成長預測(2025-2030 年)Ransomware Protection - Market Share Analysis, Industry Trends & Statistics, Growth Forecasts (2025 - 2030) |
||||||
※ 本網頁內容可能與最新版本有所差異。詳細情況請與我們聯繫。
預計到 2025 年反勒索軟體市場規模將達到 258.6 億美元,到 2030 年將達到 554.2 億美元,複合年成長率為 16.5%。
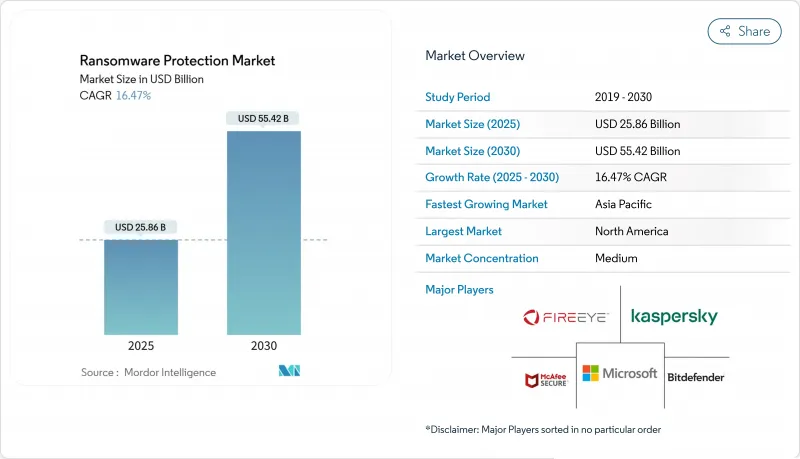
不斷擴張的勒索軟體即服務生態系統、三重提取威脅的興起以及由操作技術驅動的不斷擴大的攻擊面,持續推動著支出成長勢頭。企業現在優先考慮整合預防、檢測和快速恢復,以便在加密成功的情況下保持業務永續營運。暴露的雲端工作負載、日益嚴格的全球資訊揭露法律以及不斷提高的網路保險閾值,正在將預算轉向零信任控制、不可變備份和行為分析。隨著最終用戶青睞將端點、身分、雲端和備份功能與託管偵測和回應服務相結合的整合平台,供應商整合正在興起。
全球反勒索軟體市場趨勢與洞察
網路釣魚和針對性攻擊激增
生成式人工智慧語音克隆將把傳統的網路釣魚轉變為令人信服的“語音釣魚”,到2025年,憑證洩漏率將上升。 Microsoft Defender XDR 的網路釣魚分類代理現在會自動標記可疑訊息,使安全團隊能夠縮短回應週期並提高準確性。金融機構報告稱,近期56%的資料外洩是由未修補的VPN漏洞造成的,這促使他們部署用戶和實體行為分析來標記異常會話活動。對社會工程對策的日益關注,推動了對電子郵件、端點和身分的持續監控的需求。
勒索軟體即服務的繁榮
地下論壇上出售的活躍惡意軟體套件中,超過一半是勒索軟體變種,RaaS 業者通常會收取 10% 到 40% 的勒索費用。較低的技術門檻使得關聯組織能夠攻擊工業企業,導致以 OT 為重點的事件激增 87%。越來越多的企業訂閱威脅情報來源,這些情報來源可以精準定位新興的關聯組織和預發布攻擊指標,從而能夠在偵測規則被武器化之前更新偵測規則。
免費的基本端點工具可控制費用
Windows 和主流瀏覽器平台整合的防護功能無需額外付費即可提供基本的惡意軟體防護。這些工具很少能夠緩解商用勒索軟體,並且提供行為分析、欺騙或自動回溯功能。一些小企業主錯誤地判斷了自身的風險敞口,並推遲了付費升級,從而降低了專業供應商的潛在收益。因此,商業供應商強調先進的回應能力、供應鏈遠端檢測和保險合格報告,以證明其保費合理。
細分分析
到2024年,本地部署將佔總收入的68.7%,這凸顯了受到嚴格監管的企業對合規性和資料主權的需求。即便如此,到2030年,雲端訂閱量仍將以18.1%的複合年成長率成長。隨著買家接受彈性分析和簡化更新,雲端交付勒索軟體防護的市場規模預計將激增。將本地感測器與基於SaaS的關聯引擎相結合的混合設計正在成為常態,使團隊能夠在現場維護遙測資料的同時,充分利用場外外部部署的規模。
自動簡介編配縮短了平均恢復時間。 Commvault 的 Cloud Rewind 現在可以在幾分鐘內恢復整個租戶環境,吸引了先前因恢復不確定性而猶豫不決的組織的興趣。持續的態勢監控、整合金鑰管理和策略即程式碼管道進一步吸引了那些重視 DevSecOps 完整性而非硬體更新週期的開發團隊。
端點保護仍是勒索軟體防禦堆疊中購買率最高的產品,佔2024年收入的44.2%。然而,備份和復原的複合年成長率在所有應用組中最高,為17.2%。如果預防層失效,不可變的空氣間隙儲存庫是最後的選擇。 ExaGrid的非面向網路層和延遲刪除功能就是防止攻擊者竄改還原點的設計範例。
電子郵件和 Web 閘道器模組正在不斷發展,其安全存取服務邊際架構可透過雲端偵測節點路由流量,從而降低分散式員工的延遲。這些平台也內建了網路分段功能,在增強遏制能力的同時,模糊了類別之間的界線。隨著買家不斷整合平台,供應商正在將先前分散的模組捆綁到統一的許可證中,這種模式正在推動勒索軟體防護市場的發展。
勒索軟體保護市場報告按部署(本地、雲端)、應用程式(端點保護、電子郵件保護等)、最終用戶行業(BFSI、醫療保健等)、組織規模(大型企業、中小型企業 (SME))和地區進行細分。
區域分析
2024年,北美將佔據36.5%的收入佔有率,這主要得益於成熟的合規制度以及金融和醫療保健領域龐大的企業預算。關鍵基礎設施強制事件通報等聯邦措施進一步提升了基本的安全預期。隨著承保方收緊承保要求,美國企業的勒索軟體防護市場規模將持續成長。
到 2030 年,亞太地區的複合年成長率將達到 17.4%,位居榜首。澳洲推出新法律,要求披露贖金支付情況,東南亞在 2024 年記錄了超過 135,000 起勒索軟體案件,這些都凸顯了該地區的損失。許多亞太地區的政府已經啟動了資助計劃,幫助中型企業採用零信任控制,從而加速跨國公司總部以外的採用。
在歐洲,NIS2 指令涵蓋多達 15 萬個關鍵營業單位,違規罰款高達 1,000 萬歐元。隨著歐盟中小企業實施強制性風險評估和供應鏈監控,預計其在勒索軟體防護領域的市場佔有率將有所提升。同時,隨著企業加大對生成式人工智慧分析和違規回應保留金的投資,預計到 2025 年,中東和非洲地區的安全支出將超過 30 億美元。拉丁美洲的勒索軟體感染率遠高於全球平均水平,巴西訂定了新的法規,要求企業在三天內披露資訊,這為託管安全提供商帶來了區域機會。
其他福利:
- Excel 格式的市場預測 (ME) 表
- 3個月的分析師支持
目錄
第1章 引言
- 研究假設和市場定義
- 調查範圍
第2章調查方法
第3章執行摘要
第4章 市場狀況
- 市場概況
- 市場促進因素
- 網路釣魚和有針對性的攻擊日益增多
- 勒索軟體即服務(RaaS)的繁榮
- 雲端/SaaS遷移擴大了攻擊面
- 高階主管必須購買網路保險
- 實施零信任和微分段
- 資料竊盜與三重勒索手段的興起
- 市場限制
- 使用免費的基本端點工具節省資金
- 減少贖金支付有利於執法
- 複雜部署所需的網路人才短缺
- 中小企業全端 XDR 整體成本高昂
- 價值鏈分析
- 監管格局
- 技術展望
- 波特五力分析
- 供應商的議價能力
- 買方的議價能力
- 新進入者的威脅
- 替代品的威脅
- 競爭對手之間的競爭
- 投資分析
- 評估宏觀經濟趨勢對市場的影響
第5章市場規模及成長預測
- 按部署
- 本地部署
- 雲
- 按用途
- 端點保護
- 電子郵件保護
- 網路/網路安全
- 備份和恢復/災難復原
- 按最終用戶產業
- BFSI
- 衛生保健
- 政府和公共部門
- 資訊科技和通訊
- 製造業和工業
- 教育
- 按公司規模
- 主要企業
- 小型企業
- 按地區
- 北美洲
- 美國
- 加拿大
- 墨西哥
- 歐洲
- 德國
- 英國
- 法國
- 義大利
- 西班牙
- 俄羅斯
- 其他歐洲地區
- 亞太地區
- 中國
- 日本
- 印度
- 韓國
- 澳洲和紐西蘭
- 其他亞太地區
- 南美洲
- 巴西
- 阿根廷
- 南美洲其他地區
- 中東和非洲
- 中東
- 沙烏地阿拉伯
- 阿拉伯聯合大公國
- 土耳其
- 其他中東地區
- 非洲
- 南非
- 奈及利亞
- 其他非洲國家
- 北美洲
第6章 競爭態勢
- 市場集中度
- 策略趨勢
- 市佔率分析
- 公司簡介
- CrowdStrike Holdings, Inc.
- Microsoft(Defender/XDR)
- Trend Micro Inc.
- Palo Alto Networks
- SentinelOne
- Sophos Ltd.
- Symantec(Broadcom)
- McAfee LLC
- Kaspersky Lab
- Bitdefender
- FireEye/Trellix
- Zscaler Inc.
- Cisco(Secure Endpoint)
- Fortinet, Inc.
- Acronis International
- Datto(Kaseya)
- Veeam Software
- Barracuda Networks
- Webroot(OpenText)
- Check Point Software
第7章 市場機會與未來展望
The ransomware protection market size stands at USD 25.86 billion in 2025 and is forecast to climb to USD 55.42 billion by 2030, advancing at a 16.5% CAGR.
Expanding ransomware-as-a-service ecosystems, the rise of triple-extortion threats, and a widening operational-technology attack surface keep spending momentum strong. Enterprises now emphasize integrated prevention, detection, and rapid recovery so they can maintain business continuity even when encryption succeeds. Cloud workload exposure, tightening global disclosure laws, and higher cyber-insurance thresholds are shifting budgets toward zero-trust controls, immutable backups, and behavioral analytics. Vendor consolidation intensifies because end users favor unified platforms that blend endpoint, identity, cloud, and backup capabilities with managed detection and response services.
Global Ransomware Protection Market Trends and Insights
Escalating Phishing and Targeted Breaches
Generative-AI voice cloning turns conventional phishing into persuasive "vishing," increasing credential compromise rates in 2025. Microsoft's Phishing Triage Agent in Defender XDR now auto-labels suspicious messages, allowing security teams to shorten response cycles while boosting accuracy. Financial institutions say 56% of recent breaches originated from unpatched VPN flaws, pushing them to deploy user-entity behavior analytics that flag anomalous session activity. Heightened focus on social-engineering countermeasures fuels demand for continuous email, endpoint, and identity monitoring that work in concert rather than in silos.
Ransomware-as-a-Service Boom
More than half of active malware kits sold on underground forums are ransomware variants, and RaaS operators typically collect a 10%-40% cut of every extortion payment. Low technical barriers enable affiliates to attack industrial firms, driving an 87% surge in OT-focused incidents. Enterprises increasingly subscribe to threat-intelligence feeds that pinpoint emerging affiliate groups and pre-release indicators of compromise, allowing them to update detection rules before weaponization.
Free Basic Endpoint Tools Depress Spend
Integrated protections inside Windows and major browser platforms deliver baseline anti-malware at no added cost. While these tools curb commoditized ransomware strains, they rarely offer behavioral analytics, deception, or automated rollback. Some SMB owners, misjudging their exposure, delay paid upgrades, eroding prospective revenue for specialist vendors. Commercial suppliers therefore highlight advanced response functions, supply-chain telemetry, and insurance-eligibility reports to justify premium tiers.
Other drivers and restraints analyzed in the detailed report include:
- Cloud and SaaS Migration Enlarging Attack Surface
- Cyber-Insurance Mandates for Advanced Controls
- Law-Enforcement Wins Cutting Ransom Payments
For complete list of drivers and restraints, kindly check the Table Of Contents.
Segment Analysis
In 2024, on-premises implementations accounted for 68.7% of revenue, underlining compliance and data-sovereignty demands among heavily regulated enterprises. Nevertheless, cloud subscriptions are sprinting forward at an 18.1% CAGR through 2030. The ransomware protection market size for cloud-delivered offerings is projected to rise sharply as buyers embrace elastic analytics and simplified updates. Hybrid designs are now standard, pairing local sensors with SaaS-based correlation engines so teams keep telemetry on-site while leveraging off-premises scale.
Automated snapshot orchestration shortens mean time to recover. Commvault's Cloud Rewind now restores full tenant environments in minutes, rallying interest from organizations that previously hesitated due to recovery uncertainty. Continuous posture monitoring, integrated key management, and policy-as-code pipelines further attract development teams that favor DevSecOps alignment over hardware refresh cycles.
Endpoint protection delivered 44.2% of 2024 revenue and remains the first purchase in any ransomware defence stack. Still, backup and recovery are on track for a 17.2% CAGR, the highest among application groups. Immutable and air-gapped repositories now act as a last-line assurance when prevention layers fail. ExaGrid's non-network-facing tier and delayed delete feature exemplify designs that stop attackers from tampering with restore points.
Email and web-gateway modules evolve via secure access service edge architectures that route traffic through cloud inspection nodes, lowering latency for distributed workforces. Network segmentation features also move into these platforms, blurring lines between categories while strengthening containment. As buyers push toward platform consolidation, vendors bundle previously discrete modules into unified licences, a pattern reinforcing the ransomware protection market momentum.
The Ransomware Protection Market Report is Segmented by Deployment (On-Premises and Cloud), Application (Endpoint Protection, Email Protection, and More), End-User Industry (BFSI, Healthcare, and More), Organization Size (Large Enterprises and Small and Medium Enterprises (SMEs)), and Geography.
Geography Analysis
North America led with 36.5% revenue share in 2024, anchored by mature compliance regimes in finance and healthcare plus sizeable enterprise budgets. Federal initiatives such as mandatory incident reporting for critical infrastructure further elevate baseline security expectations. The ransomware protection market size for United States-based organizations will continue to climb as insurance underwriters harden coverage terms.
Asia-Pacific posts the fastest 17.4% CAGR to 2030. New laws in Australia require ransom-payment disclosures, and Southeast Asia recorded more than 135,000 ransomware cases in 2024, spotlighting regional exposure. Many APAC governments launch subsidy programs that help mid-market firms adopt zero-trust controls, accelerating uptake beyond multinational headquarters.
Europe benefits from the NIS2 directive, which covers up to 150,000 essential entities and sets fines at EUR 10 million for non-compliance. The ransomware protection market share for EU-based SMEs is expected to rise as they implement mandatory risk assessments and supply-chain monitoring. Meanwhile, the Middle East and Africa foresee security outlays exceeding USD 3 billion in 2025 as enterprises invest in generative-AI analytics and breach-response retainers. Latin America grapples with a ransomware involvement rate notably higher than the global average, driving new regulation in Brazil that forces disclosure within three days, thereby enlarging regional opportunity for managed security providers.
- CrowdStrike Holdings, Inc.
- Microsoft (Defender/XDR)
- Trend Micro Inc.
- Palo Alto Networks
- SentinelOne
- Sophos Ltd.
- Symantec (Broadcom)
- McAfee LLC
- Kaspersky Lab
- Bitdefender
- FireEye / Trellix
- Zscaler Inc.
- Cisco (Secure Endpoint)
- Fortinet, Inc.
- Acronis International
- Datto (Kaseya)
- Veeam Software
- Barracuda Networks
- Webroot (OpenText)
- Check Point Software
Additional Benefits:
- The market estimate (ME) sheet in Excel format
- 3 months of analyst support
TABLE OF CONTENTS
1 INTRODUCTION
- 1.1 Study Assumptions and Market Definition
- 1.2 Scope of the Study
2 RESEARCH METHODOLOGY
3 EXECUTIVE SUMMARY
4 MARKET LANDSCAPE
- 4.1 Market Overview
- 4.2 Market Drivers
- 4.2.1 Escalating phishing and targeted breaches
- 4.2.2 Ransomware-as-a-Service (RaaS) boom
- 4.2.3 Cloud/SaaS migration enlarging attack surface
- 4.2.4 Cyber-insurance mandates for advanced controls
- 4.2.5 Zero-trust and micro-segmentation adoption
- 4.2.6 Rise of data-exfiltration and triple-extortion tactics
- 4.3 Market Restraints
- 4.3.1 Free basic endpoint tools depress spend
- 4.3.2 Law-enforcement wins cutting ransom payments
- 4.3.3 Cyber-talent shortage for complex roll-outs
- 4.3.4 High total cost of full-stack XDR for SMBs
- 4.4 Value Chain Analysis
- 4.5 Regulatory Landscape
- 4.6 Technological Outlook
- 4.7 Porter's Five Forces Analysis
- 4.7.1 Bargaining Power of Suppliers
- 4.7.2 Bargaining Power of Buyers
- 4.7.3 Threat of New Entrants
- 4.7.4 Threat of Substitutes
- 4.7.5 Intensity of Competitive Rivalry
- 4.8 Investment Analysis
- 4.9 Assessment of the Impact of Macroeconomic Trends on the Market
5 MARKET SIZE AND GROWTH FORECASTS (VALUE)
- 5.1 By Deployment
- 5.1.1 On-Premises
- 5.1.2 Cloud
- 5.2 By Application
- 5.2.1 Endpoint Protection
- 5.2.2 Email Protection
- 5.2.3 Network / Web Security
- 5.2.4 Backup and Recovery / DR
- 5.3 By End-user Industry
- 5.3.1 BFSI
- 5.3.2 Healthcare
- 5.3.3 Government and Public Sector
- 5.3.4 IT and Telecom
- 5.3.5 Manufacturing and Industrial
- 5.3.6 Education
- 5.4 By Organisation Size
- 5.4.1 Large Enterprises
- 5.4.2 Small and Medium Enterprises (SMEs)
- 5.5 By Geography
- 5.5.1 North America
- 5.5.1.1 United States
- 5.5.1.2 Canada
- 5.5.1.3 Mexico
- 5.5.2 Europe
- 5.5.2.1 Germany
- 5.5.2.2 United Kingdom
- 5.5.2.3 France
- 5.5.2.4 Italy
- 5.5.2.5 Spain
- 5.5.2.6 Russia
- 5.5.2.7 Rest of Europe
- 5.5.3 Asia-Pacific
- 5.5.3.1 China
- 5.5.3.2 Japan
- 5.5.3.3 India
- 5.5.3.4 South Korea
- 5.5.3.5 Australia and New Zealand
- 5.5.3.6 Rest of Asia-Pacific
- 5.5.4 South America
- 5.5.4.1 Brazil
- 5.5.4.2 Argentina
- 5.5.4.3 Rest of South America
- 5.5.5 Middle East and Africa
- 5.5.5.1 Middle East
- 5.5.5.1.1 Saudi Arabia
- 5.5.5.1.2 United Arab Emirates
- 5.5.5.1.3 Turkey
- 5.5.5.1.4 Rest of Middle East
- 5.5.5.2 Africa
- 5.5.5.2.1 South Africa
- 5.5.5.2.2 Nigeria
- 5.5.5.2.3 Rest of Africa
- 5.5.1 North America
6 COMPETITIVE LANDSCAPE
- 6.1 Market Concentration
- 6.2 Strategic Moves
- 6.3 Market Share Analysis
- 6.4 Company Profiles (includes Global level Overview, Market level overview, Core Segments, Financials as available, Strategic Information, Market Rank/Share for key companies, Products and Services, and Recent Developments)
- 6.4.1 CrowdStrike Holdings, Inc.
- 6.4.2 Microsoft (Defender/XDR)
- 6.4.3 Trend Micro Inc.
- 6.4.4 Palo Alto Networks
- 6.4.5 SentinelOne
- 6.4.6 Sophos Ltd.
- 6.4.7 Symantec (Broadcom)
- 6.4.8 McAfee LLC
- 6.4.9 Kaspersky Lab
- 6.4.10 Bitdefender
- 6.4.11 FireEye / Trellix
- 6.4.12 Zscaler Inc.
- 6.4.13 Cisco (Secure Endpoint)
- 6.4.14 Fortinet, Inc.
- 6.4.15 Acronis International
- 6.4.16 Datto (Kaseya)
- 6.4.17 Veeam Software
- 6.4.18 Barracuda Networks
- 6.4.19 Webroot (OpenText)
- 6.4.20 Check Point Software
7 MARKET OPPORTUNITIES AND FUTURE OUTLOOK
- 7.1 White-space and Unmet-need Assessment
 勒索軟體防護市場:按組件、安全生命週期階段、部署類型、組織規模和產業分類-2026-2032年全球市場預測
 2026年全球勒索軟體防護市場報告
 關鍵基礎設施保護網路安全市場規模、佔有率和趨勢分析報告:按類型、部署模式、最終用途和細分市場預測(2026-2033 年)
 勒索軟體防護市場分析及預測(至 2035 年):按類型、產品、服務、技術、組件、應用、部署模式、最終用戶和解決方案分類
 反勒索軟體市場規模、佔有率和成長分析(按解決方案、服務、部署類型、垂直產業和地區分類)-2026-2033年產業預測
 勒索軟體保護市場 - 全球產業規模、佔有率、趨勢、機會和預測(按組件、按部署模式、按最終用戶產業、按地區和競爭細分,2020-2030 年預測)全球反勒索軟體市場:市場規模、佔有率和趨勢分析(按組件、部署方法、組織規模、應用、最終用戶和地區)、按細分市場預測(2025-2033)
 2032 年反勒索軟體市場預測:按解決方案、服務、部署模式、組織規模、應用程式、最終用戶和地區進行的全球分析
 全球反勒索軟體市場:產業分析、規模、佔有率、成長、趨勢、預測(2024-2031)