


 |
市場調查報告書
商品編碼
1849930
端點安全:市場佔有率分析、產業趨勢、統計數據和成長預測(2025-2030 年)Endpoint Security - Market Share Analysis, Industry Trends & Statistics, Growth Forecasts (2025 - 2030) |
||||||
※ 本網頁內容可能與最新版本有所差異。詳細情況請與我們聯繫。
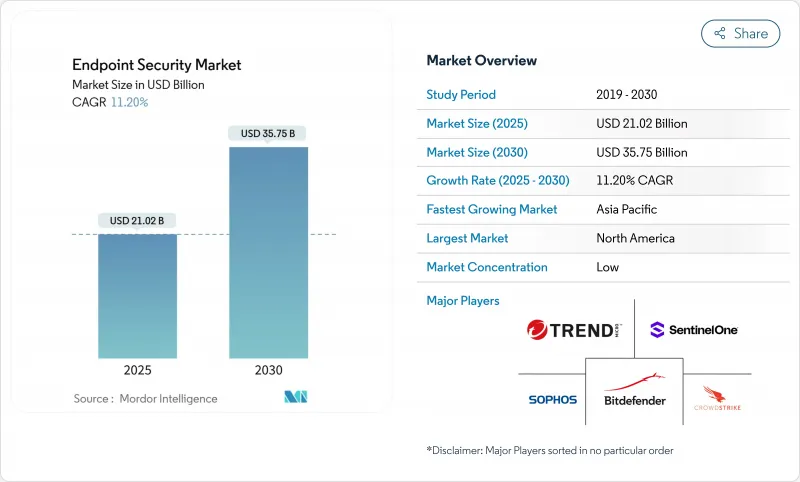
預計端點安全市場規模將在 2025 年達到 210.2 億美元,到 2030 年達到 357.5 億美元,預測期內(2025-2030 年)的複合年成長率為 11.20%。
強勁的需求源於遠端辦公和混合辦公模式的穩步轉變、自帶設備辦公 (BYOD) 政策的擴展以及勒索軟體即服務套件包的日益複雜。企業也面臨物聯網 (IoT) 不斷擴張的威脅,這模糊了資訊科技和操作技術網路之間的界限,使關鍵工業資產面臨與傳統辦公設備相同的威脅。因此,雲端交付的控制、零信任存取策略和人工智慧主導的行為分析正在成為現代端點保護策略的預設組成部分。平台提供者正在透過將晶片級安全功能以及端點保護平台 (EPP) 和端點檢測與回應 (EDR) 功能捆綁到其安全存取服務邊緣 (SASE) 產品中來簡化分散式用戶的策略實施。
全球端點安全市場趨勢與洞察
BYOD 和行動工作人員的激增
BYOD 政策已將約 47 億個行動終端暴露在傳統防火牆之外,推動了行動裝置管理工具的快速普及,這些工具將企業資料與個人應用隔離。鑑於目前 70% 的攻擊都涉及身分洩露,企業正傾向於採用零信任框架,在授予網路存取權限之前檢驗設備狀態。高階主管擴大將網路安全視為董事會層面的優先事項,91% 的高階主管表示網路安全是一項策略資產,而非合規性問題。現代終端套件內建的人工智慧功能可執行即時行為分析,並標記多樣化設備生態系統中的危險行為。
勒索軟體即服務的演變
基於服務的勒索軟體降低了進入門檻,導致2024年初感染數量激增50%。醫療保健產業資料外洩目前平均造成1,010萬美元損失,迫使醫院部署先進的偵測和回應平台,將端點和網路遙測資料關聯起來。雙重和三重勒索手段也針對備份,迫使企業重新考慮資料復原計畫。分析師預測,到2031年,勒索軟體每年造成的損失將超過2,650億美元,這將導致主動端點防禦方面的支出增加。
SOC 和事件回應團隊的技能短缺
全球整體網路專業人員短缺 300 萬,近一半的首席資訊安全安全長擔心覆蓋範圍不足,因此託管檢測和響應 (MDR) 的採用正在加速,預計到 2025 年,一半的組織將外包全天候監控。在人才管道改善之前,用於分類警報和腳本遏制操作的自動化和人工智慧工具被視為一種實用的權宜之計。
細分分析
端點偵測與反應產品的複合年成長率高達15.8%,輕鬆超越傳統防毒工具。儘管企業傾向於使用行為分析來發現零日漏洞,但防火牆/UTM設備憑藉與現有網路設備的深度整合,仍保持著20.02%的收入佔有率。託管偵測與回應訂閱服務也正在興起,這類服務提供專業知識,而非自行建構內部安全營運中心。
由於 GDPR 和 NIS2 等法規要求資料保護控制得到驗證,監管審查正在推動加密和預防資料外泄模組的發展。由於安全更新平均需要 97 天才能發布,暴露了攻擊面,修補程式管理實用程式正在吸引投資。阻止惡意軟體的應用程式控制工具有助於降低企業網路上個人裝置的影子 IT 風險。
2024年,雲端平台將佔端點安全市場規模的58.04%,預計2030年將以每年15.2%的速度成長。集中式策略引擎可以加速部署到全球分佈的設備,並即時為人工智慧模型提供大量資料。對於面臨資料主權法規和專業操作技術限制的企業來說,混合架構仍然很受歡迎。
在國防和關鍵基礎設施等強製本地處理的領域,本地部署仍然強勁。即使在這些情況下,許多團隊也在採用 SASE 覆蓋,將軟體定義網路與雲端交付安全性結合,以簡化管理。雲端整合的 EDR 分析功能可縮短停留時間,並增強平均回應時間統計資料。
端點安全市場按解決方案類型(防毒/反惡意軟體、防火牆/UTM 等)、部署模式(本地部署、雲端部署、混合部署)、組織規模(大型企業、中小型企業)、最終用戶垂直領域(金融服務、保險和保險業、政府、國防、醫療保健/生命科學等)和地區進行細分。市場預測以美元計算。
區域分析
2024年,北美將維持33.5%的收入佔有率。充足的安全預算、先進的威脅環境以及人工智慧的早期應用,正在刺激安全領域的持續升級。政府雲端安全計畫和密集的供應商網路正在形成良性創新循環。
歐洲的勢頭與2024年10月全面實施的NIS2指令息息相關,該指令將要求超過16萬家組織實施經認證的端點控制,否則將面臨最高1000萬歐元的罰款。這項法規對關鍵基礎設施、製造業和數位服務供應商提出了更高的要求。
亞太地區是成長最快的地區,複合年成長率高達12.4%。該地區各國都在大力投資網路彈性框架,針對通訊業者和金融機構的重大攻擊事件也加劇了經營團隊的關注。中國的安全團隊將API暴露列為首要關注點,27%的受訪者認為API暴露比惡意軟體更受重視。在政府資金投入和本地供應商生態系統的推動下,日本、韓國、澳洲和東南亞國協的網路彈性框架應用正在加速。
在中東和非洲,網路保險費的上漲和隱私法的加強,促使銀行和能源供應商升級其端點管理。在拉丁美洲,零售和數位銀行公司擴大採用雲端技術,並超越傳統的本地部署環境。
其他福利:
- Excel 格式的市場預測 (ME) 表
- 3個月的分析師支持
目錄
第1章 引言
- 研究假設和市場定義
- 調查範圍
第2章調查方法
第3章執行摘要
第4章 市場狀況
- 市場概況
- 市場促進因素
- BYOD 和行動工作者的激增
- 勒索軟體即服務的演變
- OT 網路中 IoT 端點的激增
- 邊緣採用 SASE 捆綁 EPP/EDR 的情況日益增多
- OEM整合晶片級安全IP
- 認證 EDR 的網路保險折扣
- 市場限制
- SOC 和事件回應團隊的技能短缺
- 中小企業的預算限制
- 持續端點遙測引發的隱私問題日益嚴重
- 第三方擔保代理供應鏈風險
- 產業價值鏈分析
- 監管格局
- 技術展望
- 產業吸引力-波特五力分析
- 供應商的議價能力
- 買方的議價能力
- 新進入者的威脅
- 替代品的威脅
- 競爭對手之間的競爭
- 影響市場的宏觀經濟因素
第5章市場規模與成長預測(價值)
- 按解決方案類型
- 防毒/惡意軟體保護
- 防火牆/UTM
- 端點檢測與響應 (EDR)
- 託管偵測和回應 (MDR)
- 加密和預防資料外泄
- 補丁和配置管理
- 應用程式和設備控制
- 其他
- 依部署方式
- 本地部署
- 雲
- 混合
- 按組織規模
- 主要企業
- 小型企業
- 按最終用戶產業
- BFSI
- 政府和國防
- 醫療保健和生命科學
- 製造業
- 能源和公共產業
- 零售與電子商務
- 資訊科技和通訊
- 教育
- 其他最終用戶產業
- 按地區
- 北美洲
- 美國
- 加拿大
- 墨西哥
- 南美洲
- 巴西
- 阿根廷
- 智利
- 南美洲其他地區
- 歐洲
- 德國
- 英國
- 法國
- 義大利
- 西班牙
- 俄羅斯
- 其他歐洲地區
- 亞太地區
- 中國
- 印度
- 日本
- 韓國
- 澳洲
- 新加坡
- 馬來西亞
- 其他亞太地區
- 中東和非洲
- 中東
- 阿拉伯聯合大公國
- 沙烏地阿拉伯
- 土耳其
- 其他中東地區
- 非洲
- 南非
- 奈及利亞
- 其他非洲國家
- 北美洲
第6章 競爭態勢
- 市場集中度
- 策略趨勢
- 市佔率分析
- 公司簡介
- Trend Micro Inc.
- CrowdStrike Holdings Inc.
- SentinelOne Inc.
- Sophos Ltd.
- Bitdefender LLC
- ESET Spol. s ro
- Kaspersky Lab JSC
- Trellix(Musarubra US LLC)
- OpenText(Cybersecurity & Carbonite Unit)
- WatchGuard Technologies Inc.
- Fortinet Inc.
- Cisco Systems Inc.
- Palo Alto Networks Inc.
- Broadcom Inc.(Symantec Endpoint)
- Microsoft Corporation(Defender for Endpoint)
- Deep Instinct Ltd
- Cybereason Inc.
- BlackBerry Ltd(Cylance)
- Malwarebytes Inc.
- AhnLab Inc.
- F-Secure Corp.
- Elastic NV(Security)
- ReaQta BV(IBM)
- Comodo Security Solutions Inc.
- Seqrite(Quick Heal Technologies)
第7章 市場機會與未來趨勢
- 閒置頻段和未滿足需求評估
The Endpoint Security Market size is estimated at USD 21.02 billion in 2025, and is expected to reach USD 35.75 billion by 2030, at a CAGR of 11.20% during the forecast period (2025-2030).
Strong demand stems from the steady shift toward remote and hybrid work, the expansion of bring-your-own-device (BYOD) policies, and the growing sophistication of ransomware-as-a-service toolkits. Enterprises also face an expanding Internet-of-Things (IoT) footprint that blurs the line between information-technology and operational-technology networks, exposing critical industrial assets to the same threats historically aimed at office devices. Cloud-delivered controls, zero-trust access policies, and AI-driven behavioural analytics are therefore becoming default components of modern endpoint protection strategies. Platform providers are responding by embedding chip-level security features and bundling endpoint protection platform (EPP) and endpoint detection and response (EDR) capabilities into secure-access-service-edge (SASE) offerings to simplify policy enforcement across distributed users.
Global Endpoint Security Market Trends and Insights
Surge in BYOD and Mobile Workforce
BYOD policies have exposed roughly 4.7 billion mobile endpoints that sit outside traditional firewalls, prompting rapid deployment of mobile-device-management tools that partition corporate data from personal apps. Identity compromise now appears in 70% of attacks, so firms lean on zero-trust frameworks that verify device posture before allowing network access. Executives increasingly view cybersecurity as a board-level priority, with 91% describing it as a strategic asset rather than a compliance exercise. AI features embedded in modern endpoint suites perform real-time behavioural analysis to flag risky actions across a diverse device ecosystem.
Escalating Sophistication of Ransomware-as-a-Service
Service-based ransomware lowered the barrier to entry, triggering a 50% spike in infections during early 2024. Healthcare breaches now cost USD 10.1 million on average, forcing hospitals to adopt extended-detection-and-response platforms that correlate endpoint and network telemetry. Double- and triple-extortion tactics also target backups, compelling enterprises to redesign data-recovery plans. Analysts expect ransomware damage to surpass USD 265 billion annually by 2031, funnelling more spend into proactive endpoint defences.
Skill Shortage in SOC and Incident-Response Teams
The global deficit of 3 million cyber professionals leaves roughly half of chief information security officers anxious about coverage gaps. Managed-detection-and-response (MDR) uptake is therefore accelerating, with half of organizations expected to outsource 24/7 monitoring by 2025. Automation and AI tools that triage alerts and script containment actions are seen as practical stopgaps until the workforce pipeline improves.
Other drivers and restraints analyzed in the detailed report include:
- Proliferation of IoT Endpoints Across OT Networks
- Wider Adoption of SASE Bundling EPP/EDR at Edge
- Budget Constraints Among SMBs
For complete list of drivers and restraints, kindly check the Table Of Contents.
Segment Analysis
Endpoint detection and response products are expanding at 15.8% CAGR, easily eclipsing legacy antivirus tools. Organizations favour behaviour analytics that spotlight zero-day exploits, while firewall/UTM appliances retain 20.02% revenue share thanks to deep integration with existing network gear. Managed-detection-and-response subscriptions are also gaining ground as firms lease expertise rather than build internal security operations centres.
Regulatory scrutiny is breathing life into encryption and data-loss-prevention modules as rules such as GDPR and NIS2 demand demonstrable data-protection controls. Patch-management utilities attract spend because security updates still average a 97-day rollout window, leaving attack surfaces exposed. Application-control tools that block unauthorized software help limit shadow-IT risks for personal devices on corporate networks.
Cloud platforms already command 58.04% of the endpoint security market size in 2024 and will compound 15.2% annually to 2030. Centralized policy engines accelerate rollout across globally distributed devices and feed AI models with large data volumes in real time. Hybrid architectures remain popular for firms facing data-sovereignty rules or specialist operational-technology constraints.
On-premises deployments persist in defence and critical-infrastructure verticals where local processing is mandated. Even there, many teams adopt SASE overlays that couple software-defined networking with cloud-delivered security to simplify administration. Integrated EDR analytics in the cloud reduce dwell time and enhance mean-time-to-respond statistics.
Endpoint Security Market is Segmented by Solution Type (Antivirus/Anti-malware, Firewall/UTM, and More), Deployment Mode (On-Premises, Cloud, and Hybrid), Organization Size (Large Enterprises and Small and Medium-Sized Enterprises), End-User Industry (BFSI, Government and Defense, Healthcare and Life Sciences, and More), and Geography. The Market Forecasts are Provided in Terms of Value (USD).
Geography Analysis
North America maintained 33.5% revenue share in 2024. Deep security budgets, an advanced threat landscape, and early AI adoption fuel ongoing upgrades. Government cloud-security programs and a dense network of vendors create a virtuous innovation cycle.
Europe's momentum is tied to the full enforcement of the NIS2 directive in October 2024, which compels more than 160,000 organizations to deploy certified endpoint controls or face fines up to EUR 10 million. The regulation keeps demand high across critical infrastructure, manufacturing, and digital services providers.
Asia-Pacific is the fastest-growing territory at 12.4% CAGR. Nations across the region pour investment into cyber-resilience frameworks, and high-profile attacks on telecoms and financial institutions have sharpened executive focus. Chinese security teams rank API exposure as their top concern, with 27% putting it ahead of malware. Government funding and local vendor ecosystems accelerate adoption across Japan, South Korea, Australia, and the ASEAN bloc.
The Middle East and Africa notice rising cyber-insurance premiums and tougher privacy laws, nudging banks and energy operators to upgrade endpoint controls. Latin America expands cloud deployments that leapfrog legacy on-premises estates, particularly in retail and digital-banking firms.
- Trend Micro Inc.
- CrowdStrike Holdings Inc.
- SentinelOne Inc.
- Sophos Ltd.
- Bitdefender LLC
- ESET Spol. s r.o.
- Kaspersky Lab JSC
- Trellix (Musarubra US LLC)
- OpenText (Cybersecurity & Carbonite Unit)
- WatchGuard Technologies Inc.
- Fortinet Inc.
- Cisco Systems Inc.
- Palo Alto Networks Inc.
- Broadcom Inc. (Symantec Endpoint)
- Microsoft Corporation (Defender for Endpoint)
- Deep Instinct Ltd
- Cybereason Inc.
- BlackBerry Ltd (Cylance)
- Malwarebytes Inc.
- AhnLab Inc.
- F-Secure Corp.
- Elastic NV (Security)
- ReaQta BV (IBM)
- Comodo Security Solutions Inc.
- Seqrite (Quick Heal Technologies)
Additional Benefits:
- The market estimate (ME) sheet in Excel format
- 3 months of analyst support
TABLE OF CONTENTS
1 INTRODUCTION
- 1.1 Study Assumptions and Market Definition
- 1.2 Scope of the Study
2 RESEARCH METHODOLOGY
3 EXECUTIVE SUMMARY
4 MARKET LANDSCAPE
- 4.1 Market Overview
- 4.2 Market Drivers
- 4.2.1 Surge in BYOD and mobile workforce
- 4.2.2 Escalating sophistication of ransomware-as-a-service
- 4.2.3 Proliferation of IoT endpoints across OT networks
- 4.2.4 Wider adoption of SASE bundling EPP/EDR at edge
- 4.2.5 Chip-level security IP integrated by OEMs
- 4.2.6 Cyber-insurance premium discounts for certified EDR
- 4.3 Market Restraints
- 4.3.1 Skill shortage in SOC & incident-response teams
- 4.3.2 Budget constraints among SMBs
- 4.3.3 Rising privacy backlash against continuous endpoint telemetry
- 4.3.4 Supply-chain risk of third-party security agents
- 4.4 Industry Value Chain Analysis
- 4.5 Regulatory Landscape
- 4.6 Technological Outlook
- 4.7 Industry Attractiveness - Porter's Five Forces Analysis
- 4.7.1 Bargaining Power of Suppliers
- 4.7.2 Bargaining Power of Buyers
- 4.7.3 Threat of New Entrants
- 4.7.4 Threat of Substitutes
- 4.7.5 Intensity of Competitive Rivalry
- 4.8 Impact of Macroeconomic Factors on the Market
5 MARKET SIZE AND GROWTH FORECASTS (VALUES)
- 5.1 By Solution Type
- 5.1.1 Antivirus / Anti-malware
- 5.1.2 Firewall / UTM
- 5.1.3 Endpoint Detection and Response (EDR)
- 5.1.4 Managed Detection and Response (MDR)
- 5.1.5 Encryption and Data Loss Prevention
- 5.1.6 Patch and Configuration Management
- 5.1.7 Application and Device Control
- 5.1.8 Others
- 5.2 By Deployment Mode
- 5.2.1 On-premises
- 5.2.2 Cloud
- 5.2.3 Hybrid
- 5.3 By Organization Size
- 5.3.1 Large Enterprises
- 5.3.2 Small and Medium-sized Enterprises (SME)
- 5.4 By End-user Industry
- 5.4.1 BFSI
- 5.4.2 Government and Defense
- 5.4.3 Healthcare and Life Sciences
- 5.4.4 Manufacturing
- 5.4.5 Energy and Utilities
- 5.4.6 Retail and e-Commerce
- 5.4.7 IT and Telecom
- 5.4.8 Education
- 5.4.9 Other End-User Industries
- 5.5 By Geography
- 5.5.1 North America
- 5.5.1.1 United States
- 5.5.1.2 Canada
- 5.5.1.3 Mexico
- 5.5.2 South America
- 5.5.2.1 Brazil
- 5.5.2.2 Argentina
- 5.5.2.3 Chile
- 5.5.2.4 Rest of South America
- 5.5.3 Europe
- 5.5.3.1 Germany
- 5.5.3.2 United Kingdom
- 5.5.3.3 France
- 5.5.3.4 Italy
- 5.5.3.5 Spain
- 5.5.3.6 Russia
- 5.5.3.7 Rest of Europe
- 5.5.4 Asia-Pacific
- 5.5.4.1 China
- 5.5.4.2 India
- 5.5.4.3 Japan
- 5.5.4.4 South Korea
- 5.5.4.5 Australia
- 5.5.4.6 Singapore
- 5.5.4.7 Malaysia
- 5.5.4.8 Rest of Asia-Pacific
- 5.5.5 Middle East and Africa
- 5.5.5.1 Middle East
- 5.5.5.1.1 United Arab Emirates
- 5.5.5.1.2 Saudi Arabia
- 5.5.5.1.3 Turkey
- 5.5.5.1.4 Rest of Middle East
- 5.5.5.2 Africa
- 5.5.5.2.1 South Africa
- 5.5.5.2.2 Nigeria
- 5.5.5.2.3 Rest of Africa
- 5.5.1 North America
6 COMPETITIVE LANDSCAPE
- 6.1 Market Concentration
- 6.2 Strategic Moves
- 6.3 Market Share Analysis
- 6.4 Company Profiles (includes Global level Overview, Market level overview, Core Segments, Financials as available, Strategic Information, Market Rank/Share, Products and Services, Recent Developments)
- 6.4.1 Trend Micro Inc.
- 6.4.2 CrowdStrike Holdings Inc.
- 6.4.3 SentinelOne Inc.
- 6.4.4 Sophos Ltd.
- 6.4.5 Bitdefender LLC
- 6.4.6 ESET Spol. s r.o.
- 6.4.7 Kaspersky Lab JSC
- 6.4.8 Trellix (Musarubra US LLC)
- 6.4.9 OpenText (Cybersecurity & Carbonite Unit)
- 6.4.10 WatchGuard Technologies Inc.
- 6.4.11 Fortinet Inc.
- 6.4.12 Cisco Systems Inc.
- 6.4.13 Palo Alto Networks Inc.
- 6.4.14 Broadcom Inc. (Symantec Endpoint)
- 6.4.15 Microsoft Corporation (Defender for Endpoint)
- 6.4.16 Deep Instinct Ltd
- 6.4.17 Cybereason Inc.
- 6.4.18 BlackBerry Ltd (Cylance)
- 6.4.19 Malwarebytes Inc.
- 6.4.20 AhnLab Inc.
- 6.4.21 F-Secure Corp.
- 6.4.22 Elastic NV (Security)
- 6.4.23 ReaQta BV (IBM)
- 6.4.24 Comodo Security Solutions Inc.
- 6.4.25 Seqrite (Quick Heal Technologies)
7 MARKET OPPORTUNITIES AND FUTURE TRENDS
- 7.1 White-Space and Unmet-Need Assessment
 終端安全市場:2026-2032年全球市場預測(依產品、作業系統、應用程式、最終用戶、部署類型及企業規模分類)
 2026年全球終端安全市場報告
 終端安全市場:依組件、應用點(工作站、行動裝置、伺服器、POS終端)、部署類型、產業規模和最終用戶(航空航太與國防、政府、銀行與金融保險、醫療保健、製造業) - 至2036年的全球預測
 端點安全市場分析及預測(至 2035 年):按類型、產品類型、服務、技術、組件、應用、部署類型、最終用戶和解決方案分類
 全球終端安全市場規模、佔有率、趨勢和成長分析報告(2026-2034)
 終端安全市場 - 全球產業規模、佔有率、趨勢、機會和預測(按解決方案、部署模式、組織規模、最終用戶、地區和競爭格局分類,2021-2031 年)
 全球終端安全市場:依組件、部署類型、組織規模、垂直行業和地區劃分 - 市場規模、行業動態、機會分析和預測(2026-2035年)終端安全市場 - 2026-2031 年預測
 日本終端安全市場報告:按組件、部署類型、組織規模、產業和地區分類(2026-2034 年)
 端點安全市場規模、佔有率和成長分析(按解決方案、服務、部署類型、組織規模、垂直產業和地區分類)-2026-2033年產業預測