


 |
市場調查報告書
商品編碼
1849919
服務機器人:市場佔有率分析、行業趨勢、統計數據和成長預測(2025-2030 年)Service Robotics - Market Share Analysis, Industry Trends & Statistics, Growth Forecasts (2025 - 2030) |
||||||
※ 本網頁內容可能與最新版本有所差異。詳細情況請與我們聯繫。
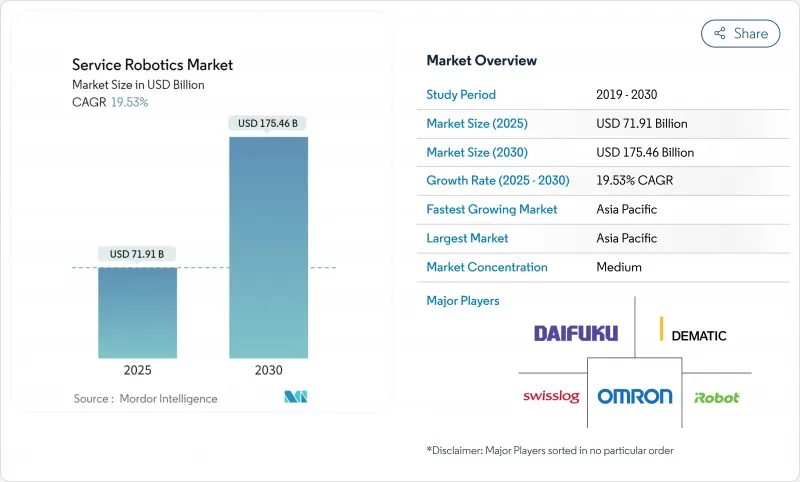
預計2025年服務機器人市場規模將達到719.1億美元,到2030年將擴大到1,754.6億美元,2025年至2030年的複合年成長率為19.53%。
新興經濟體勞動力供應緊張、機器人總擁有成本下降以及消除前期投資障礙的「機器人即服務」(RaaS)計畫的普及推動了這些發展。主要技術供應商的策略性收購標誌著自動化預算從可自由支配的轉向核心基礎設施支出,而協同工作監管的明確性正在加速從先導計畫到企業範圍推廣的轉變。輔助機器人和移動機器人專利數量的不斷成長,凸顯出即使在宏觀經濟不確定的情況下,創新週期也可能保持兩位數的成長。
全球服務機器人市場趨勢與洞察
醫療保健、物流和農業領域對自動化的需求不斷成長
受手術精度需求和更嚴格的感染控制通訊協定推動,預計 2024 年醫療機器人交付將增加 36%,達到約 6,100 台。物流業者正在加速部署微型倉配中心,預計到 2030 年全球安裝量將超過 6,600 個,創造 360 億美元的額外可用資金池。在農業領域,由於生產商努力應對長期勞動力短缺,預計到 2030 年手眼協作機器人將達到 3,590 萬台。隨著這三個產業推動投資報酬率,服務機器人市場正從成本抵銷轉向重塑營運模式的生產力平台。更廣泛的應用範圍也使收益來源多樣化,並降低了經濟波動的風險。跨部門交叉學習將進一步加速軟體重複使用和組件標準化,縮短開發週期並維持價格下降。
勞動力短缺和人口老化
預計到2040年,日本將面臨1,100萬勞動力短缺,而65歲及以上人口的比例將上升至40%。預計到2025年,歐洲醫療保健領域將面臨38萬的人員短缺,促使醫院測試輔助機器人和人工智慧分診系統。歐洲汽車產業的自動化普及率已達36%,而所有產業的自動化普及率僅為6%,這顯示其他產業仍有成長空間。因此,勞動力短缺支撐了服務機器人市場的結構性需求,因為企業追求的是韌性而非單純的成本削減。人口老化也正在擴大老年護理和復健領域的消費應用,從而擴大了市場的社會意義。這些人口現實超越了經濟週期,為投資者和供應商提供了長期視角。
高資本支出和維護成本
儘管硬體價格下降,但建築案例研究表明,儘管生產率提高了近三倍,但從純成本指標來看,機器人仍不如傳統方法。生命週期的不確定性,包括電池更換、感測器重新校準和軟體許可,使非專業人士的預算變得複雜。移動平檯面臨地圖繪製和定位的額外成本,特別是在雷射雷達和視覺 SLAM 基礎設施稀少的地方。缺乏多年的投資報酬率框架導致許多中小型企業採取保守的投資立場,減緩了在價格敏感地區的採用。雖然供應商透過標準化組件和捆綁預測性維護分析來應對,但對領先成本風險的普遍認知繼續阻礙服務機器人市場的發展。
細分分析
到2024年,專業服務機器人將佔據服務機器人市場的72%,並在物流、清潔和檢查等領域擁有成熟的投資報酬率。在這一細分市場中,醫療機器人預計將達到最高成長率,到2030年複合年成長率將達到23.4%,主要得益於醫院對微創手術和嚴格感染控制通訊協定的需求。醫療機器人將受益於保險報銷範圍的擴大以及越來越多的臨床證據表明機器人可以降低併發症率,從而縮短醫院的投資回收期。個人和家用機器人雖然體型較小,但仍將繼續被用於地板保養和陪伴等角色,這將進一步提升消費者對機器人技術的接受度。
輔助技術專利數量的不斷成長表明,醫療保健應用頻譜正在不斷拓寬,從復健外骨骼到人工智慧輔助診斷設備,不一而足。這些創新管道表明,一旦監管瓶頸得到緩解,醫療細分領域的服務機器人市場規模可能會超過整體市場規模。工業和臨床開發團隊之間的交叉整合也提高了組件的通用,有助於降低成本並提高供應商的利潤率。因此,醫療設備的部署正在從實驗性資產發展成為關鍵任務醫院基礎設施。
硬體仍將是主要的收益驅動力,到2024年將佔服務機器人市場規模的65.3%。感測器、致動器和電池佔據了材料清單,推動了大規模生產的大部分成本節約。然而,隨著雲端運行時環境、佇列編配層和AI推理引擎成為關鍵的差異化因素,預計到2030年,軟體的複合年成長率將達到22.1%。
這種轉變反映了企業IT的趨勢,即經常性授權費用超過了一次性硬體利潤。提供專有作業系統的供應商能夠獲得更穩定的收益,並收集數據以不斷改進其演算法。隨著整合複雜性的降低,買家正在根據軟體靈活性而非有效載荷容量來評估平台。在預測期內,RaaS、預測性維護和工作流程最佳化等服務預計將發展成為服務機器人市場的第三大價值支柱,與硬體和軟體形成互補。
區域分析
到2024年,北美將佔據全球服務機器人市場的34.5%,這得益於其成熟的自動化基礎設施、優惠的稅收優惠政策以及強勁的創業投資資金將達到64億美元。企業用戶正在從試點車隊轉向整棟大樓的部署,新的RaaS模式正在加速中型製造商的採用。監管機構正在明確協作機器人的安全要求,減少合規方面的模糊性,並鼓勵縮短採購週期。公共部門的需求也正在透過國防和基礎設施現代化項目逐漸形成,這些項目需要自主檢查能力。
預計亞太地區將實現最快的複合年成長率,達到19.6%。中國服務機器人產量預計在2024年年增18%,達到871萬台。政府推出政策,推動2025年53.3%的工業機器人國產化,為出口擴張提供了強大的國內市場平台。日本的服務機器人產業預計在2029年將成長兩倍,因為嚴重的勞動力短缺和文化認同推動了老年護理和旅館業的應用。韓國企業集團正在利用其在消費性電子產品領域的專業知識,開發低成本的國產機器人,將該地區定位為製造中心和需求中心。
歐洲擁有龐大的安裝基數,但由於嚴格的監管,成長正在放緩。 ISO 10218 和歐盟醫療設備法規的更新將增加合規支出,同時也將為歐洲供應商在出口市場樹立全球標竿。德國擁有 79% 的專業應用服務機器人供應商,預計到 2028 年將引領歐洲服務機器人的普及。該地區的競爭優勢在於其精密工程和功能安全專業知識,這使其能夠在受監管的行業中獲得高利潤。
其他福利:
- Excel 格式的市場預測 (ME) 表
- 3個月的分析師支持
目錄
第1章 引言
- 研究假設和市場定義
- 調查範圍
第2章調查方法
第3章執行摘要
第4章 市場狀況
- 市場概況
- 市場促進因素
- 醫療保健、物流和農業領域對自動化的需求不斷成長
- 勞動力短缺和人口老化加劇
- 人工智慧與感測器的快速整合降低了機器人TCO
- 機器人即服務 (RaaS) 訂閱推動中小企業採用
- 護理輔助機器人的養老保險報銷
- 暗店微型倉配熱潮需要 AMR
- 市場限制
- 資本投資和維護成本高
- 安全和網路安全合規的負擔
- 鋰電池運輸規則限制移動機器人
- 解決消費機器人Start-Ups的創投資金問題
- 價值/供應鏈分析
- 監管格局
- 技術展望
- 波特五力模型
- 供應商的議價能力
- 消費者議價能力
- 新進入者的威脅
- 競爭對手之間的競爭
- 替代品的威脅
第5章市場規模及成長預測
- 按應用領域
- 專業的
- 現場機器人
- 專業清潔
- 檢查和維護
- 建築和拆除
- 物流系統
- 醫療機器人
- 救援和安全
- 防禦機器人
- 水下系統
- 動力人類體外骨骼
- 公關機器人
- 個人/家庭
- 家用機器人
- 娛樂機器人
- 老年人和殘障人士支持
- 專業的
- 按組件
- 硬體
- 感應器
- 致動器
- 控制器和驅動器
- 電力系統
- 軟體
- 作業系統和中介軟體
- 人工智慧和分析演算法
- 服務(RaaS、整合、維護)
- 硬體
- 按運轉環境
- 地面以上
- 航空攝影/無人機
- 海洋/水下
- 行動性
- 移動/自主
- 固定型
- 按最終用戶產業
- 醫療保健和醫學
- 物流與倉儲
- 農業
- 建築和拆除
- 國防和安全
- 飯店和零售
- 教育和娛樂
- 按地區
- 北美洲
- 美國
- 加拿大
- 墨西哥
- 南美洲
- 巴西
- 阿根廷
- 南美洲其他地區
- 歐洲
- 德國
- 英國
- 法國
- 義大利
- 西班牙
- 俄羅斯
- 其他歐洲地區
- 亞太地區
- 中國
- 日本
- 韓國
- 印度
- 澳洲
- ASEAN
- 其他亞太地區
- 中東和非洲
- 中東
- 沙烏地阿拉伯
- 阿拉伯聯合大公國
- 土耳其
- 其他中東地區
- 非洲
- 南非
- 奈及利亞
- 肯亞
- 其他非洲國家
- 北美洲
第6章 競爭態勢
- 市場集中度
- 策略趨勢
- 市佔率分析
- 公司簡介
- iRobot Corporation
- Dematic Corp.
- Daifuku Co. Ltd.
- Swisslog Holding AG(KUKA)
- Omron Corporation
- SoftBank Robotics Group Corp.
- Pudu Robotics
- Boston Dynamics Inc.
- DJI Technology Co. Ltd.
- ABB Ltd.
- Seegrid Corporation
- Intuitive Surgical Inc.
- JBT Corporation
- SSI Schaefer AG
- Grenzebach GmbH
- Smith and Nephew plc
- Stryker Corporation
- Knightscope Inc.
- Kollmorgen Corporation
- Brokk AB
- Husqvarna AB
- Construction Robotics LLC
- Ecovacs Robotics
- Neato Robotics
- Transbotics Corporation
- Medtronic plc
- Northrop Grumman Corp.
- BAE Systems plc
- UBTECH Robotics Inc.
- SMP Robotics Systems
- Vision Robotics Corporation
- Naio Technologies SAS
第7章 市場機會與未來展望
The service robotics market size reached USD 71.91 billion in 2025 and is forecast to advance to USD 175.46 billion in 2030, reflecting a 19.53% CAGR during 2025-2030.
Growth is powered by tightening labor supply in developed economies, falling robot total cost of ownership, and wider availability of Robot-as-a-Service (RaaS) plans that eliminate up-front capital hurdles. Professional deployments in logistics, healthcare, and agriculture are scaling rapidly as AI-enabled perception modules lift precision and reliability benchmarks while shortening commissioning cycles.Strategic acquisitions by large technology vendors signal a transition from discretionary automation budgets to core infrastructure spending, and regulatory clarity around collaborative operation is accelerating the shift from pilot projects to enterprise-wide rollouts. A growing pipeline of patents in assistive and mobile robotics underscores an innovation cycle that is likely to sustain double-digit expansion even through macroeconomic volatility.
Global Service Robotics Market Trends and Insights
Growing Demand for Automation in Healthcare, Logistics & Agriculture
Medical robot deliveries rose 36% in 2024 to about 6,100 units on the back of surgical precision requirements and stricter infection-control protocols. Logistics operators accelerated micro-fulfillment centre rollouts, with global installations projected to top 6,600 by 2030, creating an incremental USD 36 billion addressable pool.In agriculture, hand-eye coordinated robots are forecast to reach 35.9 million units by 2030 as growers tackle chronic labour shortages. As these three verticals anchor return-on-investment cases, the service robotics market is shifting from cost offsetting toward productivity platforms that re-shape operating models. The breadth of applications also diversifies revenue exposure, insulating suppliers against cyclical swings. Cross-learning between sectors further accelerates software reuse and component standardisation, compressing development cycles and sustaining price declines.
Rising Labour Shortages & Ageing Population
Japan anticipates an 11 million worker gap by 2040 while its over-65 cohort climbs toward 40% of the population. European healthcare faces a projected 380,000 staffing shortfall by 2025, prompting hospitals to pilot care-support robots and AI triage systems. Automation penetration stands at 36% in Europe's automotive sector versus 6% across all industries, illuminating the headroom for other verticals. Labour scarcity, therefore, underpins structural demand for the service robotics market as companies pursue resilience rather than pure cost savings. Population ageing also expands consumer-facing applications in eldercare and rehabilitation, widening the market's societal relevance. These demographic realities stretch beyond economic cycles, providing long-run visibility for investors and vendors alike.
High CAPEX & Maintenance Costs
Despite declining hardware prices, construction case studies show robots can trail conventional methods on pure cost metrics even while delivering nearly threefold productivity gains. Lifecycle uncertainties around battery replacement, sensor recalibration, and software licensing complicate budgeting for non-specialists. Mobile platforms face additional expenses for mapping and localisation, particularly where LiDAR or visual SLAM infrastructure is sparse. Many SMEs lack multi-year ROI frameworks, leading to conservative investment postures that slow penetration in price-sensitive regions. Vendors are countering by standardising components and bundling predictive-maintenance analytics, but widespread perception of upfront cost risk remains a drag on the service robotics market.
Other drivers and restraints analyzed in the detailed report include:
- Rapid AI-Sensor Convergence Lowers Robot TCO
- Robot-as-a-Service Subscriptions Unlock SME Adoption
- Safety-Cybersecurity Compliance Burden
For complete list of drivers and restraints, kindly check the Table Of Contents.
Segment Analysis
Professional service robots controlled 72% of the service robotics market in 2024, anchored by proven ROI in logistics, cleaning, and inspection assignments. Within this cohort, medical robots are set to capture the highest growth at a 23.4% CAGR to 2030, buoyed by hospital demand for minimally invasive surgery and stringent infection-control protocols. The segment benefits from expanding insurance reimbursements and growing clinical evidence that robots reduce complication rates, which collectively shortens hospital payback periods. Personal and domestic units, while smaller, continue to find adoption in floor-care and companionship roles that prime consumer familiarity with robotics.
Growing patent volumes in assistive technologies point to a widening spectrum of healthcare applications, from rehabilitation exoskeletons to AI-enabled diagnostic aides. This innovation pipeline suggests that the service robotics market size for medical subsegments could outpace the broader aggregate once regulatory bottlenecks ease. Cross-pollination between industrial and clinical development teams is also raising component commonality, helping lower costs and lifting vendor margins. Consequently, medical deployments are evolving from experimental assets into mission-critical hospital infrastructure
Hardware remained the revenue backbone with a 65.3% share of the service robotics market size in 2024. Sensors, actuators, and batteries dominate the bill of materials and still account for most cost reductions achieved via scale manufacturing. Yet, software is projected to surge at a 22.1% CAGR through 2030 as cloud runtime environments, fleet-orchestration layers, and AI inference engines become primary differentiators.
The shift mirrors enterprise IT trends where recurring licences eclipse one-time hardware margins. Vendors offering proprietary operating systems unlock stickier revenue and gather data to refine algorithms continuously. As integration complexities shrink, buyers increasingly evaluate platforms on software flexibility rather than payload capacity. Over the forecast horizon, services such as RaaS, predictive maintenance, and workflow optimisation are expected to evolve into a third value pillar that complements hardware and software in the service robotics market.
The Service Robotics Market is Segmented by Field of Application (Professional, Personal/Domestic), Component (Hardware, Software, and More), Operating Environment (Ground, Aerial / UAV, and More), Mobility (Mobile / Autonomous, Stationary / Fixed-Base), End-User Industry (Healthcare and Medical, Logistics and Warehousing, and More), and by Geography. The Market Forecasts are Provided in Terms of Value (USD).
Geography Analysis
North America held 34.5% of the global service robotics market in 2024, underpinned by mature automation infrastructure, favourable tax incentives, and robust venture funding that hit USD 6.4 billion in 2024. Enterprise users are migrating from pilot fleets to building-wide rollouts, and new RaaS models are accelerating penetration among mid-sized manufacturers. Regulatory agencies have clarified collaborative-robot safety expectations, reducing compliance ambiguity and encouraging faster procurement cycles. Public-sector demand is also materialising through defence and infrastructure modernisation initiatives that require autonomous inspection capabilities.
Asia-Pacific is projected to record the fastest 19.6% CAGR, led by China's production of 8.71 million service robots in 2024, an 18% year-on-year increase. Government policies promoting 53.3% localisation of industrial robots by 2025 provide a strong home-market platform for export expansion. Japan's service robotics industry is on course to triple by 2029 as acute labour shortages and cultural acceptance drive adoption across eldercare and hospitality. South Korean conglomerates are funneling consumer electronics expertise into low-cost domestic robots, positioning the region as both a manufacturing hub and a demand centre.
Europe accounts for a sizeable installed base but grows at a steadier pace given stringent regulatory regimes. The updated ISO 10218 and EU Medical Device Regulation increase compliance spending, yet they also set global benchmarks that European vendors leverage in export markets. Germany hosts 79% of its service-robot suppliers in professional applications and is projected to lead European service-robotics adoption by 2028. The region's competitive edge lies in high-precision engineering and functional-safety know-how, which fetches premium margins in regulated industries.
- iRobot Corporation
- Dematic Corp.
- Daifuku Co. Ltd.
- Swisslog Holding AG (KUKA)
- Omron Corporation
- SoftBank Robotics Group Corp.
- Pudu Robotics
- Boston Dynamics Inc.
- DJI Technology Co. Ltd.
- ABB Ltd.
- Seegrid Corporation
- Intuitive Surgical Inc.
- JBT Corporation
- SSI Schaefer AG
- Grenzebach GmbH
- Smith and Nephew plc
- Stryker Corporation
- Knightscope Inc.
- Kollmorgen Corporation
- Brokk AB
- Husqvarna AB
- Construction Robotics LLC
- Ecovacs Robotics
- Neato Robotics
- Transbotics Corporation
- Medtronic plc
- Northrop Grumman Corp.
- BAE Systems plc
- UBTECH Robotics Inc.
- SMP Robotics Systems
- Vision Robotics Corporation
- Naio Technologies SAS
Additional Benefits:
- The market estimate (ME) sheet in Excel format
- 3 months of analyst support
TABLE OF CONTENTS
1 INTRODUCTION
- 1.1 Study Assumptions and Market Definition
- 1.2 Scope of the Study
2 RESEARCH METHODOLOGY
3 EXECUTIVE SUMMARY
4 MARKET LANDSCAPE
- 4.1 Market Overview
- 4.2 Market Drivers
- 4.2.1 Growing demand for automation in healthcare, logistics and agriculture
- 4.2.2 Rising labour shortages and ageing population
- 4.2.3 Rapid AI-sensor convergence lowers robot TCO
- 4.2.4 Robot-as-a-Service (RaaS) subscriptions unlock SME adoption
- 4.2.5 Eldercare insurance reimbursements for assistive robots
- 4.2.6 Dark-store micro-fulfilment boom needs AMRs
- 4.3 Market Restraints
- 4.3.1 High CAPEX and maintenance costs
- 4.3.2 Safety-cybersecurity compliance burden
- 4.3.3 Lithium-battery shipping rules limit mobile robots
- 4.3.4 VC funding correction for consumer-robotics start-ups
- 4.4 Value / Supply-Chain Analysis
- 4.5 Regulatory Landscape
- 4.6 Technological Outlook
- 4.7 Porter's Five Forces
- 4.7.1 Bargaining Power of Suppliers
- 4.7.2 Bargaining Power of Consumers
- 4.7.3 Threat of New Entrants
- 4.7.4 Intensity of Competitive Rivalry
- 4.7.5 Threat of Substitutes
5 MARKET SIZE AND GROWTH FORECASTS (VALUE)
- 5.1 By Field of Application
- 5.1.1 Professional
- 5.1.1.1 Field Robots
- 5.1.1.2 Professional Cleaning
- 5.1.1.3 Inspection and Maintenance
- 5.1.1.4 Construction and Demolition
- 5.1.1.5 Logistics Systems
- 5.1.1.6 Medical Robots
- 5.1.1.7 Rescue and Security
- 5.1.1.8 Defense Robots
- 5.1.1.9 Underwater Systems
- 5.1.1.10 Powered Human Exoskeletons
- 5.1.1.11 Public-Relation Robots
- 5.1.2 Personal / Domestic
- 5.1.2.1 Domestic Task Robots
- 5.1.2.2 Entertainment Robots
- 5.1.2.3 Elderly and Handicap Assistance
- 5.1.1 Professional
- 5.2 By Component
- 5.2.1 Hardware
- 5.2.1.1 Sensors
- 5.2.1.2 Actuators
- 5.2.1.3 Controllers and Drives
- 5.2.1.4 Power Systems
- 5.2.2 Software
- 5.2.2.1 Operating Systems and Middleware
- 5.2.2.2 AI and Analytics Algorithms
- 5.2.3 Services (RaaS, Integration, Maintenance)
- 5.2.1 Hardware
- 5.3 By Operating Environment
- 5.3.1 Ground
- 5.3.2 Aerial / UAV
- 5.3.3 Marine / Underwater
- 5.4 By Mobility
- 5.4.1 Mobile / Autonomous
- 5.4.2 Stationary / Fixed-Base
- 5.5 By End-user Industry
- 5.5.1 Healthcare and Medical
- 5.5.2 Logistics and Warehousing
- 5.5.3 Agriculture
- 5.5.4 Construction and Demolition
- 5.5.5 Defense and Security
- 5.5.6 Hospitality and Retail
- 5.5.7 Education and Entertainment
- 5.6 By Geography
- 5.6.1 North America
- 5.6.1.1 United States
- 5.6.1.2 Canada
- 5.6.1.3 Mexico
- 5.6.2 South America
- 5.6.2.1 Brazil
- 5.6.2.2 Argentina
- 5.6.2.3 Rest of South America
- 5.6.3 Europe
- 5.6.3.1 Germany
- 5.6.3.2 United Kingdom
- 5.6.3.3 France
- 5.6.3.4 Italy
- 5.6.3.5 Spain
- 5.6.3.6 Russia
- 5.6.3.7 Rest of Europe
- 5.6.4 APAC
- 5.6.4.1 China
- 5.6.4.2 Japan
- 5.6.4.3 South Korea
- 5.6.4.4 India
- 5.6.4.5 Australia
- 5.6.4.6 ASEAN
- 5.6.4.7 Rest of APAC
- 5.6.5 Middle East and Africa
- 5.6.5.1 Middle East
- 5.6.5.1.1 Saudi Arabia
- 5.6.5.1.2 UAE
- 5.6.5.1.3 Turkey
- 5.6.5.1.4 Rest of Middle East
- 5.6.5.2 Africa
- 5.6.5.2.1 South Africa
- 5.6.5.2.2 Nigeria
- 5.6.5.2.3 Kenya
- 5.6.5.2.4 Rest of Africa
- 5.6.1 North America
6 COMPETITIVE LANDSCAPE
- 6.1 Market Concentration
- 6.2 Strategic Moves
- 6.3 Market Share Analysis
- 6.4 Company Profiles (includes Global level Overview, Market level overview, Core Segments, Financials as available, Strategic Information, Market Rank/Share, Products and Services, Recent Developments)
- 6.4.1 iRobot Corporation
- 6.4.2 Dematic Corp.
- 6.4.3 Daifuku Co. Ltd.
- 6.4.4 Swisslog Holding AG (KUKA)
- 6.4.5 Omron Corporation
- 6.4.6 SoftBank Robotics Group Corp.
- 6.4.7 Pudu Robotics
- 6.4.8 Boston Dynamics Inc.
- 6.4.9 DJI Technology Co. Ltd.
- 6.4.10 ABB Ltd.
- 6.4.11 Seegrid Corporation
- 6.4.12 Intuitive Surgical Inc.
- 6.4.13 JBT Corporation
- 6.4.14 SSI Schaefer AG
- 6.4.15 Grenzebach GmbH
- 6.4.16 Smith and Nephew plc
- 6.4.17 Stryker Corporation
- 6.4.18 Knightscope Inc.
- 6.4.19 Kollmorgen Corporation
- 6.4.20 Brokk AB
- 6.4.21 Husqvarna AB
- 6.4.22 Construction Robotics LLC
- 6.4.23 Ecovacs Robotics
- 6.4.24 Neato Robotics
- 6.4.25 Transbotics Corporation
- 6.4.26 Medtronic plc
- 6.4.27 Northrop Grumman Corp.
- 6.4.28 BAE Systems plc
- 6.4.29 UBTECH Robotics Inc.
- 6.4.30 SMP Robotics Systems
- 6.4.31 Vision Robotics Corporation
- 6.4.32 Naio Technologies SAS
7 MARKET OPPORTUNITIES AND FUTURE OUTLOOK
- 7.1 White-space and Unmet-need Assessment
 服務機器人市場:按產品類型、組件類型、運輸方式和最終用戶分類 - 全球市場預測 2026–2032
 2026年航太服務機器人市場報告
 全球服務機器人市場規模、佔有率、趨勢和成長分析報告(2026-2034年)
 服務機器人市場分析及預測(至2035年):類型、產品類型、服務、技術、組件、應用、形式、部署形式、最終用戶、功能2026年全球服務機器人市場報告購物指南機器人市場:依產品類型、支付方式、經營模式、通路和最終用戶分類-2026-2032年全球預測公共間機器人市場:按機器人類型、清潔技術、運作模式、通路、應用程式和終端用戶產業分類,全球預測(2026-2032年)
 東南亞工業與服務機器人:市場佔有率分析、產業趨勢與統計、成長預測(2026-2031)全球專業服務機器人市場規模、佔有率、趨勢和成長分析報告(2026-2034年)
 個人服務機器人市場-全球產業規模、佔有率、趨勢、機會、預測:按組件、應用、地區和競爭對手分類,2021-2031年