


 |
市場調查報告書
商品編碼
1849918
模組化UPS:市場佔有率分析、行業趨勢、統計數據和成長預測(2025-2030年)Modular UPS - Market Share Analysis, Industry Trends & Statistics, Growth Forecasts (2025 - 2030) |
||||||
※ 本網頁內容可能與最新版本有所差異。詳細情況請與我們聯繫。
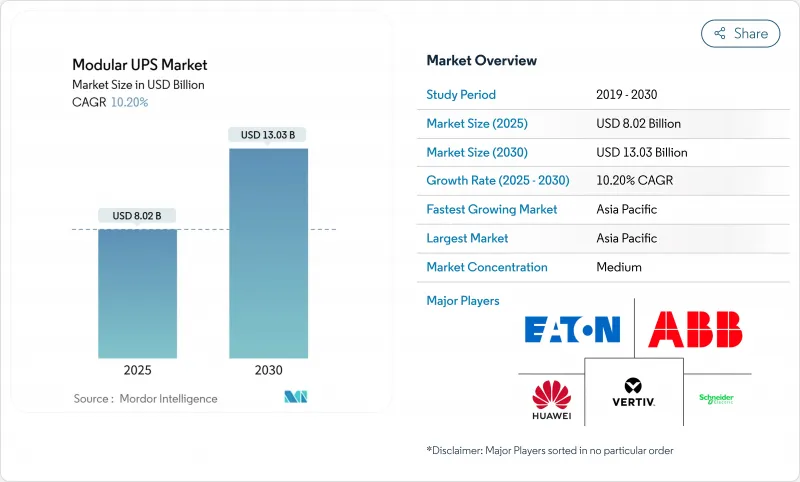
預計到 2025 年,模組化 UPS 市場規模將達到 80.2 億美元,到 2030 年將達到 130.3 億美元,在預測期(2025-2030 年)內,複合年成長率將達到 10.20%。
資料中心的快速建置、邊緣運算的部署以及嚴格的執行時間要求將持續推動強勁的需求,而鋰離子電池和併網互動設計將使系統功能超越備用電源。以 50 kW 為單位進行擴充可減少閒置容量並加快部署速度。在監管機構在 2024 年發現了超過 20,000 個存在漏洞的 UPS 監控單元後,供應商也透過增強網路安全來提升自身競爭力。亞太地區是規模最大且成長最快的地區,中國、印度和日本正以創紀錄的速度建造兆瓦級園區。
全球模組化UPS市場趨勢與洞察
超大規模、託管和雲端資料中心的成長
超大規模營運商計劃在2024年全球整體新增5000兆瓦的容量,這將推動對可擴展電源模組前所未有的需求,以滿足分階段建設的需求。人工智慧訓練集群將使機架功耗從10千瓦增加到40千瓦,迫使設計人員部署可在數週內擴展的模組化電源組串,而不是耗時12-18個月的整體式維修。伊頓和西門子能源的合作凸顯了這種迫切性。他們標準化的500兆瓦現場解決方案聲稱可將資料中心建設時間縮短兩年,這凸顯了業主為何現在將電力架構視為一項競爭優勢。此外,採購團隊更傾向於選擇可安裝在預製電氣撬裝平台上的模組化UPS產品,從而簡化審核和試運行。
模組化架構,降低整體擁有成本並提高可擴展性
生命週期研究表明,合理配置容量可減少30-40%的過剩容量,從而抵消比整體式機架高出15-25%的價格溢價。熱插拔模組可將平均維修時間從數小時縮短至數分鐘,提高服務等級協定 (SLA) 的合規性,並減少對託管服務提供者的罰款。財務長們更傾向於計量收費模式,因為這種模式允許他們將資金投入推遲到實際利用率得到驗證之後,這在高利率環境下至關重要。模組化UPS市場也受惠於供應商融資經營租賃模式的日益普及,這種模式將資本支出轉化為營運支出,並有助於預算核准。
東南亞和拉丁美洲對價格敏感的買家仍然傾向於選擇整體式機櫃,因為其購買成本比模組化UPS每千瓦時低15%至25%。即使生命週期分析結果顯示模組化UPS具有優勢,但優先選擇最低競標的採購政策仍然阻礙了模組化UPS的普及。供應商正在推出基於使用量的融資方案,讓客戶以類似雲端收費的訂閱模式添加模組。儘管如此,這種溢價仍是一個顯著的阻礙因素,短期內將使模組化UPS市場成長減少1.2個百分點。
細分市場分析
儘管51-100 kVA的UPS產品佔2024年總收入的41%,但500 kVA以上的UPS產品成長最快,複合年成長率達14%。這款高階產品可容納40 kW的AI機架,目前託管服務供應商普遍採用配備熱插拔模組的2 MW機房,以保持彈性。到2030年,該細分市場的模組化UPS規模將達到37億美元。營運商將模組級冗餘和鋰離子電池相容性列為關鍵選擇標準。 101-500 kVA等級的UPS產品對於企業資料中心至關重要,因為企業資料中心優先考慮成本和未來擴充性之間的平衡。而50 kVA以下的細分市場則主要面向電信機房和智慧工廠生產線,在這些場所,壁掛式安裝至關重要。
寬能能隙半導體技術的進步已將轉換效率提升至98%以上,從而在不增加冷卻設備規模的情況下實現更高的熱密度。菲尼克斯電氣的QUINT HP展示了由UPS IQ韌體監控的五個熱插拔電池組。至2030年,隨著區域邊緣核心設施整合為10MW園區,301-500kVA級UPS的出貨量將超過101-300kVA等級。這種均衡的需求曲線支撐了模組化UPS市場抵禦景氣衰退的能力。
資料中心反映了超大規模和託管資料中心的規模擴張,在2024年佔支出的48%。工業廠房的複合年成長率達到12.5%,這得益於工業4.0投資為機器人生產線和晶圓廠增加了電力品質保證。模組化UPS在製造業的市佔率從2024年到2025年成長了210個基點。半導體工廠由於需要滿足亞毫秒的故障復原要求,將UPS容量視為產量比率保障,因此購買了冗餘的N+2組UPS,每組UPS可獨立運作20分鐘。隨著5G網路密集化,數千個微型資料中心迅速擴展,電信業者紛紛訂購了10kVA的壁掛式UPS模組。
商業建築和銀行、金融服務和保險機構也紛紛效仿,這主要是受到數位銀行服務等級協議(SLA)的推動,該協議對停機時間處以懲罰。政府機構正在指定採用微電網設計以滿足彈性要求,這一趨勢在國防部2024年統一設施控制(UFC)指南中有所闡述。醫療機構則重視熱插拔電池,將其應用於感染控制區域,因為在這些區域頻繁維護並不現實。
模組化UPS市場按功率容量(小於50KVA、51-100KVA、101-300KVA及其他)、終端用戶產業(資料中心、工業製造及其他)、相型(單相和三相)、組件(解決方案和服務)以及地區進行細分。市場預測以美元(USD)計價。
區域分析
亞太地區將引領整個產業,預計2024年營收成長將達到36%,到2030年將維持11.2%的年複合成長率,遙遙領先。中國在解除區域電網建設限制後加快了資料中心核准速度,而印度的數位公共基礎設施計畫則推動了孟買、海得拉巴和欽奈周邊地區超大規模資料中心的建設。日本半導體產業的復甦正為新建工廠注入數十億美元資金,這些工廠指定使用500kVA以上的鋰離子UPS串聯電源來降低建築負載。深圳和清奈的在地化電力電子製造縮短了前置作業時間,在全球零件短缺的情況下提供了關鍵優勢。因此,預計到2030年,亞太地區模組化UPS市場規模將超過50億美元。
北美位居第二,這主要得益於北維吉尼亞、達拉斯和鳳凰城等地成熟的超大規模園區。 PJM 和 ERCOT 的公共產業正積極購買頻率調節服務,並鼓勵部署電網互動式系統,以實現閒置電池資產的商業價值。美國國防部強制要求在關鍵任務基地使用微電網相容型 UPS,從而推動了對具備黑啟動功能的堅固耐用型 NEMA機殼UPS 的需求。加拿大提出的 Tier 2 能源效率標準將進一步促進無變壓器、高效率設計的應用。
在歐洲,碳中和目標和不斷上漲的電費正促使企業更加重視99%高效節能的生態模式。英國正在加強永續性評級,德國聯邦金融監理局(BaFin)則在監管金融服務供應商的資料中心彈性。兩國營運商都在積極採用動態容量調整技術,根據IT負載自動開啟或關閉模組,從而減少年度能源浪費。由於可再生能源的豐富供應,託管服務在法國和北歐地區蓬勃發展。該地區也是鋰離子電池和鈉離子電池試點計畫的所在地,例如Natron Energy計劃在北卡羅來納州建造的超級工廠,該工廠的產品將於2026年向歐盟供貨。
其他福利:
- Excel格式的市場預測(ME)表
- 3個月的分析師支持
目錄
第1章 引言
- 研究假設和市場定義
- 調查範圍
第2章調查方法
第3章執行摘要
第4章 市場情勢
- 市場概覽
- 市場促進因素
- 超大規模、託管和雲端資料中心的成長
- 模組化架構降低了整體擁有成本並擴充性
- 快速部署邊緣和 5G 微型資料中心
- 強制性綠色認證促進高效UPS的發展
- 電網互動式UPS用於輔助收入來源
- 適用於關鍵基礎設施的微電網就緒設計
- 市場限制
- 與整體式系統相比,初始投資更高。
- 在IT產業之外,認可度較低
- 電力電子供應鏈的不穩定性
- 網路UPS中的網路安全風險
- 產業價值鏈分析
- 監管環境
- 技術展望
- 產業吸引力-波特五力分析
- 供應商的議價能力
- 買方/消費者的議價能力
- 新進入者的威脅
- 替代品的威脅
- 競爭對手之間的競爭
- 影響市場的宏觀經濟因素
第5章 市場規模與成長預測
- 按功率容量
- 50千伏安或以下
- 51~100kVA
- 101~300kVA
- 301~500kVA
- 500千伏安或以上
- 按最終用戶行業分類
- 資料中心
- 工業製造
- 通訊
- 商業建築
- BFSI
- 政府和公共基礎設施
- 衛生保健
- 其他終端用戶產業
- 依相位類型
- 單相
- 三相
- 按組件
- 解決方案(硬體)
- 服務
- 按地區
- 北美洲
- 美國
- 加拿大
- 墨西哥
- 南美洲
- 巴西
- 阿根廷
- 智利
- 其他南美洲
- 歐洲
- 英國
- 德國
- 法國
- 義大利
- 西班牙
- 俄羅斯
- 其他歐洲地區
- 亞太地區
- 中國
- 日本
- 印度
- 韓國
- 澳洲
- 馬來西亞
- 新加坡
- 亞太其他地區
- 中東和非洲
- 中東
- 沙烏地阿拉伯
- 阿拉伯聯合大公國
- 土耳其
- 其他中東地區
- 非洲
- 南非
- 奈及利亞
- 其他非洲地區
- 北美洲
第6章 競爭情勢
- 市場集中度
- 策略趨勢
- 市佔率分析
- 公司簡介
- Schneider Electric SE
- Vertiv Holdings Co.
- Eaton Corporation plc
- ABB Ltd.
- Huawei Technologies Co. Ltd.
- Delta Electronics Inc.
- Riello UPS(Riello Elettronica)
- AEG Power Solutions
- Socomec Group
- Borri SpA
- Kehua Data Co., Ltd.
- KSTAR Science and Technology
- CyberPower Systems, Inc.
- Tripp Lite(by Eaton)
- Gamatronic(SolarEdge)
- Salicru SA
- Piller Power Systems
- Centiel SA
- Hitec Power Protection
- Statron AG
- PowerShield Ltd.
- Fuji Electric Co., Ltd.
- Mitsubishi Electric Corp.
- Toshiba ESS
- Shenzhen Zhicheng Champion Co., Ltd.
- Zhongheng Electric(China UPS)
第7章 投資分析
第8章:市場機會與未來趨勢
- 閒置頻段與未滿足需求評估
The Modular UPS Market size is estimated at USD 8.02 billion in 2025, and is expected to reach USD 13.03 billion by 2030, at a CAGR of 10.20% during the forecast period (2025-2030).
Rapid data-center construction, edge-computing rollouts, and stringent uptime requirements keep demand strong, while lithium-ion batteries and grid-interactive designs expand system functionality beyond standby power. Scaling in 50 kW building blocks reduces stranded capacity and speeds deployment, a decisive advantage as AI workloads lift rack densities. Vendors also differentiate through cybersecurity hardening after regulators highlighted more than 20,000 vulnerable UPS monitoring devices in 2024. Asia-Pacific commands the largest regional footprint and grows fastest as China, India, and Japan commission multi-megawatt campuses at a record pace.
Global Modular UPS Market Trends and Insights
Growth of Hyperscale, Colocation and Cloud Data Centers
Hyperscale operators plan to add 5,000 MW of global capacity in 2024, driving unprecedented demand for scalable power blocks that align with phased build schedules. AI training clusters raise rack power draw from 10 kW to 40 kW, compelling designers to deploy modular strings that can be expanded in weeks rather than the 12-18-month cycle of monolithic retrofits. Collaboration between Eaton and Siemens Energy underscores the urgency; their standardized 500 MW onsite solution claims to trim data-center construction time by two years and underscores why owners now view power architecture as a competitive lever. Procurement teams further prefer modular UPS market products because they fit inside prefabricated electrical skids, streamlining permitting and commissioning. Together, these forces add an estimated 3.2 percentage points to the overall CAGR through 2030.
Lower TCO and Scalability of Modular Architecture
Lifecycle studies indicate that right-sizing cuts stranded capacity by 30-40%, offsetting the 15-25% price premium versus monolithic frames. Hot-swappable modules slash mean-time-to-repair from hours to minutes, which improves SLA compliance and lowers penalty payments for colocation providers. CFOs favor the pay-as-you-grow model because it defers capital until utilization proves out, a vital hedge in high-interest environments. The modular UPS market also benefits from rising adoption of vendor-financed operating leases that convert capex to opex, easing budget approvals. Collectively, incremental scalability contributes 2.4 percentage points to forecast growth.
High Up-Front Capex Versus Monolithic Systems
Price-sensitive buyers in Southeast Asia and Latin America still favor monolithic cabinets that cost 15-25% less per kilowatt at acquisition. Even though lifecycle analyses prove favorable, procurement policies prioritized around the lowest bid continue to delay adoption. Vendors respond with usage-based financing, allowing clients to add modules under subscription models that mimic cloud billing. Nonetheless, the premium remains a meaningful drag, subtracting 1.2 percentage points from modular UPS market expansion over the near term.
Other drivers and restraints analyzed in the detailed report include:
- Rapid Deployment for Edge and 5 G Micro-Data Centers
- Green-Certification Mandates Driving High-Efficiency UPS
- Cyber-Security Risks in Networked UPS
For complete list of drivers and restraints, kindly check the Table Of Contents.
Segment Analysis
The >500 kVA class generated the fastest growth at 14% CAGR, despite 51-100 kVA units holding 41% of 2024 revenue. This upper tier addresses AI racks drawing 40 kW each, and colocation providers now standardize on 2 MW power rooms filled with hot-plug bricks to maintain flexibility. The modular UPS market size for this slice will reach USD 3.7 billion by 2030. Operators cite module-level redundancy and lithium-ion compatibility as primary selection criteria. The 101-500 kVA tiers remain vital for corporate data halls that balance cost with future expansion. The <=50 kVA niche serves telecom shelters and smart-factory lines where wall-mount footprints matter.
Advancements in wide-band-gap semiconductors lift conversion efficiency above 98%, allowing heat-density gains without oversizing cooling plants. Phoenix Contact's QUINT HP demonstrates five hot-swappable battery strings monitored by UPS IQ firmware that predicts remaining life to within 3% accuracy. By 2030, shipments in the 301-500 kVA cohort will overtake the 101-300 kVA class as regional edge-core facilities aggregate into 10 MW campuses. This balanced demand curve underpins the modular UPS market's resilience against cyclical spending dips.
Data centers accounted for 48% of 2024 spending, reflecting hyperscale and colocation scale-out. Industrial plants post 12.5% CAGR as Industry 4.0 investments attach power-quality guarantees to robotics lines and wafer fabs. The modular UPS market share within manufacturing rose 210 basis points between 2024 and 2025. Semiconductor fabs, subject to sub-millisecond ride-through requirements, purchase redundant N+2 strings with 20-minute autonomy, treating UPS capacity as yield insurance. Telecom expanded after 5 G densification triggered thousands of micro data hubs, each ordering 10 kVA wall-mount modules.
Commercial buildings and BFSI follow, driven by digital-banking SLAs that penalize downtime. Government adopters specify microgrid-ready designs to meet resiliency mandates, a trend codified in the 2024 DoD UFC guideline. Healthcare facilities value hot-swap batteries for infection-control zones where frequent maintenance visits are impractical. This broadening end-user base shields the modular UPS market from over-reliance on data centers alone.
Modular UPS Market is Segmented by Power Capacity (<= 50 KVA, 51 - 100 KVA, 101 - 300 KVA, and More), End User Industry ( Data Centers, Industrial Manufacturing, and More), Phase Type (Single-Phase and Three-Phase), Component (Solutions and Services), and Geography. The Market Forecasts are Provided in Terms of Value (USD).
Geography Analysis
Asia-Pacific led the sector with 36% revenue in 2024, and its 11.2% CAGR through 2030 remains unmatched. China accelerated data-center approvals after lifting regional power-grid moratoriums, while India's Digital Public Infrastructure program triggered hyperscale builds around Mumbai, Hyderabad, and Chennai. Japan's semiconductor revival funnels billions into new fabs that specify lithium-ion UPS strings above 500 kVA to cut floor-loading. Local manufacturing of power electronics in Shenzhen and Suzhou reduces lead times, a decisive edge during global component shortages. As a result, the modular UPS market in Asia-Pacific will eclipse USD 5 billion by 2030.
North America ranks second on the back of mature hyperscale campuses in Northern Virginia, Dallas, and Phoenix. Utilities across PJM and ERCOT actively procure frequency-regulation services, encouraging grid-interactive deployments that monetize idle battery assets. The Department of Defense mandates microgrid-compatible UPS for mission-critical bases, elevating demand for ruggedized NEMA enclosures capable of black-start functionality. Canada's proposed Tier 2 energy-efficiency standard further nudges adoption of transformer-less, high-efficiency designs.
Europe follows, propelled by carbon-neutrality targets and rising electricity costs that sharpen the ROI of 99%-efficient eco-modes. The United Kingdom tightens sustainability assessments, and Germany's BaFin regulates data-center resilience for financial services providers. Operators in both nations incorporate dynamic capacity right-sizing that ramps modules on or off to match IT load, cutting annual energy waste. France and the Nordics see brisk colocation growth backed by renewable-energy availability, setting the stage for lithium-ion and sodium-ion battery pilots such as Natron Energy's planned gigafactory in North Carolina, which will ship into the EU by 2026.
- Schneider Electric SE
- Vertiv Holdings Co.
- Eaton Corporation plc
- ABB Ltd.
- Huawei Technologies Co. Ltd.
- Delta Electronics Inc.
- Riello UPS (Riello Elettronica)
- AEG Power Solutions
- Socomec Group
- Borri S.p.A.
- Kehua Data Co., Ltd.
- KSTAR Science and Technology
- CyberPower Systems, Inc.
- Tripp Lite (by Eaton)
- Gamatronic (SolarEdge)
- Salicru S.A.
- Piller Power Systems
- Centiel SA
- Hitec Power Protection
- Statron AG
- PowerShield Ltd.
- Fuji Electric Co., Ltd.
- Mitsubishi Electric Corp.
- Toshiba ESS
- Shenzhen Zhicheng Champion Co., Ltd.
- Zhongheng Electric (China UPS)
Additional Benefits:
- The market estimate (ME) sheet in Excel format
- 3 months of analyst support
TABLE OF CONTENTS
1 INTRODUCTION
- 1.1 Study Assumptions and Market Definition
- 1.2 Scope of the Study
2 RESEARCH METHODOLOGY
3 EXECUTIVE SUMMARY
4 MARKET LANDSCAPE
- 4.1 Market Overview
- 4.2 Market Drivers
- 4.2.1 Growth of Hyperscale, Colocation and Cloud Data Centers
- 4.2.2 Lower TCO and Scalability of Modular Architecture
- 4.2.3 Rapid Deployment for Edge and 5G Micro-Data Centers
- 4.2.4 Green-Certification Mandates Driving High-Efficiency UPS
- 4.2.5 Grid-Interactive UPS for Ancillary Revenue Streams
- 4.2.6 Microgrid-Ready Designs for Critical Infrastructure
- 4.3 Market Restraints
- 4.3.1 High Up-Front Capex Versus Monolithic Systems
- 4.3.2 Limited Awareness Outside IT Verticals
- 4.3.3 Power-Electronics Supply-Chain Volatility
- 4.3.4 Cyber-Security Risks in Networked UPS
- 4.4 Industry Value Chain Analysis
- 4.5 Regulatory Landscape
- 4.6 Technological Outlook
- 4.7 Industry Attractiveness - Porter's Five Forces Analysis
- 4.7.1 Bargaining Power of Suppliers
- 4.7.2 Bargaining Power of Buyers/Consumers
- 4.7.3 Threat of New Entrants
- 4.7.4 Threat of Substitute Products
- 4.7.5 Intensity of Competitive Rivalry
- 4.8 Impact of Macroeconomic Factors on the Market
5 MARKET SIZE AND GROWTH FORECASTS (VALUE)
- 5.1 By Power Capacity
- 5.1.1 <= 50 kVA
- 5.1.2 51 - 100 kVA
- 5.1.3 101 - 300 kVA
- 5.1.4 301 - 500 kVA
- 5.1.5 > 500 kVA
- 5.2 By End User Industry
- 5.2.1 Data Centers
- 5.2.2 Industrial Manufacturing
- 5.2.3 Telecommunications
- 5.2.4 Commercial Buildings
- 5.2.5 BFSI
- 5.2.6 Government and Public Infrastructure
- 5.2.7 Healthcare
- 5.2.8 Other End User Industries
- 5.3 By Phase Type
- 5.3.1 Single-Phase
- 5.3.2 Three-Phase
- 5.4 By Component
- 5.4.1 Solutions (Hardware)
- 5.4.2 Services
- 5.5 By Geography
- 5.5.1 North America
- 5.5.1.1 United States
- 5.5.1.2 Canada
- 5.5.1.3 Mexico
- 5.5.2 South America
- 5.5.2.1 Brazil
- 5.5.2.2 Argentina
- 5.5.2.3 Chile
- 5.5.2.4 Rest of South America
- 5.5.3 Europe
- 5.5.3.1 United Kingdom
- 5.5.3.2 Germany
- 5.5.3.3 France
- 5.5.3.4 Italy
- 5.5.3.5 Spain
- 5.5.3.6 Russia
- 5.5.3.7 Rest of Europe
- 5.5.4 Asia-Pacific
- 5.5.4.1 China
- 5.5.4.2 Japan
- 5.5.4.3 India
- 5.5.4.4 South Korea
- 5.5.4.5 Australia
- 5.5.4.6 Malaysia
- 5.5.4.7 Singapore
- 5.5.4.8 Rest of Asia-Pacific
- 5.5.5 Middle East and Africa
- 5.5.5.1 Middle East
- 5.5.5.1.1 Saudi Arabia
- 5.5.5.1.2 United Arab Emirates
- 5.5.5.1.3 Turkey
- 5.5.5.1.4 Rest of Middle East
- 5.5.5.2 Africa
- 5.5.5.2.1 South Africa
- 5.5.5.2.2 Nigeria
- 5.5.5.2.3 Rest of Africa
- 5.5.1 North America
6 COMPETITIVE LANDSCAPE
- 6.1 Market Concentration
- 6.2 Strategic Moves
- 6.3 Market Share Analysis
- 6.4 Company Profiles (includes Global Overview, Market Overview, Core Segments, Financials, Strategic Info, Market Rank/Share, Products and Services, Recent Developments)
- 6.4.1 Schneider Electric SE
- 6.4.2 Vertiv Holdings Co.
- 6.4.3 Eaton Corporation plc
- 6.4.4 ABB Ltd.
- 6.4.5 Huawei Technologies Co. Ltd.
- 6.4.6 Delta Electronics Inc.
- 6.4.7 Riello UPS (Riello Elettronica)
- 6.4.8 AEG Power Solutions
- 6.4.9 Socomec Group
- 6.4.10 Borri S.p.A.
- 6.4.11 Kehua Data Co., Ltd.
- 6.4.12 KSTAR Science and Technology
- 6.4.13 CyberPower Systems, Inc.
- 6.4.14 Tripp Lite (by Eaton)
- 6.4.15 Gamatronic (SolarEdge)
- 6.4.16 Salicru S.A.
- 6.4.17 Piller Power Systems
- 6.4.18 Centiel SA
- 6.4.19 Hitec Power Protection
- 6.4.20 Statron AG
- 6.4.21 PowerShield Ltd.
- 6.4.22 Fuji Electric Co., Ltd.
- 6.4.23 Mitsubishi Electric Corp.
- 6.4.24 Toshiba ESS
- 6.4.25 Shenzhen Zhicheng Champion Co., Ltd.
- 6.4.26 Zhongheng Electric (China UPS)
7 INVESTMENT ANALYSIS
8 MARKET OPPORTUNITIES AND FUTURE TRENDS
- 8.1 White-Space and Unmet-Need Assessment
 模組化UPS市場:按類型、組件、相數、輸出容量、配置、電池類型、企業規模和最終用戶行業分類-2026-2032年全球市場預測
 2026年全球模組化不斷電系統(UPS)市場報告
 模組化不斷電系統(UPS) 市場規模、佔有率和成長分析(按拓撲結構、階段、組織規模、容量、最終用戶和地區分類)—產業預測 (2026-2033)
 全球模組化 UPS 市場:按技術、按相類型、按電壓、按功率容量、按外形規格、按電池類型 - 預測(至 2030 年)
 模組化不斷電系統(UPS)的全球市場:2024年
 模組化 UPS 市場 – 2024 年至 2029 年預測
 模組化 UPS 市場,按組件、組織規模、垂直行業和地區 - 2024-2032 年行業分析、市場規模、市場佔有率和預測