


 |
市場調查報告書
商品編碼
1849914
資料中心建置:市場佔有率分析、產業趨勢、統計資料和成長預測(2025-2030 年)Data Center Construction - Market Share Analysis, Industry Trends & Statistics, Growth Forecasts (2025 - 2030) |
||||||
※ 本網頁內容可能與最新版本有所差異。詳細情況請與我們聯繫。
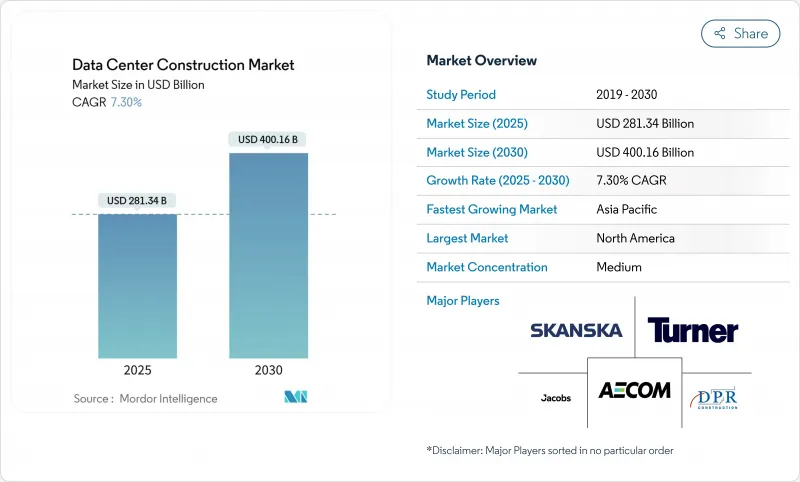
預計2025年資料中心建設市場規模將達2,813.4億美元,2030年將達4,001.6億美元,2025年至2030年的複合年成長率為7.30%。
這一擴張反映了對人工智慧賦能容量、廣泛的雲端遷移以及邊緣部署的激增需求,這些需求使數位基礎設施更貼近用戶。超大規模營運商的資本支出大幅飆升,轉化為強大的全球建設管道,該管道傾向於標準化、可重複的建設模式。然而,變壓器和配電盤供應鏈的中斷導致交貨前置作業時間延長至120週以上,威脅到進度確定性並增加了計劃風險。加上能源效率的監管壓力,業主被迫從計劃的早期階段就整合現場可再生能源和熱回收系統,這增加了設計的複雜性,同時也對獲得蓬勃發展的綠色債券融資構成了挑戰。
全球資料中心建立市場趨勢與洞察
雲端應用、人工智慧和巨量資料工作負載的擴展
高密度人工智慧機架每機架將需要 50-100 千瓦的功率,這將從根本上改變設計概念,並更傾向於採用液體冷卻而非傳統的風冷系統。光是微軟一家公司就已為 2025 年人工智慧基礎設施累計了800 億美元的資本支出,促使建築商設計配備 400 千伏冗餘供電和現場變電站的千兆瓦級園區。此類設施對銅的需求已經是傳統雲端設施的六倍,從而支持了越來越多從事先進溫度控管設施的專業承包商。像 Crusoe 公司位於德克薩斯州的 1.2 吉瓦園區這樣的計劃表明,資料中心建設市場正在挑戰傳統的施工方法,需要模組化模組、兆瓦級浸沒式水箱以及與人工智慧計算藍圖同步的快速授權策略。
加速引進超大規模設施
預計到2030年,超大規模資料中心設施的容量將成長兩倍,佔全球新增資料中心容量的很大一部分。特納建築公司位於俄亥俄州的Vantage資料中心設施耗資20億美元,擁有192兆瓦的IT電力,體現了標準化、重複建造的模式,透過批量採購和預製滑軌降低了單位成本。這種模式在確保規模經濟的同時,也使活動集中在電力充足的市場,造成勞動力供應緊張,並導致北維吉尼亞和都柏林等地區的薪資溢價超過20%。融資結構依賴數十億美元的購電協議,而公用事業互聯隊列和清潔能源目標通常決定建設階段。
房地產、安裝和維護成本不斷上漲
勞動力短缺導致北維吉尼亞3.5吉瓦風電叢集的電工和水管工工資上漲20%,限制了承包商的運轉率,並延長了計劃工期。開發商正在尋求像鳳凰城和馬德里這樣的二線城市,這些城市的土地和電力價格相對較低。鋼骨托樑和開關設備的批量採購協議以及長期銅套期保值策略支持了DPR建築公司等公司的成本控制策略。鋼骨框架仍具有成本效益,其20年的生命週期成本為35萬美元,而傳統的混凝土框架則為67萬至110萬美元。
細分分析
到 2024 年,Tier 3 資產將佔據資料中心建設市場佔有率的 58.2%,憑藉其均衡的冗餘度和資本支出狀況,其作為事實上的企業標準的地位將得到加強。同時,預計到 2030 年,Tier 4 需求的複合年成長率將達到 7.8%,因為銀行、證券交易所和公共部門組織的雲端運算要求為 99.995% 的執行時間支付溢價。 Tier 4計劃通常會使建設複雜度翻倍,包括雙重公用設施、2N動力傳動系統和分隔的防火區,與 Tier 2 藍圖相比,預算最多可增加 70%。 Turner Construction 在北卡羅來納州的模組化 Tier 4計劃透過使用經過工廠測試的電源艙將試運行時間縮短了 15%。
開發商也非常重視生命週期經濟性,因此資料中心建設市場中越來越多設計-建造聯盟將機電、控制和設備整合在一起,並在首次通電時即可獲得 Tier 4 認證。預製冷水機組和貨櫃式 UPS 可以在不犧牲 Tier 4 合規性的情況下進行擴展,支援多階段部署,使支出能夠滿足不斷成長的需求。
到2024年,主機託管業務將保持54.3%的收入佔比,凸顯了其多租戶靈活性和快速上市的提案主張。然而,到2030年,本土超大規模資料中心的複合年成長率將達到8.5%,這反映了雲端運算巨頭們尋求擁有核心基礎設施的策略舉措。斥資100億美元的路易斯安那州梅塔資料中心園區,佔地400萬平方英尺,專門用於人工智慧訓練叢集,並由600兆瓦的太陽能電力採購協議(PPA)提供支援。主機代管業者正積極回應,提供客製化的機房和液冷地板,在超大規模資料中心擴張的浪潮中保持競爭力。
建設模式正在多樣化。主機託管大廳需要靈活的機櫃佈局、熱通道封閉和共用的接入機房,以適應不同的租戶密度。超大規模資料中心業者傾向於千篇一律地複製12MW的容量,以將每MW的資本支出降低20%。工廠組裝的結構鋼骨在現場進行預焊接,將30MW建築的施工時間縮短至三週。因此,資料中心建設市場正日益將EPC供應商細分為面向超大規模資料中心營運商的數十億美元的全球框架契約,以及超大規模資料中心業者邊緣和企業需求的區域框架合約。
資料中心建設市場按層級類型(一級和二級、三級和四級)、資料中心類型(主機託管、自建超大規模資料中心 (CSP)、企業級、邊緣運算)、基礎設施(電力基礎設施、機械基礎設施)和地區細分。市場預測以美元計算。
區域分析
德國是歐洲資料中心建設市場的重要參與者,預計2024年將佔全球資料中心建設市場的約6%。其強大的數位基礎設施,尤其集中在法蘭克福、柏林和漢堡等關鍵地區,持續吸引全球科技巨頭的大量投資。德國致力於資料中心的永續發展,這體現在嚴格的能源效率法規和日益普及的可再生能源上。法蘭克福憑藉其位於歐洲中部的位置和廣泛的光纖連接,正逐漸成為重要的數位樞紐。先進的技術生態系統、熟練的勞動力和穩定的政治環境進一步增強了德國資料中心的實力。德國資料中心越來越注重創新的冷卻技術和永續的建設方法,為業界的環境責任樹立了新的標準。
其他福利
- Excel 格式的市場預測 (ME) 表
- 3個月的分析師支持
目錄
第1章 引言
- 研究假設和市場定義
- 調查範圍
第2章調查方法
第3章執行摘要
第4章 市場狀況
- 市場概況
- 市場促進因素
- 雲端應用、人工智慧和巨量資料工作負載的增加
- 加速超大規模設施的採用
- 增加人口密集地區附近的邊緣運算部署
- 可再生能源法規影響設施設計
- 預製/模組化結構加快上市時間
- ESG相關綠色債券融資刺激資本投資
- 市場限制
- 房地產、安裝和維護成本不斷上漲
- 更嚴格的能源消耗和碳排放監管限制
- 先進液體冷卻技術純熟勞工短缺
- 大容量動力設備供應鏈不穩定
- 供應鏈分析
- 監管格局
- 技術展望
- 波特五力模型
- 供應商的議價能力
- 消費者議價能力
- 新進入者的威脅
- 替代品的威脅
- 競爭對手之間的競爭
- 關鍵資料中心統計數據
- 區域級綜合資料中心營運商(單位:MW)
- 各地區即將啟動的重大資料中心計劃清單(2025-2030年)
- 資料中心建置的CAPEX和OPEX
- 2023 年及 2024 年各地區資料中心電力吸收容量(MW)
- 各地區將人工智慧(AI)融入資料中心建設
- 監理與合規框架
第5章市場規模及成長預測
- 按等級類型
- 1級和2級
- 第 3 層
- 第 4 層
- 依資料中心類型
- 搭配
- 自建超大規模資料中心業者(CSP)
- 企業和邊緣
- 按基礎設施
- 電力基礎設施
- 配電解決方案
- 電源備援解決方案
- 機械基礎設施
- 冷卻系統
- 機架和櫥櫃
- 伺服器和儲存
- 其他機械基礎設施
- 一般建築
- 服務——設計、諮詢、整合、支援、維護
- 按地區
- 北美洲
- 美國
- 加拿大
- 墨西哥
- 南美洲
- 巴西
- 阿根廷
- 南美洲其他地區
- 歐洲
- 德國
- 英國
- 法國
- 義大利
- 西班牙
- 俄羅斯
- 其他歐洲地區
- 亞太地區
- 中國
- 日本
- 印度
- 韓國
- 澳洲和紐西蘭
- 其他亞太地區
- 中東和非洲
- 中東
- 波灣合作理事會國家
- 土耳其
- 以色列
- 其他中東地區
- 非洲
- 南非
- 埃及
- 奈及利亞
- 其他非洲國家
- 1級和2級
第6章 競爭態勢
- 市場集中度
- 策略趨勢
- 市佔率分析
- Data Center Infrastructure Investment Based on Megawatt(MW)Capacity, 2024 vs 2030
- Data Center Construction Landscape(Key Vendors Listings)
- 公司簡介
- AECOM
- Turner Construction Co.
- DPR Construction
- Jacobs Solutions Inc.
- Skanska AB
- Balfour Beatty plc
- Whiting-Turner Contracting Co.
- Hensel Phelps
- Fortis Construction Inc.
- Goodman Group
- PT Jaya Obayashi
- Hibiya Engineering Ltd.
- Fluor Corporation
- Keppel Data Centres Holding
- NTT Global Data Centers
- Equinix Inc.
- Digital Realty Trust Inc.
- QTS Realty Trust LLC
- China State Construction Engineering Corp.
- Larsen and Toubro Ltd.(LandT Construction)
- Bouygues Construction SA
- Vinci Energies(Actemium)
- Samsung CandT Corporation
- Collen Construction Ltd.
- Corgan
- List of Data Center Construction Companies
第7章 市場機會與未來展望
The data center construction market size is expected to be valued at USD 281.34 billion in 2025 and is forecast to reach USD 400.16 billion by 2030, advancing at a 7.30% CAGR during 2025-2030.
The expansion reflects surging demand for AI-ready capacity, widespread cloud migration, and edge deployments that place digital infrastructure closer to users. Capital spending by hyperscale operators has surged significantly, translating into a robust global construction pipeline that favors standardized, repeatable build models. Yet supply-chain disruptions in transformers and switchgear lengthen delivery lead times to more than 120 weeks, threatening schedule certainty and elevating project risk. Parallel regulatory pressure on energy efficiency pushes owners to integrate on-site renewables and heat-recovery systems from project inception, adding design complexity but also unlocking access to fast-growing pools of green-bond financing.
Global Data Center Construction Market Trends and Insights
Growing Cloud Applications, AI and Big Data Workloads
High-density AI racks now demand 50-100 kW per rack, fundamentally changing design briefs and favoring liquid cooling over legacy air systems. Microsoft alone has earmarked USD 80 billion in 2025 CAPEX for AI infrastructure, spurring builders to engineer gigawatt-scale campuses with redundant 400 kV feeds and on-site substations. Copper demand for these builds is already six times the level of conventional cloud facilities, which supports a growing specialty trade segment for advanced thermal-management installation. Projects such as Crusoe's 1.2 GW campus in Texas illustrate how the data center construction market is stretching traditional construction practices, requiring modular blocks, megawatt-class immersion tanks, and rapid permitting strategies that keep pace with AI compute roadmaps.
Accelerating Adoption of Hyperscale Facilities
Hyperscale capacity is forecast to triple by 2030, accounting for most incremental square footage added worldwide. Turner Construction's USD 2 billion Vantage facility in Ohio, with 192 MW of IT power, typifies the standardized, repeat-build approach that lowers unit costs via bulk procurement and prefabricated skids. While the model secures economies of scale, it concentrates activity in power-rich markets, tightening labor availability and driving wage premiums above 20% in regions such as Northern Virginia and Dublin. Financial structures depend on multibillion-dollar power-purchase agreements, meaning utility interconnection queues and clean-energy targets often dictate construction phasing.
Escalating Real-Estate, Installation and Maintenance Costs
Labor shortages layered on a 20% wage premium for electricians and pipefitters across Northern Virginia's 3.5 GW cluster, constraining contractor availability and extending project schedules. Developers increasingly scout secondary metros such as Phoenix and Madrid, where land and power remain comparatively inexpensive. Bulk-buy agreements for steel joists and switchgear plus long-term hedges on copper now underpin cost-control strategies at firms like DPR Construction, which completed a 100 MW campus in Texas on a fixed-price basis despite volatile commodity inputs. Steel framing remains cost-advantaged, with 20-year lifecycle outlays of USD 350,000 compared to USD 670,000-1.1 million for traditional concrete shells.
Other drivers and restraints analyzed in the detailed report include:
- Rising Edge-Computing Build-outs Near Population Hubs
- Renewable-Energy Mandates Shaping Facility Design
- Supply-Chain Volatility in High-Capacity Power Gear
For complete list of drivers and restraints, kindly check the Table Of Contents.
Segment Analysis
Tier 3 assets retained 58.2% of the data center construction market share in 2024, reinforcing their role as the de facto enterprise standard thanks to balanced redundancy and capex profiles. Meanwhile, Tier 4 demand is projected to grow at 7.8% CAGR through 2030 as banks, stock exchanges, and public-sector cloud mandates pay premiums for 99.995% uptime. Tier 4 projects often double construction complexity: dual utility feeds, 2N power trains, and compartmentalized fire zones inflate budgets by up to 70% over Tier 2 blueprints. Turner Construction's modular Tier 4 build in North Carolina cut commissioning time by 15% using factory-tested power pods, illustrating how innovation tempers cost escalation.
Developers also weigh lifecycle economics. The data center construction market therefore, sees rising design-build consortiums that integrate mechanical, electrical, and controls to certify Tier 4 on first power-up. Prefabricated chillers and containerized UPS segments enable scale without sacrificing Tier 4 compliance, supporting multi-phase rollouts that align spend with demand growth.
Colocation retained 54.3% of 2024 revenue, underlining its value proposition of multi-tenant flexibility and speed-to-market. However, self-built hyperscalers will widen at 8.5% CAGR through 2030, reflecting strategic moves by cloud giants to own core infrastructure. The USD 10 billion Meta Louisiana campus uses a 4 million-square-foot layout dedicated to AI training clusters and backed by a 600 MW solar PPA, underscoring how scale economics tilt toward owner-operator models. Colocation operators respond by offering build-to-suit halls and liquid-cooling-ready floors, preserving relevance amid hyperscale expansion.
Construction modalities diverge. Colocation halls require flexible cage layouts, hot-aisle containment, and shared meet-me rooms that accommodate diverse tenant densities. Hyperscalers instead prefer 12 MW blocks replicated in cookie-cutter fashion to cut capex per MW by 20%. Factory-assembled structural steel frames arrive on site pre-welded, slashing erection times to three weeks for a 30-MW building. As a result, the data center construction market is increasingly segmenting EPC suppliers into multi-billion-dollar global framework agreements for hyperscalers and regional frameworks for edge and enterprise demand.
Data Center Construction Market is Segmented by Tier Type (Tier 1 and 2, Tier 3 and Tier 4), Data Center Type(Colocation, Self-Built Hyperscalers (CSPs), Enterprise, and Edge), and Infrastructure (Electrical Infrastructure, Mechanical Infrastructure), and by Geography. The Market Forecasts are Provided in Terms of Value (USD).
Geography Analysis
Germany stands as the cornerstone of Europe's data center construction market, commanding approximately 6% of the global data center construction market size in 2024. The country's robust digital infrastructure, particularly concentrated in major hubs like Frankfurt, Berlin, and Hamburg, continues to attract significant investments from global technology giants. The nation's commitment to sustainable data center development is evident through strict energy efficiency regulations and the increasing adoption of renewable energy sources. Frankfurt, in particular, has emerged as a critical digital hub, benefiting from its central European location and extensive fiber connectivity. The country's data center landscape is further strengthened by its advanced technological ecosystem, skilled workforce, and stable political environment. German data centers are increasingly focusing on innovative cooling technologies and sustainable construction practices, setting new standards for environmental responsibility in the industry.
- AECOM
- Turner Construction Co.
- DPR Construction
- Jacobs Solutions Inc.
- Skanska AB
- Balfour Beatty plc
- Whiting-Turner Contracting Co.
- Hensel Phelps
- Fortis Construction Inc.
- Goodman Group
- PT Jaya Obayashi
- Hibiya Engineering Ltd.
- Fluor Corporation
- Keppel Data Centres Holding
- NTT Global Data Centers
- Equinix Inc.
- Digital Realty Trust Inc.
- QTS Realty Trust LLC
- China State Construction Engineering Corp.
- Larsen and Toubro Ltd. (LandT Construction)
- Bouygues Construction SA
- Vinci Energies (Actemium)
- Samsung CandT Corporation
- Collen Construction Ltd.
- Corgan
Additional Benefits:
- The market estimate (ME) sheet in Excel format
- 3 months of analyst support
TABLE OF CONTENTS
1 INTRODUCTION
- 1.1 Study Assumptions and Market Definition
- 1.2 Scope of the Study
2 RESEARCH METHODOLOGY
3 EXECUTIVE SUMMARY
4 MARKET LANDSCAPE
- 4.1 Market Overview
- 4.2 Market Drivers
- 4.2.1 Growing cloud applications, AI and big data workloads
- 4.2.2 Accelerating adoption of hyperscale facilities
- 4.2.3 Rising edge-computing build-outs near population hubs
- 4.2.4 Renewable-energy mandates shaping facility design
- 4.2.5 Prefabricated / modular builds shrinking time-to-market
- 4.2.6 ESG-linked green-bond financing unlocking capex
- 4.3 Market Restraints
- 4.3.1 Escalating real-estate, installation and maintenance cost
- 4.3.2 Stricter energy-consumption and carbon-compliance limits
- 4.3.3 Shortage of skilled labor for advanced liquid cooling
- 4.3.4 Supply-chain volatility in high-capacity power gear
- 4.4 Supply-Chain Analysis
- 4.5 Regulatory Landscape
- 4.6 Technological Outlook
- 4.7 Porter's Five Forces
- 4.7.1 Bargaining Power of Suppliers
- 4.7.2 Bargaining Power of Consumers
- 4.7.3 Threat of New Entrants
- 4.7.4 Threat of Substitutes
- 4.7.5 Intensity of Competitive Rivalry
- 4.8 Key Data Center Statistics
- 4.8.1 Exhaustive Data Center Operators on Regional Level (in MW)
- 4.8.2 List of Major Upcoming Data Center Projects across various regions(2025-2030)
- 4.8.3 CAPEX and OPEX For Data Center Construction
- 4.8.4 Data Center Power Capacity Absorption In MW, regions, 2023 and 2024
- 4.9 Artificial Intelligence (AI) Inclusion in Data Center Construction across Various Regions
- 4.10 Regulatory and Compliance Framework
5 MARKET SIZE AND GROWTH FORECASTS (VALUE)
- 5.1 By Tier Type
- 5.1.1 Tier 1 and 2
- 5.1.1.1 Tier 3
- 5.1.1.2 Tier 4
- 5.1.2 By Data Center Type
- 5.1.2.1 Colocation
- 5.1.2.2 Self-build Hyperscalers (CSPs)
- 5.1.2.3 Enterprise and Edge
- 5.1.3 By Infrastructure
- 5.1.3.1 By Electrical Infrastructure
- 5.1.3.1.1 Power Distribution Solution
- 5.1.3.1.2 Power Backup Solutions
- 5.1.3.2 By Mechanical Infrastructure
- 5.1.3.2.1 Cooling Systems
- 5.1.3.2.2 Racks and Cabinets
- 5.1.3.2.3 Servers and Storage
- 5.1.3.2.4 Other Mechanical Infrastructure
- 5.1.3.3 General Construction
- 5.1.3.4 Service - Design and Consulting, Integration, Support and Maintenance
- 5.1.4 By Geography
- 5.1.4.1 North America
- 5.1.4.1.1 United States
- 5.1.4.1.2 Canada
- 5.1.4.1.3 Mexico
- 5.1.4.2 South America
- 5.1.4.2.1 Brazil
- 5.1.4.2.2 Argentina
- 5.1.4.2.3 Rest of South America
- 5.1.4.3 Europe
- 5.1.4.3.1 Germany
- 5.1.4.3.2 United Kingdom
- 5.1.4.3.3 France
- 5.1.4.3.4 Italy
- 5.1.4.3.5 Spain
- 5.1.4.3.6 Russia
- 5.1.4.3.7 Rest of Europe
- 5.1.4.4 Asia-Pacific
- 5.1.4.4.1 China
- 5.1.4.4.2 Japan
- 5.1.4.4.3 India
- 5.1.4.4.4 South Korea
- 5.1.4.4.5 Australia and New Zealand
- 5.1.4.4.6 Rest of Asia-Pacific
- 5.1.4.5 Middle East and Africa
- 5.1.4.5.1 Middle East
- 5.1.4.5.1.1 Gulf Corporation Countries
- 5.1.4.5.1.2 Turkey
- 5.1.4.5.1.3 Israel
- 5.1.4.5.1.4 Rest of Middle East
- 5.1.4.5.2 Africa
- 5.1.4.5.2.1 South Africa
- 5.1.4.5.2.2 Egypt
- 5.1.4.5.2.3 Nigeria
- 5.1.4.5.2.4 Rest of Africa
- 5.1.1 Tier 1 and 2
6 COMPETITIVE LANDSCAPE
- 6.1 Market Concentration
- 6.2 Strategic Moves
- 6.3 Market Share Analysis
- 6.4 Data Center Infrastructure Investment Based on Megawatt (MW) Capacity, 2024 vs 2030
- 6.5 Data Center Construction Landscape (Key Vendors Listings)
- 6.6 Company Profiles (includes Global level Overview, Market level overview, Core Segments, Financials as available, Strategic Information, Market Rank/Share for key companies, Products and Services, Recent Developments)
- 6.6.1 AECOM
- 6.6.2 Turner Construction Co.
- 6.6.3 DPR Construction
- 6.6.4 Jacobs Solutions Inc.
- 6.6.5 Skanska AB
- 6.6.6 Balfour Beatty plc
- 6.6.7 Whiting-Turner Contracting Co.
- 6.6.8 Hensel Phelps
- 6.6.9 Fortis Construction Inc.
- 6.6.10 Goodman Group
- 6.6.11 PT Jaya Obayashi
- 6.6.12 Hibiya Engineering Ltd.
- 6.6.13 Fluor Corporation
- 6.6.14 Keppel Data Centres Holding
- 6.6.15 NTT Global Data Centers
- 6.6.16 Equinix Inc.
- 6.6.17 Digital Realty Trust Inc.
- 6.6.18 QTS Realty Trust LLC
- 6.6.19 China State Construction Engineering Corp.
- 6.6.20 Larsen and Toubro Ltd. (LandT Construction)
- 6.6.21 Bouygues Construction SA
- 6.6.22 Vinci Energies (Actemium)
- 6.6.23 Samsung CandT Corporation
- 6.6.24 Collen Construction Ltd.
- 6.6.25 Corgan
- 6.7 List of Data Center Construction Companies
7 MARKET OPPORTUNITIES and FUTURE OUTLOOK
- 7.1 White-space and Unmet-need Assessment
 資料中心建置市場:依資料中心類型、建設形式、等級、組件、建設服務類型及最終用戶產業分類-2026-2032年全球市場預測
 2026年全球資料中心建置市場報告
 全球資料中心建設市場規模、佔有率、趨勢和成長分析報告(2026-2034)
 資料中心建置市場分析及預測(至2035年):類型、產品、服務、技術、組件、應用、材料類型、部署模式、最終用戶、設備
 資料中心建置市場規模、佔有率和趨勢分析報告:按基礎設施、層級、最終用途、地區和細分市場預測(2026-2033 年)
 2026-2030年全球資料中心建置市場
 新加坡資料中心建置:市場佔有率分析、產業趨勢與統計、成長預測(2026-2031)
 資料中心建置市場報告:按建設類型、資料中心類型、等級標準、產業垂直領域和地區分類(2026-2034 年)
 資料中心建置市場-全球產業規模、佔有率、趨勢、機會及預測(依基礎設施類型、層級、資料中心規模、最終用戶產業、地區及競爭格局分類,2021-2031)資料中心機械設備建置市場(依組件類型、液冷系統、建置類型、等級及計劃類型分類)-2026-2032年全球預測