


 |
市場調查報告書
商品編碼
1849901
量子點(QD):市場佔有率分析、產業趨勢、統計數據和成長預測(2025-2030 年)Quantum Dots (QD) - Market Share Analysis, Industry Trends & Statistics, Growth Forecasts (2025 - 2030) |
||||||
※ 本網頁內容可能與最新版本有所差異。詳細情況請與我們聯繫。
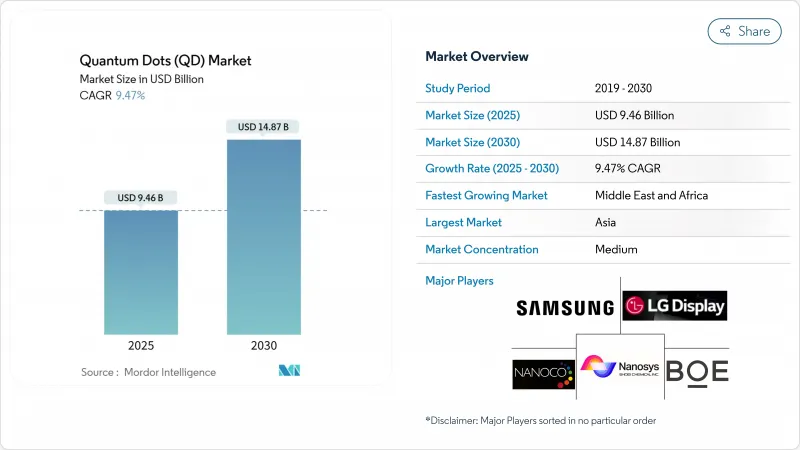
全球量子點(QD)市場預計到 2025 年將達到 94.6 億美元,到 2030 年將達到 148.7 億美元。
量子點(QDs)的商業性進程正在加速,從實驗室研發走向大規模生產,應用於超高清顯示器、量子安全通訊節點、下一代生物成像平台等領域。量子點電視在中國的快速普及、符合歐盟RoHS指令的無鎘化學技術的出現,以及亞洲和中東地區政府的持續投入,都支撐著量子點技術的長期需求。亞太地區的規模優勢,加上鈣鈦礦技術的突破性進展(提高了效率和色彩純度),使得量子點產品的單位成本下降速度超過傳統OLED,從而為主流消費價格分佈開闢了新的道路。同時,基於半導體量子點的量子運算架構以及癌症診斷靈敏度五倍的提升,也為量子點技術的應用拓展了更多可能性,使其應用範圍遠遠超出顯示器領域。
全球量子點(QD)市場趨勢與洞察
中國在超高清電視面板中率先採用量子點(QD)技術
國內面板廠商正在推出高產量能量子點(QD)薄膜生產線,可實現超過100%的NTSC色域覆蓋範圍。 TCL的QM6K系列面板憑藉其超高能量LED背光,實現了超過98%的DCI-P3色域覆蓋範圍和53%的高亮度。京東方投資90億美元的第八代半AMOLED工廠預計將於2026年運作,將進一步鞏固其成本領先地位,並確保對區域品牌的供應。從RGB OLED架構到QD-OLED架構的過渡將簡化生產流程,提高產量比率,並降低4K和8K螢幕的平方公尺資本支出。
歐盟推動對家用電子電器中不含鎘的量子點進行監管
歐盟RoHS指令規定的鎘含量上限為0.01 wt%,推動了銅銦和磷酸銦氧化物配方的早期應用。 UbiQD公司2000萬美元的B輪融資將用於擴大無鎘產品的生產規模,而應用材料公司已展示了性能與鎘在顏色轉換層中相當的無鉛裝置。各大學正在將水相合成路線商業化,這些路線無需使用有機溶劑,並能減少製程排放,為採用這些路線的公司帶來成本和合規性優勢。
高純度磷化銦前驅體供應鏈瓶頸
預計6G基礎設施對銦的需求將佔年產量的4%,將導致磷化銦量子點(QDs)供應緊張,並推高價格。蘇喬大學的油墨工程路線預計將太陽能發電成本降低至0.06美元/瓦,但這需要純度穩定的銦,而這種純度的銦除了少數幾家精煉廠外,其他地方都非常稀缺。微波輔助合成和離子液體合成雖然減少了有害試劑的使用,但仍需要安全的金屬原料,因此至少在2028年之前,供應風險仍然很高。
細分市場分析
鎘基II-VI族化合物將佔2024年收入的48.3%,憑藉其成熟的供應鏈和高量子產率,為量子點(QD)市場提供支撐。然而,隨著歐盟和加州政策趨向於更輕元素的化學體系,監管方面可能會產生影響。鈣鈦礦材料以11.7%的複合年成長率成長,正從實驗室新奇材料向可量產的發送器轉型,其室溫單光子純度可與鎘的亮度相媲美,並拓展了其在安全通訊的應用。磷化銦平台受益於UbiQD的規模化投資和應用材料公司的製程最佳化,但前驅體短缺阻礙了其在短期內的廣泛應用。矽和碳量子點(QD)正在生物醫學領域開闢一片新天地,在臨床相關劑量下細胞毒性極低,可用於螢光導航手術。歷史數據顯示,2020 年至 2024 年間,鎘替代品的年成長率將達到 15-20%,而現有鎘材料的年成長率將低於 5%,這預示著量子點 (QD) 市場將發生結構性轉變。
第二代材料正在拓展其終端應用領域。石墨烯量子點(QDs)與矽奈米殼融合後,成功將蚜蟲數量減少了71%,使奈米材料的應用範圍從顯示器擴展到精密農業。鈣鈦礦發光層現在可以以140 PPI的解析度進行印刷,從而便於整合到中型顯示器中。矽點可提供穩定的紅外線致發光,這對於穿戴式生物感測器至關重要。預計無鎘量子點(QD)市場規模將達到兩位數成長,這將促使供應商轉向使用毒性較低的化學品。企業日益成長的ESG目標以及RoHS豁免即將到期,進一步鞏固了這條轉型路徑。
量子點薄膜仍將是重要的收入促進因素,預計到2024年將佔據72.1%的市場佔有率,這主要得益於電視OEM廠商尋求即插即用的色彩轉換器,以便整合到現有的LCD堆疊中。然而,片上量子點(QD)的複合年成長率將達到12.7%,成為成長最快的技術,因為半導體代工廠可以將光子發送器直接整合到晶圓代工廠平台中。劍橋大學開發的13000自旋量子暫存器,實現了69%的保真度和130微秒的相干時間,凸顯了晶片級量子節點的巨大潛力。微流體,其尺寸分散度已低於5%,這對於連貫光發射至關重要。在波紋晶圓上進行電泳沉澱,可以製備出無裂紋的近紅外線檢測器,從而為汽車雷射雷達和醫療內視鏡等應用開闢了市場。隨著線寬縮小達到平台期,整合光電提供了莫耳定律式的擴展,而量子點 (QD) 則提供了矽光電藍圖中缺少的單光子源。
擴展路徑正在分化。噴墨列印的QD-OLED面板已實現31.5吋的對角線尺寸商業化生產,而電液動力噴射技術則正在為微型LED陣列生產微米級RGB像素。隨著量子運算性能的提升,量子點(QD)市場規模將在晶片級應用中進一步擴大。對原子層沉澱和原子級精度微影術的投資將使量子點位置與電晶體閘極精準對齊,並降低量子匯流排互連延遲。裝置OEM廠商正透過整合封裝、溫度控管和微影術對準等方面的智慧財產權來建構新的防禦體系。
區域分析
亞太地區將持續維持領先地位,預計2024年將佔全球銷售額的38.4%,主要得益於垂直整合的面板製造商和各國計畫中的研發投入。三星顯示器向QD-OLED生產線轉型(投資109億美元)以及韓國的量子計劃(投資4910億韓元)將進一步強化亞太生態系統,而中國的京東方將投資90億美元建設第八代半OLED產能,以支持本地供應鏈。日本正透過製造程序創新來提升產能,並舉辦研討會以解決毒性和耐久性方面的瓶頸問題。亞洲量子點(QD)市場規模的成長主要受國內高階電視需求以及對北美和歐洲出口的驅動。
在北美,劍橋大學(劍橋-美國合作計畫)、麻省理工學院林肯實驗室和洛斯阿拉莫斯國家實驗室的深厚研究實力正推動量子安全鏈路和高效太陽能的發展。創業投資的強勁動能也印證了這一點,UbiQD 完成資金籌措並收購 IonQ 便是明證。強而有力的智慧財產權保護和聯邦政府的資助確保了商業化進程的順利進行,而美國對鎘化合物的出口管制則促使供應商轉向磷化銦的生產。歐洲則充分利用監管影響力:列日大學的水相合成技術減少了有害廢棄物的產生。政府的綠色新政基金也為節能建築引進了量子點(QD)窗膜。
中東和非洲的複合年成長率最高,達10.6%。阿拉伯聯合大公國的諾瑪中心、卡達一項價值1000萬美元的項目以及沙烏地阿拉伯的研發基金正在推動量子點(QD)計算叢集的發展,以實現經濟多元化,擺脫對石油的依賴。進口替代政策鼓勵在當地組裝量子點增強型太陽能板和醫療設備。拉丁美洲對農業技術的需求正在萌芽,例如量子點溫室薄膜可以提高高海拔農場的蔬果產量,但市場滲透率仍低於3%。整體而言,地理收入多元化可以降低集中風險:到2030年,隨著中東和非洲吸引投資,以及西方地區在關鍵材料加工領域實現本土化,亞洲的市場佔有率將下降至35%。
其他福利:
- Excel格式的市場預測(ME)表
- 3個月的分析師支持
目錄
第1章 引言
- 研究假設和市場定義
- 調查範圍
第2章調查方法
第3章執行摘要
第4章 市場情勢
- 市場概覽
- 市場促進因素
- 中國在超高清電視面板中主導採用量子點(QD)技術
- 歐盟推動消費性電子產品中無鎘量子點(QD)監管。
- 鈣鈦礦量子點(QDs)在顯示器背光領域的快速商業化
- 醫療保健領域基於量子點(QD)的生物成像劑的激增
- 韓國政府資助的量子材料研發項目
- 市場限制
- 高純度磷化銦前驅體供應鏈瓶頸
- 鈣鈦礦量子點在潮濕環境下的表現劣化
- 歐洲鎘監管的環境合規成本
- 量子點微型LED整合的大規模生產基礎設施有限
- 產業生態系分析
- 技術展望(生產技術)
- 波特五力分析
- 供應商的議價能力
- 買方的議價能力
- 新進入者的威脅
- 替代品的威脅
- 競爭程度
- 投資分析
第5章 市場規模與成長預測
- 依材料類型
- 鎘 II-VI 族(CdSe、CdS、CdTe)
- 無鎘 III-V 族(InP、GaAs)
- 鈣鈦礦量子點(QDs)
- 矽量子點(QDs)
- 石墨烯和碳量子點(QDs)
- 按設備外形尺寸
- 量子點薄膜
- 片上量子點(QDs)
- 核心-外殼架構與殼內架構
- 透過使用
- 展示
- QD-LCD
- QD-OLED
- 微型LED整合
- 照明
- 一般照明
- 特殊照明
- 太陽能電池和光伏電池
- 醫學影像診斷
- 藥物遞送及治療診斷學
- 感測器和儀器
- 量子計算與安全
- 農業和食品
- 其他
- 展示
- 按最終用途行業分類
- 消費性電子產品
- 醫療保健和生命科學
- 能源與電力
- 國防與安全
- 農業
- 其他
- 按地區
- 北美洲
- 美國
- 加拿大
- 墨西哥
- 歐洲
- 德國
- 英國
- 法國
- 北歐國家
- 其他歐洲地區
- 南美洲
- 巴西
- 其他南美洲
- 亞太地區
- 中國
- 日本
- 印度
- 東南亞
- 亞太其他地區
- 中東和非洲
- 中東
- GCC
- 土耳其
- 其他中東地區
- 非洲
- 南非
- 其他非洲地區
- 北美洲
第6章 競爭情勢
- 市場集中度
- 策略趨勢
- 市佔率分析
- 公司簡介
- Samsung Electronics Co., Ltd.
- Nanosys Inc.
- LG Display Co., Ltd.
- BOE Technology Group Co., Ltd.
- Nanoco Group PLC
- Quantum Materials Corporation
- UbiQD, Inc.
- Ocean NanoTech LLC
- Thermo Fisher Scientific Inc.
- Merck KGaA
- Avantama AG
- Quantum Solutions Inc.
- QD Laser, Inc.
- OSRAM Licht AG
- Sony Corporation
- TCL CSOT
- Crystalplex Corporation
- Evident Technologies
- NN-Labs(NNCrystal US Corp.)
- Nanophotonica Inc.
- Quantum Science Ltd.
- Toray Industries, Inc.
第7章 市場機會與未來展望
The global quantum dots market stood at USD 9.46 billion in 2025 and is forecast to reach USD 14.87 billion by 2030, reflecting a 9.47% CAGR over the period.
Commercial maturity is accelerating as the technology migrates from laboratory discovery to mass-produced components in ultra-high-definition displays, quantum-secure communication nodes, and next-generation bio-imaging platforms. China's rapid uptake of quantum-dot televisions, the emergence of cadmium-free chemistries that comply with EU RoHS limits, and sustained government funding in Asia and the Middle East are sustaining long-term demand. Manufacturing scale advantages in Asia-Pacific, combined with perovskite breakthroughs that lift efficiency and color purity, are lowering unit costs faster than legacy OLED alternatives, opening mainstream consumer price points. In parallel, quantum computing architectures based on semiconductor quantum dots, and five-fold sensitivity gains in cancer diagnostics, are expanding total addressable opportunities well beyond displays.
Global Quantum Dots (QD) Market Trends and Insights
Quantum-dot adoption in ultra-high-definition television panels, led by China
Domestic panel makers have installed high-capacity quantum-dot film lines that deliver more than 100% NTSC color gamut, while TCL's QM6K series achieves 98%+ DCI-P3 coverage and 53% higher brightness through Super High Energy LED back-lights. BOE's USD 9 billion Gen-8.6 AMOLED facility, coming online in 2026, reinforces cost leadership and secures supply for regional brands. The shift from RGB OLED to QD-OLED architectures simplifies manufacturing, enhancing yield and lowering capex per square meter for 4K and 8K screens.
Regulatory push for cadmium-free quantum dots in EU consumer electronics
The EU's 0.01 wt% cadmium cap under RoHS is driving early movers toward copper-indium and indium-phosphide formulations. UbiQD's USD 20 million Series B round will scale cadmium-free production, while Applied Materials has proven lead-free devices matching cadmium performance in color conversion layers. Universities are commercializing aqueous synthesis routes that remove organic solvents and cut process emissions, creating cost and compliance advantages for adopters.
Supply-chain bottlenecks for high-purity indium-phosphide precursors
Indium demand from 6G infrastructure is projected to consume 4% of annual production, squeezing availability for indium-phosphide quantum dots and pushing prices higher. Soochow University's ink-engineering route lowers photovoltaic costs to USD 0.06/Wp but relies on consistent indium purity, which remains scarce outside a handful of refiners. Microwave-assisted and ionic-liquid syntheses reduce hazardous reagents yet still require secure metal feedstocks, keeping supply risk elevated through at least 2028.
Other drivers and restraints analyzed in the detailed report include:
- Rapid commercialization of perovskite quantum dots in display back-lighting
- Surge in quantum-dot bio-imaging agents in healthcare applications
- Performance degradation of perovskite quantum dots under moisture exposure
For complete list of drivers and restraints, kindly check the Table Of Contents.
Segment Analysis
Cadmium-based II-VI compounds held 48.3% of 2024 revenues, anchoring the quantum dots market through well-established supply chains and high quantum yields. Regulatory exposure, however, compresses their outlook as EU and California policies converge on lighter-element chemistries. Perovskite variants, supported by 11.7% CAGR, move from lab novelty to production-ready emitters that match cadmium brightness and achieve room-temperature single-photon purity, broadening relevance for secure communications. Indium-phosphide platforms benefit from UbiQD's scale-up funding and Applied Materials' process optimization, yet precursor shortages temper near-term penetration. Silicon and carbon quantum dots are carving biomedical niches, showing negligible cytotoxicity at clinically relevant doses and enabling fluorescence-guided surgery. Historic data reveal cadmium alternatives growing 15-20% annually versus sub-5% for cadmium incumbents from 2020-2024, signaling a structural pivot in the quantum dots market.
Second-generation materials diversify end-use reach. Graphene quantum dots fused with silicon nanoshells achieve 71% aphid-population suppression, positioning nanomaterials for precision agriculture beyond displays. Perovskite glow layers are now printable at 140 PPI, easing integration into mid-sized monitors, while silicon dots deliver stable infrared photoluminescence critical for wearable biosensors. The quantum dots market size for cadmium-free segments is projected to rise at double-digit rates, reinforcing supplier pivots toward low-toxicity chemistries. Heightened corporate ESG targets, plus upcoming RoHS exemptions sunsets, cement the transition path.
QD films remain revenue mainstays with 72.1% share in 2024, favored by television OEMs seeking plug-and-play color converters that slip into existing LCD stacks. Yet on-chip quantum dots display the highest 12.7% CAGR as semiconductor fabs capture photonic emitters directly on foundry platforms. University of Cambridge's 13,000-spin quantum register, achieving 69% fidelity at 130 µs coherence, underscores leapfrog potential for chip-scale quantum nodes. Core-shell nanopillars grown through microfluidic reactors now exhibit sub-5% size dispersion, crucial for coherent emission. Electrophoretic deposition on corrugated wafers yields crack-free near-infrared detectors, opening automotive LiDAR and medical endoscope markets. As line width reductions plateau, integrated photonics offers Moore-than-More scaling, with quantum dots supplying the single-photon sources missing from silicon photonics roadmaps.
Scaling pathways diverge. Inkjet printed QD-OLED panels already hit 31.5-inch diagonals at commercial yield, while electrohydrodynamic jetting produces micron-scale RGB pixels for microLED arrays. The quantum dots market size captured by on-chip formats is set to widen as performance gains in quantum computing justify higher ASPs. Investments in atomic-layer deposition and atomic-precision lithography will further align dot placement with transistor gateways, shrinking interconnect delays in quantum buses. Device OEMs are bundling intellectual property around packaging, thermal management, and lithographic alignment, creating new defensible moats.
The Quantum Dots (QD) Market is Segmented by Material Type (Cadmium-Based II-VI (CdSe, Cds, Cdte), Cadmium-Free III-V (InP, Gaas), and More), Device Form Factor (QD Films, On-Chip Quantum Dots, and More), Application (Displays, Lighting, Solar Cells and Photovoltaics, and More), End-Use Industry (Consumer Electronics, Healthcare and Life Sciences, and More), and Geography. The Market Forecasts are Provided in Terms of Value (USD).
Geography Analysis
Asia-Pacific maintains leadership with 38.4% of 2024 revenue due to vertically integrated panel makers and deliberate national R&D funding. Samsung Display's USD 10.9 billion conversion to QD-OLED lines and South Korea's KRW 491 billion quantum program cement the ecosystem, while China's BOE invests USD 9 billion in Gen-8.6 capacity that anchors local supply chains. Japan complements manufacturing heft with process innovation, hosting seminars to solve toxicity and durability bottlenecks. The quantum dots market size in Asia remains underpinned by domestic demand for premium TVs and by export flows into North America and Europe.
North America follows with deep research assets at University of Cambridge (Cambridge-US collaborations), MIT Lincoln Laboratory, and Los Alamos National Laboratory driving quantum-secure links and high-efficiency photovoltaics. Venture capital traction is robust, proven by UbiQD's USD 20 million raise and IonQ's headline acquisitions. Strong IP protection and federal funding ensure commercialization pipelines, and US export-control scrutiny over cadmium compounds nudges suppliers toward indium-phosphide builds. Europe leverages regulatory influence: RoHS compliance sparks cadmium-free adoption, while University of Liege's aqueous syntheses cut hazardous waste. Government green-deal funds deploy quantum-dot window films for energy-positive buildings.
The Middle East and Africa record the fastest 10.6% CAGR. UAE's Norma Center, Qatar's USD 10 million program, and Saudi R&D funds foster quantum-dot computing clusters, aiming to diversify oil economies. Import substitution policies encourage local assembly of QD-enhanced solar panels and medical devices. Latin America sees nascent demand in agrotechnology, where quantum-dot greenhouse sheets improve fruit yield in high-altitude farms, yet market penetration remains under 3%. Overall, geographic revenue dispersion reduces concentration risk: Asia's share inches lower toward 35% by 2030 as Middle East and Africa capture investment flows and as Western regions on-shore critical materials processing.
- Samsung Electronics Co., Ltd.
- Nanosys Inc.
- LG Display Co., Ltd.
- BOE Technology Group Co., Ltd.
- Nanoco Group PLC
- Quantum Materials Corporation
- UbiQD, Inc.
- Ocean NanoTech LLC
- Thermo Fisher Scientific Inc.
- Merck KGaA
- Avantama AG
- Quantum Solutions Inc.
- QD Laser, Inc.
- OSRAM Licht AG
- Sony Corporation
- TCL CSOT
- Crystalplex Corporation
- Evident Technologies
- NN-Labs (NNCrystal US Corp.)
- Nanophotonica Inc.
- Quantum Science Ltd.
- Toray Industries, Inc.
Additional Benefits:
- The market estimate (ME) sheet in Excel format
- 3 months of analyst support
TABLE OF CONTENTS
1 INTRODUCTION
- 1.1 Study Assumptions and Market Definition
- 1.2 Scope of the Study
2 RESEARCH METHODOLOGY
3 EXECUTIVE SUMMARY
4 MARKET LANDSCAPE
- 4.1 Market Overview
- 4.2 Market Drivers
- 4.2.1 Quantum Dot Adoption in Ultra-High-Definition Television Panels, Led by China
- 4.2.2 Regulatory Push for Cadmium-Free Quantum Dots in EU Consumer Electronics
- 4.2.3 Rapid Commercialization of Perovskite Quantum Dots in Display Back-Lighting
- 4.2.4 Surge in Quantum Dot-Based Bio-Imaging Agents in Healthcare Applications
- 4.2.5 Government-Funded Quantum-Materials R&D Programs in South Korea
- 4.3 Market Restraints
- 4.3.1 Supply-Chain Bottlenecks for High-Purity Indium-Phosphide Precursors
- 4.3.2 Performance Degradation of Perovskite QDs Under Moisture Exposure
- 4.3.3 Environmental-Compliance Costs of Cadmium Regulations in Europe
- 4.3.4 Limited Mass-Manufacturing Infrastructure for QD Micro-LED Integration
- 4.4 Industry Ecosystem Analysis
- 4.5 Technological Outlook (Production Technology)
- 4.6 Porter's Five Forces Analysis
- 4.6.1 Bargaining Power of Suppliers
- 4.6.2 Bargaining Power of Buyers
- 4.6.3 Threat of New Entrants
- 4.6.4 Threat of Substitutes
- 4.6.5 Degree of Competition
- 4.7 Investment Analysis
5 MARKET SIZE AND GROWTH FORECASTS (VALUES)
- 5.1 By Material Type
- 5.1.1 Cadmium-based II-VI (CdSe, CdS, CdTe)
- 5.1.2 Cadmium-Free III-V (InP, GaAs)
- 5.1.3 Perovskite Quantum Dots
- 5.1.4 Silicon Quantum Dots
- 5.1.5 Graphene and Carbon Quantum Dots
- 5.2 By Device Form Factor
- 5.2.1 QD Films
- 5.2.2 On-Chip Quantum Dots
- 5.2.3 Core-Shell and In-Shell Architectures
- 5.3 By Application
- 5.3.1 Displays
- 5.3.1.1 QD-LCD
- 5.3.1.2 QD-OLED
- 5.3.1.3 Micro-LED Integration
- 5.3.2 Lighting
- 5.3.2.1 General Illumination
- 5.3.2.2 Specialty Lighting
- 5.3.3 Solar Cells and Photovoltaics
- 5.3.4 Medical Imaging and Diagnostics
- 5.3.5 Drug Delivery and Theranostics
- 5.3.6 Sensors and Instruments
- 5.3.7 Quantum Computing and Security
- 5.3.8 Agriculture and Food
- 5.3.9 Others
- 5.3.1 Displays
- 5.4 By End-Use Industry
- 5.4.1 Consumer Electronics
- 5.4.2 Healthcare and Life Sciences
- 5.4.3 Energy and Power
- 5.4.4 Defense and Security
- 5.4.5 Agriculture
- 5.4.6 Others
- 5.5 By Geography
- 5.5.1 North America
- 5.5.1.1 United States
- 5.5.1.2 Canada
- 5.5.1.3 Mexico
- 5.5.2 Europe
- 5.5.2.1 Germany
- 5.5.2.2 United Kingdom
- 5.5.2.3 France
- 5.5.2.4 Nordics
- 5.5.2.5 Rest of Europe
- 5.5.3 South America
- 5.5.3.1 Brazil
- 5.5.3.2 Rest of South America
- 5.5.4 Asia-Pacific
- 5.5.4.1 China
- 5.5.4.2 Japan
- 5.5.4.3 India
- 5.5.4.4 South-East Asia
- 5.5.4.5 Rest of Asia-Pacific
- 5.5.5 Middle East and Africa
- 5.5.5.1 Middle East
- 5.5.5.1.1 Gulf Cooperation Council Countries
- 5.5.5.1.2 Turkey
- 5.5.5.1.3 Rest of Middle East
- 5.5.5.2 Africa
- 5.5.5.2.1 South Africa
- 5.5.5.2.2 Rest of Africa
- 5.5.1 North America
6 COMPETITIVE LANDSCAPE
- 6.1 Market Concentration
- 6.2 Strategic Moves
- 6.3 Market Share Analysis
- 6.4 Company Profiles (includes Global level Overview, Market level overview, Core Segments, Financials as available, Strategic Information, Market Rank/Share for key companies, Products and Services, and Recent Developments)
- 6.4.1 Samsung Electronics Co., Ltd.
- 6.4.2 Nanosys Inc.
- 6.4.3 LG Display Co., Ltd.
- 6.4.4 BOE Technology Group Co., Ltd.
- 6.4.5 Nanoco Group PLC
- 6.4.6 Quantum Materials Corporation
- 6.4.7 UbiQD, Inc.
- 6.4.8 Ocean NanoTech LLC
- 6.4.9 Thermo Fisher Scientific Inc.
- 6.4.10 Merck KGaA
- 6.4.11 Avantama AG
- 6.4.12 Quantum Solutions Inc.
- 6.4.13 QD Laser, Inc.
- 6.4.14 OSRAM Licht AG
- 6.4.15 Sony Corporation
- 6.4.16 TCL CSOT
- 6.4.17 Crystalplex Corporation
- 6.4.18 Evident Technologies
- 6.4.19 NN-Labs (NNCrystal US Corp.)
- 6.4.20 Nanophotonica Inc.
- 6.4.21 Quantum Science Ltd.
- 6.4.22 Toray Industries, Inc.
7 MARKET OPPORTUNITIES AND FUTURE OUTLOOK
- 7.1 White-Space and Unmet-Need Assessment
 量子點市場:按類型、材料、形態和應用分類-2026-2032年全球市場預測
 量子點印刷材料市場預測至2034年—全球量子點材料、印刷方法、油墨配方、基材類型、應用、最終用戶和地區分析
 量子點市場報告:按製造技術、應用、材料、終端用戶產業和地區分類(2026-2034 年)
 量子點市場:依產品類型、應用、國家及地區分類-全球產業分析、市場規模、市場佔有率及2025年至2032年預測
 量子點半導體油墨市場分析及預測(至2035年):依類型、產品類型、服務、技術、組件、應用、材料類型、裝置、製程、最終用戶分類量子點半導體薄膜市場分析及預測(至2035年):依類型、產品、服務、技術、組件、應用、材料類型、裝置、最終用戶及安裝類型分類量子點市場分析及預測(至2035年):依類型、產品類型、服務、技術、組件、應用、材料類型、裝置、最終用戶分類
 全球量子點市場規模、佔有率、趨勢和成長分析報告(2026-2034)
 2026年量子點全球市場報告
 石墨烯量子點市場-全球產業規模、佔有率、趨勢、機會及預測(依材料、顏色類型、應用、產業、地區及競爭格局分類,2021-2031年)