


 |
市場調查報告書
商品編碼
1849893
行動 3D - 市場佔有率分析、產業趨勢、統計數據、成長預測(2025-2030 年)Mobile 3D - Market Share Analysis, Industry Trends & Statistics, Growth Forecasts (2025 - 2030) |
||||||
※ 本網頁內容可能與最新版本有所差異。詳細情況請與我們聯繫。
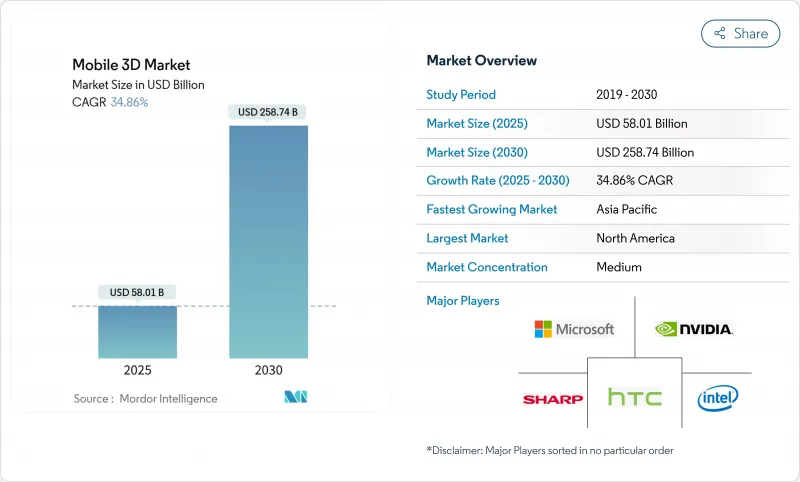
預計2025年移動3D市場規模將達580.1億美元,2030年將達2,587.4億美元,複合年成長率為34.86%。
強勁成長反映了邊緣人工智慧處理與先進深度感知模組的結合,將日常行動裝置轉變為空間運算工具。 OLED 微型顯示器成本的下降正在擴大智慧型手機、折疊式和穿戴式裝置對高解析度空間內容的存取。飛行時間(ToF) 感測器為移動成像提供動力,而光場處理器則以 30 fps 的速度達到 4K 全像影像質量,預示著下一波深度捕捉創新浪潮的到來。企業生產力的提高、擴增實境遊戲的普及以及 5G 網路的推出進一步推動了用戶需求。圍繞 VCSEL 發射器和 SPAD 感測器的供應鏈重組正在重塑零件製造商之間的議價能力,而溫度控管和電池續航力仍然是設計限制因素。
全球行動 3D 市場趨勢與洞察
3D感測相機模組(ToF/結構光)快速普及
飛行時間和結構化光源陣列支援人像影像和擴增實境(AR) 疊加的精確深度捕捉。三星的 ISOCELL Vizion 3D 提高了測距精度,而蘋果的 iPhone 15 Pro 的空間視訊功能則證實了消費者對原生 3D 捕捉的需求。 Meta 的間接 ToF 專利在緊湊的外形規格下改善了運動模糊緩解、電源效率和響應速度。工業領域受益於支援機器人和自動化的物件測量精度。
行動 AR 遊戲和社群媒體濾鏡的激增
Instagram 上流行的 AR 遊戲和人臉濾鏡正在推動 3D 功能的習慣性使用。一項針對 42,000 個 Instagram 特效的學術研究發現,美顏濾鏡佔上傳內容的 20%,這表明對即時臉部增強的需求。愛立信報告稱,5G用戶的穩定頻寬正在推動 AR 應用的顯著成長。高通的裝置穩定擴散技術可在 15 秒內產生逼真的場景,並將創作工具交付給數百萬台裝置。這些進展降低了用戶生成 3D 內容的門檻,並擴大了社群平台的網路效應。
3D硬體和內容創作高成本
Vision Pro 的製造成本高達 1,519 美元,這暴露了微型 OLED 和感測器組裝的高昂成本。此外,它還為內容團隊帶來了陡峭的學習曲線,限制了其在小型工作室的推廣。然而,Howden 報告稱,儘管前期投資較大,但其客製化 AR 工作流程仍顯著節省了維護成本。雖然隨著組件規模的擴大,價格正在下降,但主流用戶的可負擔性仍然是一個中期挑戰,尤其是在功能手機日益被取代的新興市場。
細分分析
到2024年,智慧型手機將佔據行動3D市場的72%,這反映了其主導的裝置量和年度硬體更新周期。旗艦設備目前配備了ToF陣列、AI加速器和OLED顯示螢幕,構成了空間運算藍圖的基準。三星Galaxy S25系列就體現了這一點,它以AI驅動的ProVisual Imaging技術將日常照片轉換為深度映射的3D素材。可折疊設備引入了分層介面,加深了使用者的沉浸感,而平板電腦和筆記型電腦則將3D協作擴展到更大的空間。
AR/VR眼鏡產品雖然目前市場規模較小,但卻是成長最快的領域,複合年成長率高達 36.10%。 Meta 的 Reality Labs 儘管營運虧損 44 億美元,但累計了創紀錄的收益,凸顯了消費者的潛在接受度。 Google和三星將於 2026 年推出 Android XR 眼鏡,彰顯其在平台層面的投入。這些設備將彌合娛樂和企業之間的差距,從身臨其境型遊戲到現場維護覆蓋範圍。隨著市場規模的擴大,預計在預測期內,穿戴式行動 3D 市場規模將縮小與智慧型手機的差距。
到2024年,3D影像感測器將佔行動3D市場規模的46.30%,成為智慧型手機、平板電腦和頭戴式耳機深度捕捉的支柱。SONY在泰國的擴張將確保汽車LiDAR和移動飛行時間(ToF)模組的二極體產能,緩解短期瓶頸。 VCSEL發送器的供應仍然受限,促使OEM盡可能採用雙源採購。
OLED 微型顯示器發展勢頭強勁,年成長率高達 35%。隨著 LG Display 和中國參與企業紛紛增加沉積生產線並縮短前置作業時間,其成本曲線正在向下彎曲。顯示器創新也推動了對專用 3D GPU 和 ISP 的需求,這些 GPU 和 ISP 能夠處理高像素密度,且不會出現指數級延遲。組件成本的下降推動了應用的普及,進而為進一步的製程改進提供資金,從而推動了市場區隔蓬勃發展的創新週期。
行動 3D 市場報告按支援 3D 的行動裝置(智慧型手機、平板電腦等)、裝置組件(3D 影像感測器、3D GPU/ISP 等)、3D 技術(ToF(飛行時間)、結構光等)、3D 應用程式(行動遊戲、地圖和導航、動畫和 3D 內容創建等)和地區進行細分。
區域分析
受商業投資和高額可支配收入的推動,到2024年,北美將佔據40%的行動3D市場佔有率,佔據領先地位。 Meta的累積AR/VR支出超過1000億美元,加速了該地區的研發動能。工業公司報告稱,AR工作流程提高了生產力,消費者也樂於接受配備尖端3D功能的高階智慧型手機。
亞太地區是成長的領跑者,到2030年複合年成長率將達到41.02%。受機器人需求的推動,中國3D工業相機銷售額將在2024年達到23.62億元人民幣(約3.34億美元)。該地區行動端增加價值對GDP的貢獻高達8,800億美元,使其成為供應中心和需求中心。韓國和日本的企業正在推進顯示器和全像處理器的研究,而越南和印度的委託製造將吸收新的AR穿戴式裝置組裝訂單。
在汽車和航太工業的工業 4.0計劃的推動下,歐洲的採用率將穩步提升。相關法規支援安全資料處理,並鼓勵企業嘗試邊緣 AI 3D 工具。中東/非洲和拉丁美洲仍處於起步階段,但隨著 5G 的普及和都市化進程的加快,硬體成本將降低,採用率可能會加速。
其他福利:
- Excel 格式的市場預測 (ME) 表
- 3個月的分析師支持
目錄
第1章 引言
- 研究假設和市場定義
- 調查範圍
第2章調查方法
第3章執行摘要
第4章 市場狀況
- 市場概況
- 市場促進因素
- 智慧型手機普及率上升和向 5G 升級
- 3D感測相機模組(ToF/結構光)快速普及
- 行動 AR 遊戲和社群媒體濾鏡的激增
- 降低成本的OLED微型顯示器可實現空間內容
- 邊緣人工智慧 (Edge-AI) 離線 AR 設備上 3D 重建
- 折疊式和雙螢幕外形推動分層 3D UI
- 市場限制
- 3D硬體和內容創作高成本
- 密集 3D 處理期間的電池消耗和熱限制
- VCSEL供應鏈瓶頸限制感測器輸出
- 缺乏開放、跨平台的 3D 檔案標準
- 價值鏈分析
- 監管格局
- 技術展望
- 波特五力分析
- 供應商的議價能力
- 買家/消費者的議價能力
- 新進入者的威脅
- 替代品的威脅
- 競爭對手之間的競爭
第5章市場規模及成長預測
- 支援 3D 的行動設備
- 智慧型手機
- 折疊式和雙行動電話
- 藥片
- 筆記本
- AR/VR眼鏡產品和頭戴式顯示器
- 其他支援 3D 的設備
- 按設備組件
- 3D影像感測器(ToF、結構光)
- 3D顯示器和OLED微型顯示器
- 深度感測模組和VCSEL
- 3D GPU/ISP
- 軟體 SDK 和中介軟體
- 3D技術
- 飛行時間(ToF)
- 結構光
- 立體視覺
- 光場/全像
- 其他新興技術
- 3D應用
- 手機遊戲
- 地圖和導航
- 動畫和 3D 內容創作
- 廣告和社群媒體過濾器
- 工業和企業 AR
- 其他用途
- 按地區
- 北美洲
- 美國
- 加拿大
- 墨西哥
- 南美洲
- 巴西
- 阿根廷
- 南美洲其他地區
- 歐洲
- 英國
- 德國
- 法國
- 義大利
- 俄羅斯
- 其他歐洲地區
- 亞太地區
- 中國
- 印度
- 日本
- 韓國
- ASEAN
- 其他亞太地區
- 中東和非洲
- 中東
- 沙烏地阿拉伯
- 阿拉伯聯合大公國
- 土耳其
- 其他中東地區
- 非洲
- 南非
- 奈及利亞
- 其他非洲國家
- 北美洲
第6章 競爭態勢
- 市場集中度
- 策略趨勢
- 市佔率分析
- 公司簡介{包括全球概況、市場層級、核心細分市場、可用財務資訊、策略資訊、主要企業的市場排名/佔有率、產品和服務、最新發展等}
- Apple Inc.
- Samsung Electronics Co. Ltd.
- Qualcomm Inc.
- LG Electronics Inc.
- Sony Corporation
- Google LLC
- Huawei Technologies Co. Ltd.
- Intel Corporation
- Nvidia Corporation
- AMS OSRAM AG
- Infineon Technologies AG
- STMicroelectronics NV
- pmdtechnologies ag
- MediaTek Inc.
- Xreal Technology(Formerly Nreal)
- Meta Platforms Inc.
- Xiaomi Corporation
- Oppo Mobile Telecommunications Corp.
- Vivo Communication Technology Co.
- Lenovo Group Limited
- Sharp Corporation
- HTC Corporation
- Hitachi Ltd.
- The 3M Company
第7章 市場機會與未來展望
The Mobile 3D market generated USD 58.01 billion in 2025 and is forecast to reach USD 258.74 billion by 2030, advancing at a 34.86% CAGR.
Robust growth reflects the pairing of edge-AI processing with advanced depth-sensing modules that turn everyday handsets into spatial-computing tools. Declining OLED micro-display costs widen access to high-resolution spatial content across smartphones, foldables, and wearables. Time-of-Flight (ToF) sensors strengthen mobile imaging while Light-Field processors reach 4K hologram quality at 30 fps, signaling the next wave of depth-capture innovation. Enterprise productivity gains, AR gaming uptake, and 5G network rollouts further elevate user demand. Supply-chain reshuffles around VCSEL emitters and SPAD sensors reshape bargaining power among component makers, while thermal management and battery endurance remain design constraints.
Global Mobile 3D Market Trends and Insights
Rapid Adoption of 3D Sensing Camera Modules (ToF / Structured-Light)
Time-of-Flight and structured-light arrays now underpin precise depth capture for portrait imaging and augmented-reality overlays. Sony expanded its Thai laser-diode plant in 2024 to meet surging demand, adding 2,000 jobs to scale VCSEL output.Samsung's ISOCELL Vizion 33D boosts range accuracy, and Apple's spatial-video feature on iPhone 15 Pro underlines consumer appetite for native 3D capture. Meta's indirect-ToF patent improves motion-blur mitigation and power efficiency, enhancing responsiveness in compact form factors. Industrial sectors gain from object measurement precision that supports robotics and automation.
Surge in Mobile AR Gaming and Social-Media Filters
AR games and face filters popularized by Instagram drive habitual use of 3D features. Academic review of 42,000 Instagram effects found beautification filters represented 20% of uploads, illustrating demand for real-time facial augmentation. Ericsson reports that 5G subscribers show materially higher AR engagement due to stable bandwidth. Qualcomm's on-device Stable Diffusion generates photorealistic scenes under 15 seconds, opening creator tools to millions of handsets. These developments lower barriers for user-generated 3D content and amplify network effects across social platforms.
High Cost of 3D Hardware and Content Creation
Vision Pro's manufacturing cost of USD 1,519 exposes the premium burden of micro-OLED and sensor assemblies. Content teams also face steep learning curves, limiting smaller studios. Howden nonetheless reports measurable maintenance savings from custom AR workflows despite upfront spend. Component scale-up is pushing prices lower, yet mainstream affordability remains a mid-term challenge, especially in emerging markets where feature-phone transitions still play out.
Other drivers and restraints analyzed in the detailed report include:
- Edge-AI on-Device 3D Reconstruction for Offline AR
- Cost Decline of OLED Micro-Displays Enabling Spatial Content
- Battery Drain and Thermal Limits in Intensive 3D Processing
For complete list of drivers and restraints, kindly check the Table Of Contents.
Segment Analysis
Smartphones captured 72% of the Mobile 3D market in 2024, reflecting the installed base advantage and annual hardware refresh cycles. Flagship handsets now bundle ToF arrays, AI accelerators, and OLED displays, forming the baseline for spatial computing roadmaps. Samsung's Galaxy S25 series exemplifies this with AI-powered ProVisual imaging that turns everyday photos into depth-mapped 3D assets. Foldables introduce layered interfaces that deepen user immersion, while tablets and notebooks extend 3D collaboration to larger canvases.
AR/VR eyewear commands a smaller numerator today but posts the fastest ascent at 36.10% CAGR. Meta's Reality Labs, despite USD 4.4 billion operating losses, booked record revenue, underscoring latent consumer pull. Google and Samsung will debut Android XR glasses in 2026, signaling platform-level commitment. These devices bridge entertainment and enterprise, from immersive games to on-site maintenance overlays. As volumes scale, the Mobile 3D market size for wearables will close the gap with smartphones over the forecast window.
3D image sensors held 46.30% of the Mobile 3D market size in 2024, serving as the cornerstone for depth capture across phones, tablets, and headsets. Sony's Thai expansion secures diode capacity for both automotive LiDAR and mobile ToF modules, easing short-term bottlenecks. VCSEL emitters remain supply-constrained, prompting OEMs to dual-source where possible.
OLED micro-displays are the momentum story, growing 35% annually. Cost curves bend downward as LG Display and Chinese entrants ramp deposition lines, shortening lead times. Display innovation also spurs demand for dedicated 3D GPUs and ISPs that manage higher pixel densities without latency spikes. The components segment illustrates a virtuous loop: lower part costs lift adoption, which in turn funds further process improvements, keeping the Mobile 3D market innovation cycle brisk.
The Mobile 3D Market Report is Segmented by 3D Enabled Mobile Devices (Smartphones, Tablets, and More), Device Components (3D Image Sensors, 3D GPUs/ISPs, and More), 3D Technology (Time-Of-Flight (ToF), Structured-Light, and More), 3D Applications (Mobile Gaming, Maps and Navigation, Animations and 3D Content Creation, and More), and Geography.
Geography Analysis
North America led with a 40% Mobile 3D market share in 2024, buoyed by enterprise investments and high discretionary income. Meta's cumulative AR/VR outlay topping USD 100 billion amplifies regional R&D momentum. Industrial firms report productivity gains from AR-enabled workflows, while consumers readily adopt premium smartphones that showcase bleeding-edge 3D features.
Asia Pacific is the growth pacesetter at a 41.02% CAGR through 2030. China's 3D industrial camera revenue reached CNY 2.362 billion (USD 334 million) in 2024 on the back of robotics demand. The region contributes USD 880 billion of mobile value-added to GDP, positioning it as both supplier and demand center. Korean and Japanese firms push display and holo-processor research, while contract manufacturers in Vietnam and India absorb new assembly mandates for AR wearables.
Europe records steady take-up driven by Industry 4.0 projects in automotive and aerospace. Regulation supports secure data handling, encouraging enterprises to trial edge-AI 3D tools. Middle East and Africa and Latin America remain nascent Mobile 3D markets, yet rising 5G penetration and urbanization lay groundwork for accelerated adoption once hardware costs dip.
- Apple Inc.
- Samsung Electronics Co. Ltd.
- Qualcomm Inc.
- LG Electronics Inc.
- Sony Corporation
- Google LLC
- Huawei Technologies Co. Ltd.
- Intel Corporation
- Nvidia Corporation
- AMS OSRAM AG
- Infineon Technologies AG
- STMicroelectronics N.V.
- pmdtechnologies ag
- MediaTek Inc.
- Xreal Technology (Formerly Nreal)
- Meta Platforms Inc.
- Xiaomi Corporation
- Oppo Mobile Telecommunications Corp.
- Vivo Communication Technology Co.
- Lenovo Group Limited
- Sharp Corporation
- HTC Corporation
- Hitachi Ltd.
- The 3M Company
Additional Benefits:
- The market estimate (ME) sheet in Excel format
- 3 months of analyst support
TABLE OF CONTENTS
1 INTRODUCTION
- 1.1 Study Assumptions and Market Definition
- 1.2 Scope of the Study
2 RESEARCH METHODOLOGY
3 EXECUTIVE SUMMARY
4 MARKET LANDSCAPE
- 4.1 Market Overview
- 4.2 Market Drivers
- 4.2.1 Rise in smartphone penetration and 5G upgrades
- 4.2.2 Rapid adoption of 3D sensing camera modules (ToF / Structured-Light)
- 4.2.3 Surge in mobile AR gaming and social-media filters
- 4.2.4 Cost decline of OLED micro-displays enabling spatial content
- 4.2.5 Edge-AI on-device 3D reconstruction for offline AR
- 4.2.6 Foldable and dual-screen form-factors driving layered 3D UI
- 4.3 Market Restraints
- 4.3.1 High cost of 3D hardware and content creation
- 4.3.2 Battery drain and thermal limits in intensive 3D processing
- 4.3.3 VCSEL supply-chain bottlenecks limiting sensor output
- 4.3.4 Lack of open, cross-platform 3D file standards
- 4.4 Value Chain Analysis
- 4.5 Regulatory Landscape
- 4.6 Technological Outlook
- 4.7 Porter's Five Forces Analysis
- 4.7.1 Bargaining Power of Suppliers
- 4.7.2 Bargaining Power of Buyers/Consumers
- 4.7.3 Threat of New Entrants
- 4.7.4 Threat of Substitute Products
- 4.7.5 Intensity of Competitive Rivalry
5 MARKET SIZE AND GROWTH FORECASTS (VALUE)
- 5.1 By 3D Enabled Mobile Devices
- 5.1.1 Smartphones
- 5.1.2 Foldable and Dual-Screen Phones
- 5.1.3 Tablets
- 5.1.4 Notebooks
- 5.1.5 AR/VR Eyewear and Head-Mounted Displays
- 5.1.6 Other 3D-Enabled Devices
- 5.2 By Device Components
- 5.2.1 3D Image Sensors (ToF, Structured-Light)
- 5.2.2 3D Displays and OLED Micro-Displays
- 5.2.3 Depth-Sensing Modules and VCSELs
- 5.2.4 3D GPUs / ISPs
- 5.2.5 Software SDKs and Middleware
- 5.3 By 3D Technology
- 5.3.1 Time-of-Flight (ToF)
- 5.3.2 Structured-Light
- 5.3.3 Stereo Vision
- 5.3.4 Light-Field / Holographic
- 5.3.5 Other Emerging Technologies
- 5.4 By 3D Applications
- 5.4.1 Mobile Gaming
- 5.4.2 Maps and Navigation
- 5.4.3 Animations and 3D Content Creation
- 5.4.4 Advertising and Social-Media Filters
- 5.4.5 Industrial and Enterprise AR
- 5.4.6 Other Applications
- 5.5 By Geography
- 5.5.1 North America
- 5.5.1.1 United States
- 5.5.1.2 Canada
- 5.5.1.3 Mexico
- 5.5.2 South America
- 5.5.2.1 Brazil
- 5.5.2.2 Argentina
- 5.5.2.3 Rest of South America
- 5.5.3 Europe
- 5.5.3.1 United Kingdom
- 5.5.3.2 Germany
- 5.5.3.3 France
- 5.5.3.4 Italy
- 5.5.3.5 Russia
- 5.5.3.6 Rest of Europe
- 5.5.4 Asia Pacific
- 5.5.4.1 China
- 5.5.4.2 India
- 5.5.4.3 Japan
- 5.5.4.4 South Korea
- 5.5.4.5 ASEAN
- 5.5.4.6 Rest of Asia Pacific
- 5.5.5 Middle East and Africa
- 5.5.5.1 Middle East
- 5.5.5.1.1 Saudi Arabia
- 5.5.5.1.2 United Arab Emirates
- 5.5.5.1.3 Turkey
- 5.5.5.1.4 Rest of Middle East
- 5.5.5.2 Africa
- 5.5.5.2.1 South Africa
- 5.5.5.2.2 Nigeria
- 5.5.5.2.3 Rest of Africa
- 5.5.1 North America
6 COMPETITIVE LANDSCAPE
- 6.1 Market Concentration
- 6.2 Strategic Moves
- 6.3 Market Share Analysis
- 6.4 Company Profiles {includes Global level Overview, Market level overview, Core Segments, Financials as available, Strategic Information, Market Rank/Share for key companies, Products and Services, and Recent Developments}
- 6.4.1 Apple Inc.
- 6.4.2 Samsung Electronics Co. Ltd.
- 6.4.3 Qualcomm Inc.
- 6.4.4 LG Electronics Inc.
- 6.4.5 Sony Corporation
- 6.4.6 Google LLC
- 6.4.7 Huawei Technologies Co. Ltd.
- 6.4.8 Intel Corporation
- 6.4.9 Nvidia Corporation
- 6.4.10 AMS OSRAM AG
- 6.4.11 Infineon Technologies AG
- 6.4.12 STMicroelectronics N.V.
- 6.4.13 pmdtechnologies ag
- 6.4.14 MediaTek Inc.
- 6.4.15 Xreal Technology (Formerly Nreal)
- 6.4.16 Meta Platforms Inc.
- 6.4.17 Xiaomi Corporation
- 6.4.18 Oppo Mobile Telecommunications Corp.
- 6.4.19 Vivo Communication Technology Co.
- 6.4.20 Lenovo Group Limited
- 6.4.21 Sharp Corporation
- 6.4.22 HTC Corporation
- 6.4.23 Hitachi Ltd.
- 6.4.24 The 3M Company
7 MARKET OPPORTUNITIES AND FUTURE OUTLOOK
- 7.1 White-space and Unmet-need Assessment
 3D地圖和建模市場:2026-2032年全球市場預測(按技術、定價模式、應用、最終用戶、部署類型和行業分類)
 2026年全球行動3D市場報告2026年全球3D地圖繪製與建模市場報告
 3D地圖繪製和建模市場規模、佔有率、趨勢和預測:按組件、應用、最終用戶行業和地區分類,2026-2034年
 遊戲領域3D地圖和建模市場規模、佔有率和成長分析:按組件、技術、部署模式、平台、應用、企業規模和地區分類 - 產業預測 2026-2033
 2026-2030年全球3D地圖繪製與建模市場
 2035年3D地圖繪製與建模市場分析及預測:按類型、產品類型、服務、技術、組件、應用、部署類型、最終用戶和功能分類
 3D地圖繪製和3D建模:市場佔有率分析、行業趨勢和統計數據、成長預測(2026-2031年)
 全球3D地圖繪製與建模市場規模、佔有率、趨勢及成長分析報告(2026-2034年)全球3D建模、3D視覺化和3D資料擷取市場規模、佔有率、趨勢和成長分析報告(2026-2034年)