


 |
市場調查報告書
商品編碼
1849877
稀土元素:市場佔有率分析、產業趨勢、統計數據和成長預測(2025-2030 年)Rare Earth Elements - Market Share Analysis, Industry Trends & Statistics, Growth Forecasts (2025 - 2030) |
||||||
※ 本網頁內容可能與最新版本有所差異。詳細情況請與我們聯繫。
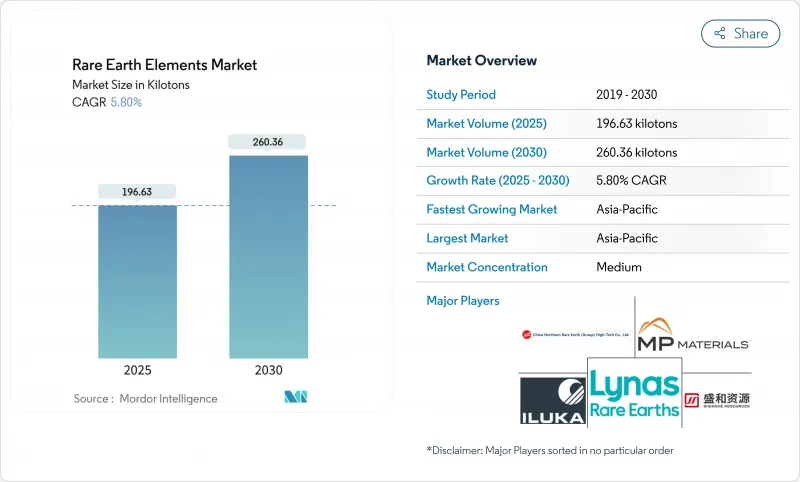
2025 年稀土元素市場價值為 196.63 千噸,預計到 2030 年將達到 260.36 千噸,預測期內複合年成長率為 5.80%。
清潔能源技術、消費性電子產品和國防平台的強勁需求將繼續推動釹鐵硼磁鐵的生產,而電動車的快速普及如果沒有新的產能和大規模回收利用,到2036年,其產量可能會超過目前的釹鐵硼磁鐵產量。由於中國的主導地位,亞太地區仍然是釹鐵硼磁體的生產和加工中心,但來自美國、加拿大和歐盟的政策支持正在開闢投資管道,從而降低市場集中風險。高性能釹鐵硼磁鐵是電動車牽引馬達和直驅風力發電機的關鍵元件,因此磁體應用領域將迎來最強勁的成長,預計複合年成長率將達到8.02%。日益加劇的地緣政治摩擦正促使西方國家政府補貼國內計劃。光是美國國防部自2020年以來就已撥款超過4.39億美元用於加強其供應鏈。
全球稀土元素市場趨勢及洞察
新興國家需求旺盛
隨著各國政府加快工業化進程和可再生能源部署,新興市場消費量正在成長。儘管國內消費放緩,中國仍計劃在2024年增加出口,掩蓋了長期供應限制。印度透過印度稀土有限公司計劃在2032年將其精煉產量提高兩倍,從而降低進口依賴,增強區域自主能力。非洲國家的目標是2029年提供全球9%的稀土供應,新增低成本產能將有助於緩解物價上漲。這些供應側舉措與該地區電動車、電子產品和風力發電機組裝廠不斷成長的需求相輔相成。其結果是降低了國家集中度,但下游用戶面臨更高的整合門檻。
綠色科技對稀土元素的依賴
風力發電機、電動車牽引馬達和節能照明設備都需要大量的釹、镨、鏑和鋱。歐盟委員會預測,到2030年和2050年,這些稀土元素的需求量將分別成長4.5倍和5.5倍。離岸風力發電機每台都使用數公斤的釹磁鐵,在低轉速下即可產生高扭力。在微軟氣候創新基金的投資下, 封閉式 Materials公司開發了一種工藝,可以從廢棄硬碟中回收高達85%的稀土元素。這項閉迴路製程的成功商業化將降低原物料風險,並從長遠來看,有助於中國更好地控制稀土供應。
分離設施和放射性廢棄物管理的高資本投入
建造獨立的氧化物分離純化設施需要專門的溶劑萃取迴路和用於處理含釷鈾殘渣的密封系統。這些要求會使營運成本增加15-20%,阻礙了中國以外的先行者。廣州的一個研究團隊已展示了一種電動力採礦技術,其回收率高達95%,氨排放減少了95%,為符合西方更嚴格的環境法規提供了一條可行的途徑。然而,對於中國以外的營運商而言,籌集足夠的資金並降低該技術商業化應用的風險是目前面臨的直接挑戰。
細分市場分析
由於輕稀土稀土元素相對豐富且開採成本低廉,預計到2024年將佔全球稀土總量的80%。受磨料粉末、FCC催化劑和釹鐵硼磁體原料等需求的推動,預計到2030年,輕稀土元素市場規模將以5.98%的複合年成長率成長。歐洲和北美的回收利用計畫正逐步將廢棄物分流,生產出可抑制原生礦開採成長的再生材料。重稀土元素,例如鏑、鋱和釔,雖然單位價值高,但地質儲量稀少。正在進行的電動力浸出初步試驗表明,該方法回收率高達95%,能源消耗降低60%,預計將縮小不同類型產品之間的生產成本差距,並重塑長期供應經濟格局。
電動車需求、風電部署和國防採購等次要因素持續為兩種稀土礦的價格提供強勁訊號。然而,計劃資金籌措更傾向於輕稀土元素礦床,因為輕稀土礦床更容易冶金,且投產週期更短。預計重稀土的生產將主要受高溫磁鐵、雷射晶體和磷光體特殊用途需求的驅動,從而維持稀土市場收入結構的平衡。
到2024年,鈰將佔據40%的市場佔有率,這主要得益於其在玻璃拋光粉和汽車催化劑的應用。高等經濟大學(HSE University)的實驗產生了可調諧的黃色發光,為照明和顯示領域的應用開闢了道路,並有望擴大鈰的潛在市場。釹將以9.20%的複合年成長率實現最快成長,因為電動車牽引馬達和渦輪發電機需要消耗大量的磁性合金。 MP Materials公司於2025年1月在其位於德克薩斯的工廠開始商業化生產釹镨(NdPr),這是重建美國從礦山到磁性材料供應鏈的關鍵里程碑。
鋱和鏑因其在離岸風力發電和國防裝備領域對高矯頑力磁體的需求穩定,但冶金製程的複雜性限制了其產量。鈧正日益受到關注,盧薩爾公司預計將於2025年開始生產氧化鈧,這將降低航太級鋁鈧合金的原料成本,並加速其在民航機的應用。整體而言,多種元素的融合支撐著稀土元素市場穩健的利潤結構。
區域分析
亞太地區依託中國集採礦、分離及磁體製造於一體的綜合體系,預計2024年將佔全球總產量的86%。受電動車和家用電子電器產能持續擴張的推動,該地區預計到2030年將以5.92%的複合年成長率成長。日本和韓國計畫在2025年前深化電池和磁鐵供應鏈共用資料平台的合作,以增強供應鏈的韌性。
北美是關鍵區域,擁有旨在加速新礦、煉油廠和磁選廠建設進度的政策獎勵。自2020年以來,美國國防部已投入超過4.39億美元用於加強國內能力建設,其中MP Materials公司的Mountain Pass綜合設施為德克薩斯州的下游業務提供原料。加拿大的「關鍵礦產藍圖」透過資助探勘和試點分離中心,並建立一體化的北美大陸價值鏈,與美國的目標相輔相成。
《歐洲關鍵材料法案》設定了2030年開採、加工和回收的量化目標,鼓勵投資挪威、瑞典和法國的礦床以及英國的回收業務。然而,授權障礙和當地民眾的反對仍然阻礙待開發區的核准。隨著布隆迪、坦尚尼亞和南非計劃的推進,非洲的貢獻正在不斷成長。 2029年,非洲大陸預計將滿足全球9%的需求,從而實現貿易流向多元化並降低單一供應商風險。
其他福利:
- Excel格式的市場預測(ME)表
- 3個月的分析師支持
目錄
第1章 引言
- 研究假設和市場定義
- 調查範圍
第2章調查方法
第3章執行摘要
第4章 市場情勢
- 市場概覽
- 市場促進因素
- 新興國家需求旺盛
- 「綠色技術」對稀土元素的依賴
- 永磁電動汽車馬達在亞洲正迅速普及。
- 航太製造中的鈧鋁合金
- 家用電器需求旺盛
- 市場限制
- 分離設施和放射性廢棄物管理方面的高額資本投入成本
- 中國政策變動引發的價格波動
- 稀土元素供應不穩定
- 價值鏈分析
- 波特五力模型
- 供應商的議價能力
- 消費者議價能力
- 新進入者的威脅
- 替代品的威脅
- 競爭程度
第5章 市場規模與成長預測
- 依產品類型
- 輕稀土元素
- 重稀土元素
- 按元素
- 鈰
- 氧化物
- 硫化物
- 其他化合物
- 釹
- 合金
- 鑭
- 合金
- 氧化物
- 其他化合物
- 鎝
- 鋱
- 釔
- 鈧
- 其他元素
- 鈰
- 透過使用
- 催化劑
- 陶瓷
- 磷光體
- 玻璃和拋光
- 冶金
- 磁鐵
- 其他用途
- 按最終用途行業分類
- 清潔能源
- 家用電器
- 航太與國防
- 工業自動化
- 衛生保健
- 其他
- 按地區
- 亞太地區
- 中國
- 印度
- 日本
- 韓國
- 澳洲
- 亞太其他地區
- 北美洲
- 美國
- 加拿大
- 墨西哥
- 歐洲
- 德國
- 英國
- 法國
- 義大利
- 北歐國家
- 其他歐洲地區
- 南美洲
- 巴西
- 阿根廷
- 其他南美洲
- 中東和非洲
- 沙烏地阿拉伯
- 阿拉伯聯合大公國
- 南非
- 其他中東和非洲地區
- 亞太地區
第6章 競爭情勢
- 市場集中度
- 策略趨勢
- 市佔率分析
- 公司簡介
- Appia REU
- China Rare Earth Group Resources Technology Co., Ltd.
- China Rare Earth Holdings Limited
- ChinaTungsten
- Energy Fuels Inc.
- Iluka Resources Limited
- Jiangxi Copper Corporation
- Lynas Rare Earths Ltd
- Mitsubishi Corporation RtM Japan Ltd.
- MP Materials
- Northern Minerals
- Northern Rare Earth
- Rio Tinto
- Shenghe Resources Holding Co., Ltd.
- Ucore Rare Metals Inc.
- Yuyan Rare Earth New Materials Co., Ltd.
第7章 市場機會與未來展望
The rare earth metals market stood at 196.63 kilotons in 2025 and is projected to reach 260.36 kilotons by 2030, expanding at a 5.80% CAGR over the forecast period.
Robust demand from clean-energy technologies, consumer devices, and defense platforms continues to lift volumes, while the rapid scale-up of electric vehicles (EVs) threatens to outstrip current neodymium and praseodymium production by 2036 if new capacity or large-scale recycling fails to materialize. Asia-Pacific remains the production and processing hub, anchored by China's dominant position, yet policy support in the United States, Canada, and the European Union is opening investment pathways that could reduce concentration risk. Magnet applications post the strongest growth because high-performance NdFeB magnets are indispensable in EV traction motors and direct-drive wind turbines, giving this segment an 8.02% forecast CAGR. Mounting geopolitical friction is prompting Western governments to subsidize domestic projects; the U.S. Department of Defense alone has committed more than USD 439 million since 2020 to shore up supply chains.
Global Rare Earth Elements Market Trends and Insights
High Demand from Emerging Economies
Emerging markets are lifting consumption as governments accelerate industrialization and renewable-energy deployment. China increased export volumes in 2024 despite slower domestic use, masking tightening long-term supply. India intends to triple refined output by 2032 through Indian Rare Earths Limited, lowering import dependency and bolstering regional self-reliance. African nations collectively aim to deliver 9% of global supply by 2029, adding new low-cost tonnage that could temper price spikes. These supply-side moves are coupled with demand growth from regional EV, electronics, and wind-turbine assembly plants. The resulting realignment lessens single-country concentration yet raises integration hurdles for downstream users.
Dependency of Green Technology on Rare Earth Elements
Wind turbines, EV traction motors, and energy-efficient lighting require large volumes of neodymium, praseodymium, dysprosium, and terbium. The European Commission projects demand to rise 4.5 to 5.5 times by 2030 and 2050, respectively. Each offshore wind turbine contains kilograms of NdFeB magnets that deliver high torque at low rotational speeds. Recycling breakthroughs are gaining traction; Cyclic Materials attracted investment from Microsoft's Climate Innovation Fund to scale a process that recovers up to 85% of rare earths from discarded hard drives. Successful commercialization of closed-loop flows will cushion raw-material risk and loosen China's grip on supply over the long term.
High Capex & Radioactive Waste-Management Costs for Separation Facilities
Building a standalone separation and oxide refinery demands specialized solvent-extraction circuits and containment systems for thorium- and uranium-bearing residues. These requirements raise operating costs by 15-20%, deterring first-movers outside China. Research groups in Guangzhou demonstrated an electrokinetic mining technique that delivers 95% recovery and cuts ammonia emissions by 95%, offering a viable pathway to comply with stricter Western environmental rules. Mobilizing sufficient funding and de-risking the technology at commercial scale remain near-term hurdles for non-Chinese operators.
Other drivers and restraints analyzed in the detailed report include:
- Rapid Penetration of Permanent-Magnet EV Motors across Asia
- Scandium-Aluminum Alloys Adoption in Aerospace Manufacturing
- Price Volatility Linked to Chinese Policy Shifts
For complete list of drivers and restraints, kindly check the Table Of Contents.
Segment Analysis
Light rare earths, supplied 80% of global tonnage in 2024 because of their relative abundance and lower mining costs. The rare earth metals market size for light REEs is projected to expand at 5.98% CAGR to 2030, driven by polishing powders, FCC catalysts, and NdFeB magnet feedstock. Recycling programs in Europe and North America are beginning to divert waste streams, creating secondary feed that mildly tempers virgin-ore growth. Heavy rare earths such as dysprosium, terbium, and yttrium deliver higher unit value but face geological scarcity. Ongoing pilot trials in electrokinetic leaching show 95% recovery with 60% lower power use, potentially narrowing production-cost gaps between product types and reshaping long-term supply economics.
Second-order effects from EV demand, wind-energy roll-outs, and defense procurement maintain strong price signals for both classes. Yet project financing remains skewed toward light REE deposits because of easier metallurgy and shorter ramp-up timelines. Heavy-REE output is expected to track specialty demand in high-temperature magnets, laser crystals, and phosphors, supporting a balanced revenue mix across the rare earth metals market.
Cerium controlled a 40% share in 2024 on the back of glass-polishing powders and autocatalyst use. Experimentation at HSE University produced tunable yellow luminescence, opening potential lighting and display applications that could broaden cerium's addressable market. Neodymium registers the fastest growth at 9.20% CAGR as EV traction motors and turbo-generators soak up magnet alloy feed. MP Materials began commercial NdPr metal pours at its Texas facility in January 2025, an essential milestone in rebuilding the United States' mine-to-magnet supply chain.
Terbium and dysprosium enjoy stable demand in high-coercivity magnets for offshore wind and defense gear, yet output is constrained by metallurgical complexity. Scandium's profile is rising; Rusal expects to initiate scandium oxide production in 2025, lowering the input cost of aerospace-grade Al-Sc alloys and accelerating adoption in commercial aircraft. Altogether, diversified element uptake underpins a resilient revenue structure for the rare earth metals market.
The Rare Earth Metals Market Report Segments the Industry by Product Type (Light Rare Earth Elements and Heavy Rare Earth Elements), Element (Cerium, Neodymium, and More), Application (Catalysts, Ceramics, and More), End-Use Industry (Clean Energy, Consumer Electronics, and More), and Geography (Asia-Pacific, North America, Europe, South America, Middle East and Africa). The Market Forecasts are Provided in Terms of Volume (tons).
Geography Analysis
Asia-Pacific produced 86% of global output in 2024, anchored by China's integrated mining, separation, and magnet manufacturing complex. The region is forecast to grow at 5.92% CAGR to 2030 on relentless EV and consumer-electronics capacity expansions. Japan and South Korea deepen collaboration on shared data platforms for battery and magnet supply chains to increase resilience by 2025.
North America is the significant region as policy incentives compress timelines for new mines, refineries, and magnet plants. The U.S. Department of Defense has dispersed more than USD 439 million since 2020 to strengthen domestic capabilities, and MP Materials' Mountain Pass complex feeds downstream operations in Texas. Canada's critical-minerals roadmap complements U.S. goals by funding exploration and pilot separation hubs, creating an integrated continental value chain.
Europe's Critical Raw Materials Act sets quantitative targets for mining, processing, and recycling by 2030, catalyzing investment in Norwegian, Swedish, and French deposits alongside UK-based recycling ventures. However, greenfield mine approvals remain slow because of permitting hurdles and local opposition. Africa's contribution grows as projects in Burundi, Tanzania, and South Africa progress; the continent could supply 9% of global demand by 2029, diversifying trade flows and reducing single-supplier risk.
- Appia REU
- China Rare Earth Group Resources Technology Co., Ltd.
- China Rare Earth Holdings Limited
- ChinaTungsten
- Energy Fuels Inc.
- Iluka Resources Limited
- Jiangxi Copper Corporation
- Lynas Rare Earths Ltd
- Mitsubishi Corporation RtM Japan Ltd.
- MP Materials
- Northern Minerals
- Northern Rare Earth
- Rio Tinto
- Shenghe Resources Holding Co., Ltd.
- Ucore Rare Metals Inc.
- Yuyan Rare Earth New Materials Co., Ltd.
Additional Benefits:
- The market estimate (ME) sheet in Excel format
- 3 months of analyst support
TABLE OF CONTENTS
1 Introduction
- 1.1 Study Assumptions and Market Definition
- 1.2 Scope of the Study
2 Research Methodology
3 Executive Summary
4 Market Landscape
- 4.1 Market Overview
- 4.2 Market Drivers
- 4.2.1 High Demand from Emerging Economies
- 4.2.2 Dependency of 'Green Technology' on Rare Earth Elements
- 4.2.3 Rapid Penetration of Permanent-Magnet EV Motors across Asia
- 4.2.4 Scandium-Aluminum Alloys Adoption in Aerospace Manufacturing
- 4.2.5 High Demand in Consumer Electronics
- 4.3 Market Restraints
- 4.3.1 High Capex and Radioactive Waste Management Costs for Separation Facilities
- 4.3.2 Price Volatility Linked to Chinese Policy Shifts
- 4.3.3 Inconsistent Supply of Rare Earth Elements
- 4.4 Value Chain Analysis
- 4.5 Porter's Five Forces
- 4.5.1 Bargaining Power of Suppliers
- 4.5.2 Bargaining Power of Consumers
- 4.5.3 Threat of New Entrants
- 4.5.4 Threat of Substitutes
- 4.5.5 Degree of Competition
5 Market Size and Growth Forecasts (Volume)
- 5.1 By Product Type
- 5.1.1 Light Rare Earth Elements
- 5.1.2 Heavy Rare Earth Elements
- 5.2 By Element
- 5.2.1 Cerium
- 5.2.1.1 Oxide
- 5.2.1.2 Sulfide
- 5.2.1.3 Other Compounds
- 5.2.2 Neodymium
- 5.2.2.1 Alloy
- 5.2.3 Lanthanum
- 5.2.3.1 Alloy
- 5.2.3.2 Oxide
- 5.2.3.3 Other Compounds
- 5.2.4 Dysprosium
- 5.2.5 Terbium
- 5.2.6 Yttrium
- 5.2.7 Scandium
- 5.2.8 Other Elements
- 5.2.1 Cerium
- 5.3 By Application
- 5.3.1 Catalysts
- 5.3.2 Ceramics
- 5.3.3 Phosphors
- 5.3.4 Glass and Polishing
- 5.3.5 Metallurgy
- 5.3.6 Magnets
- 5.3.7 Other Applications
- 5.4 By End-use Industry
- 5.4.1 Clean Energy
- 5.4.2 Consumer Electronics
- 5.4.3 Aerospace and Defense
- 5.4.4 Industrial Automation
- 5.4.5 Healthcare
- 5.4.6 Others
- 5.5 By Geography
- 5.5.1 Asia-Pacific
- 5.5.1.1 China
- 5.5.1.2 India
- 5.5.1.3 Japan
- 5.5.1.4 South Korea
- 5.5.1.5 Australia
- 5.5.1.6 Rest of Asia-Pacific
- 5.5.2 North America
- 5.5.2.1 United States
- 5.5.2.2 Canada
- 5.5.2.3 Mexico
- 5.5.3 Europe
- 5.5.3.1 Germany
- 5.5.3.2 United Kingdom
- 5.5.3.3 France
- 5.5.3.4 Italy
- 5.5.3.5 Nordics
- 5.5.3.6 Rest of Europe
- 5.5.4 South America
- 5.5.4.1 Brazil
- 5.5.4.2 Argentina
- 5.5.4.3 Rest of South America
- 5.5.5 Middle East and Africa
- 5.5.5.1 Saudi Arabia
- 5.5.5.2 United Arab Emirates
- 5.5.5.3 South Africa
- 5.5.5.4 Rest of Middle East and Africa
- 5.5.1 Asia-Pacific
6 Competitive Landscape
- 6.1 Market Concentration
- 6.2 Strategic Moves
- 6.3 Market Share Analysis
- 6.4 Company Profiles (includes Global level Overview, Market level overview, Core Segments, Financials as available, Strategic Information, Market Rank/Share for key companies, Products and Services, and Recent Developments)
- 6.4.1 Appia REU
- 6.4.2 China Rare Earth Group Resources Technology Co., Ltd.
- 6.4.3 China Rare Earth Holdings Limited
- 6.4.4 ChinaTungsten
- 6.4.5 Energy Fuels Inc.
- 6.4.6 Iluka Resources Limited
- 6.4.7 Jiangxi Copper Corporation
- 6.4.8 Lynas Rare Earths Ltd
- 6.4.9 Mitsubishi Corporation RtM Japan Ltd.
- 6.4.10 MP Materials
- 6.4.11 Northern Minerals
- 6.4.12 Northern Rare Earth
- 6.4.13 Rio Tinto
- 6.4.14 Shenghe Resources Holding Co., Ltd.
- 6.4.15 Ucore Rare Metals Inc.
- 6.4.16 Yuyan Rare Earth New Materials Co., Ltd.
7 Market Opportunities and Future Outlook
- 7.1 White-space and Unmet-need Assessment
 稀土 (REE) 回收市場預測(至 2032 年):按來源、元素類型、技術、應用和地區分類的全球分析
 高科技產業稀土:中國貿易禁令下的市場分析與預測
 稀土元素市場按元素類型、產品類型、形態、分離技術、來源、加工階段、純度等級、應用和最終用途產業分類-2025-2030 年全球預測釔箔市場(按產品類型、厚度、形狀、純度、最終用途產業和分銷管道)—2025-2030 年全球預測鉺箔市場(按厚度、純度、應用和銷售管道)——2025-2030 年全球預測鎦箔市場按產品類型、形狀、純度等級、厚度、製造技術、應用和最終用途產業分類-2025-2030 年全球預測
 稀土元素市場-全球產業規模、佔有率、趨勢、機會及預測(細分、按類型、按應用、按地區、按競爭,2020-2030 年預測)
 2025年稀土元素全球市場報告
 稀土產業趨勢:中國對美國及2025年的全球展望釔金屬市場-全球產業規模、佔有率、趨勢、機會及預測(按銷售管道、最終用途、地區和競爭細分,2020-2030 年)