


 |
市場調查報告書
商品編碼
1849868
地理空間分析:市場佔有率分析、產業趨勢、統計數據和成長預測(2025-2030)Geospatial Analytics - Market Share Analysis, Industry Trends & Statistics, Growth Forecasts (2025 - 2030) |
||||||
※ 本網頁內容可能與最新版本有所差異。詳細情況請與我們聯繫。
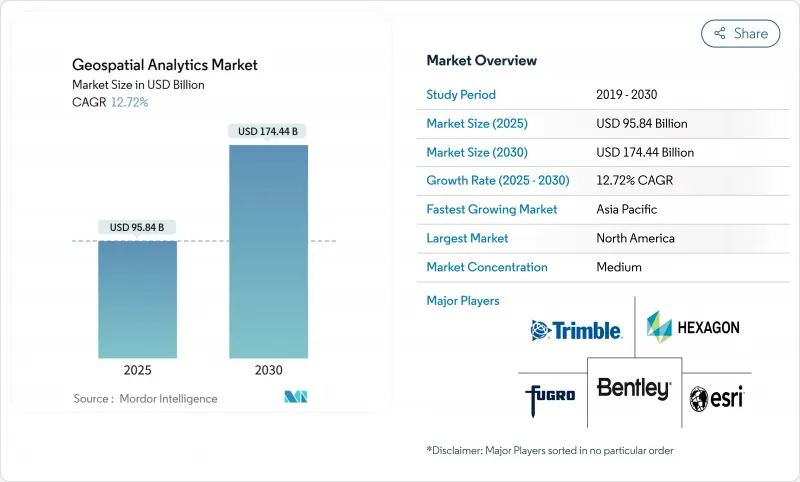
預計 2025 年地理空間分析市場價值將達到 958.4 億美元,到 2030 年預計將達到 1,744.4 億美元,複合年成長率為 12.72%。
基於位置的洞察需求不斷成長,衛星星系的快速推出以及對智慧城市的投資,使該領域成為數位轉型的重要支柱。隨著人工智慧實現特徵提取和預測建模的自動化,企業正在利用空間智慧來提高營運效率、降低風險並簡化策略決策。政府對數位孿生的獎勵策略、5G的推出以及邊緣運算在本地處理感測器數據的能力將進一步推動其應用。同時,日益嚴格的隱私保護條例和來自硬體供應鏈的壓力正在抑製成長,但整體上升趨勢並未放緩。
全球地理空間分析市場趨勢與洞察
採用智慧城市計劃
隨著市政當局尋求即時了解交通、能源和公用事業,城市的數位雙胞胎舉措正在推動對地理空間分析的需求。日本的 PLATEAU計劃正在提供 200 多個城市的 3D 模型,以支援防災和土地利用規劃。中國的數位基礎設施任務正在將標準化的空間框架嵌入地方政府,並推動持續的平台採購。英國的公共部門地理空間協議已獲得 10 億英鎊用於地下資產測繪,最大限度地減少了施工罷工和維護延誤。歐洲市政地方政府也在使用數位雙胞胎來追蹤碳中和進展,並加強永續性目標與智慧定位之間的聯繫。這些項目維持多年的採購週期,並將空間分析深入市政運作。
5G定位服務整合
5G 的亞米級定位精度和毫秒延遲將解鎖即時地理空間應用,從動態交通編配到無人機自主導航。與基地台共置的邊緣運算將在本地處理影像和感測器數據,確保遵守醫療保健和國防領域的數據主權規則。零售商將採用室內定位進行消費者導航,工廠將在沒有 GPS 的情況下最佳化資產追蹤。 5G 與人工智慧的協同作用將縮短從偵測到決策的週期,從而提升人們對始終在線、情境感知的空間服務的期望。
成本高且操作複雜
對於預算購買高精度雷射雷達 (LiDAR) 的公司來說,進入門檻仍然很高,每台掃描器的成本高達 15 萬美元,年度軟體許可證費用接近 5 萬美元。整合衛星、無人機和傳統 GIS 檔案需要稀缺技能。地理空間資料科學家的薪資要高出 20-30%。公司將大量計劃時間用於協調座標系統和統一格式,從而減慢了價值實現速度。訂閱可以減少資本支出,而全面分析則會使營運運作飆升。培訓計畫和認證每年使每位員工增加 1-2.5 萬美元,給中小企業的預算帶來壓力。
細分分析
服務市場預計將以 12.9% 的複合年成長率成長,這反映出隨著企業採用日益複雜的空間解決方案,技能差距正在擴大。到 2024 年,軟體將保持 42.7% 的地理空間分析市場佔有率,但買家目前優先考慮諮詢和託管服務,以加速部署。由於感測器價格下降和衛星規模擴張,硬體銷售保持強勁,但隨著商品化的持續推進,成長正在放緩。
託管分析的使用日益增多,標誌著從許可證所有權到基於績效的合約的轉變。 CARTO 與 Indigo Ag 的合作表明,農產品可以透過外包資料整合和儀表板交付,釋放員工資源,用於作物科學創新。外包模式還可以緩解保險和房地產行業的人才短缺問題,因為空間風險評分在這些領域至關重要,但並非核心業務。因此,服務業是整個地理空間分析市場長期經常性收益的關鍵驅動力。
2024年,表面分析將佔地理空間分析市場規模的35.7%,支援洪水預報和基礎設施位置。同時,經營團隊對直覺視覺效果的需求正推動地理空間視覺化以14.8%的複合年成長率成長。網路分析也保持著強勁發展勢頭,支援公共路線規劃和最後一哩交付最佳化。
Echo Analytics 的人流儀表板展示了 3D 視覺效果和熱圖如何加速市中心零售規劃。擴增實境疊加技術推動相關人員對分區核准和資本項目資金籌措的支持。隨著人工智慧自動產生專題地圖,地理空間視覺化降低了非 GIS 專業人士的進入門檻,並擴大了潛在的地理空間分析市場。
地理空間分析市場按組件(軟體、服務、硬體)、分析類型(表面分析、網路分析、其他)、部署模式(本地部署、雲端)、最終用戶垂直領域(政府、國防、情報、其他)和地區細分。市場預測以美元計算。
區域分析
到2024年,北美將佔據地理空間分析市場的24.7%,這得益於成熟的衛星基礎設施、廣泛的5G部署以及持續的國防開支。美國國防部的1000顆監視衛星計畫將注入新的影像流,並刺激分析平台的升級。加拿大的地理空間開放資料計畫和墨西哥的城市交通試驗也將增加區域需求,儘管美國仍將佔據大部分收益。諸如美國國家地理空間情報局的Luno商業分析合約等聯邦計畫將增強採購流程的一致性。
預計到2030年,亞太地區的複合年成長率將達到14.5%,這得益於智慧城市補貼、交通走廊建設以及私人投資的增加。隨著北京方面對高光譜遙測和雷達有效載荷的資助,到2033年,中國的遙感探測市場規模可能擴大四倍。日本的「高原計畫」(Project PLATEAU)和印度的國家空間資料基礎設施(National Spatial Data Infrastructure)進一步顯示了公共部門對標準化平台的熱情。印尼、越南和菲律賓的快速都市化將推動政府增加在洪水風險建模、交通編配和土地稅數位化方面的支出,從而深化該地區的地理空間分析市場。
在開放資料政策和綠色轉型資金的推動下,歐洲正穩步成長。英國斥資10億英鎊的地理空間策略將支持國家資產登記冊數位雙胞胎的推廣。德國已將位置分析納入其工業4.0藍圖,法國正與烏克蘭合作開發聯合情報能力,凸顯其國防市場吸引力。北歐國家正在利用太空工具實現碳平衡和精密農業,並促進跨境互通性標準,以簡化解決方案的出口。
其他福利:
- Excel 格式的市場預測 (ME) 表
- 3個月的分析師支持
目錄
第1章 引言
- 研究假設和市場定義
- 調查範圍
第2章調查方法
第3章執行摘要
第4章 市場狀況
- 市場概況
- 市場促進因素
- 引入智慧城市計劃
- 整合 5G定位服務
- 物聯網衍生空間資料的傳播
- 利用小衛星星系進行高重訪成像
- 超本地 ESG 和氣候風險分析的需求
- 用於自主操作的即時地理圍欄
- 市場限制
- 高成本且操作複雜
- 法律和隱私障礙
- 人工智慧驅動的空間模型中的數據偏差
- 不同標準之間的互通性
- 供應鏈分析
- 技術展望
- 監管格局
- 波特五力分析
- 新進入者的威脅
- 買方的議價能力
- 供應商的議價能力
- 替代品的威脅
- 競爭對手之間的競爭
- 評估市場中的宏觀經濟因素
第5章市場規模及成長預測
- 按組件
- 軟體
- 服務
- 硬體
- 按分析類型
- 表面分析
- 網路分析
- 地理視覺化
- 其他
- 按部署模型
- 本地部署
- 雲
- 按最終用戶
- 政府
- 國防和情報
- 農業
- 自然資源
- 公用事業和通訊
- 運輸/物流
- 醫療保健和生命科學
- 其他
- 按地區
- 北美洲
- 美國
- 加拿大
- 墨西哥
- 南美洲
- 巴西
- 阿根廷
- 南美洲其他地區
- 歐洲
- 德國
- 英國
- 法國
- 義大利
- 其他歐洲地區
- 亞太地區
- 中國
- 日本
- 印度
- 韓國
- 東南亞
- 其他亞太地區
- 中東和非洲
- 中東
- 沙烏地阿拉伯
- 阿拉伯聯合大公國
- 土耳其
- 其他中東地區
- 非洲
- 南非
- 埃及
- 奈及利亞
- 其他非洲國家
- 北美洲
第6章 競爭態勢
- 市場集中度
- 策略趨勢
- 市佔率分析
- 公司簡介
- Esri Inc.
- Hexagon AB
- Trimble Inc.
- Maxar Technologies Inc.
- Bentley Systems Inc.
- Fugro NV
- L3Harris Technologies Inc.
- Airbus Defence and Space
- MDA Ltd.
- Atkins PLC(SNC-Lavalin)
- Intermap Technologies
- Oracle Corporation
- SAP SE(HANA Spatial)
- Google LLC(Google Maps Platform)
- Amazon Web Services(Location Service)
- Microsoft Corporation(Azure Maps)
- HERE Technologies
- TomTom NV
- CARTO
- Precisely(MapInfo)
第7章 市場機會與未來展望
The geospatial analytics market is valued at USD 95.84 billion in 2025 and is forecast to reach USD 174.44 billion by 2030, advancing at a 12.72% CAGR.
Rising demand for location-based insights, rapid satellite constellation launches, and smart-city investments position the discipline as an essential pillar of digital transformation. Enterprises use spatial intelligence to unlock operational efficiency, mitigate risk, and streamline strategic decisions as artificial intelligence automates feature extraction and predictive modeling. Government stimulus for digital twins, the rollout of 5G, and edge computing's ability to process sensor data locally further propel adoption. Meanwhile, heightened privacy regulation and hardware supply-chain pressures temper growth but have not slowed the overall upward trajectory.
Global Geospatial Analytics Market Trends and Insights
Adoption of Smart-City Programs
Urban digital-twin initiatives accelerate demand for the geospatial analytics market as municipalities seek real-time visibility across transportation, energy, and utilities. Japan's Project PLATEAU delivers 3D models for 200+ cities to support disaster prevention and land-use planning. China's digital infrastructure mandate embeds standardized spatial frameworks in local governments, driving continuous platform purchases. The United Kingdom's Public Sector Geospatial Agreement unlocks GBP 1 billion for underground asset mapping, minimizing construction strikes and maintenance delays. European councils also use digital twins to track carbon-neutrality progress, tightening the link between sustainability targets and location intelligence. Together, these programs sustain multi-year buying cycles and embed spatial analytics deep inside municipal operations.
Integration of 5G-Enabled Location Services
5G's sub-meter positioning accuracy and millisecond latency unlock real-time geospatial applications from dynamic traffic orchestration to autonomous drone routing. Ericsson's Istres deployment shows how dedicated network slices guarantee bandwidth for mission-critical mapping workloads.Edge computing co-located at base stations processes imagery and sensor feeds locally, ensuring compliance with data-sovereignty rules in healthcare and defense. Retailers adopt indoor positioning for shopper navigation, while factories optimize asset tracking without GPS. The synergy between 5G and AI shortens detection-to-decision cycles, raising expectations for always-on, context-aware spatial services.
High Costs and Operational Complexity
Entry barriers remain steep as enterprises budget for high-precision LiDAR-costing up to USD 150,000 per scanner-and annual software licenses approaching USD 50,000. Integrating satellite, drone, and legacy GIS archives demands rare skill sets; geospatial data scientists command 20-30% salary premiums. Firms spend most project hours cleansing coordinate systems and harmonizing formats, delaying time-to-value. Subscriptions reduce capex yet rapidly inflate opex when analytics run at full cadence. Training programs and certifications add USD 10,000-25,000 per employee each year, straining SME budgets.
Other drivers and restraints analyzed in the detailed report include:
- Proliferation of IoT-Derived Spatial Data
- Smallsat Constellations Enabling High-Revisit Imagery
- Legal and Privacy Hurdles
For complete list of drivers and restraints, kindly check the Table Of Contents.
Segment Analysis
Services are forecast to grow at a 12.9% CAGR, reflecting a widening skills gap as organizations adopt increasingly complex spatial solutions. Software maintained 42.7% geospatial analytics market share in 2024, but buyers now prioritize consulting and managed offerings to accelerate rollouts. Hardware revenue rises steadily through sensor price erosion and satellite expansion, although growth tempers as commoditization sets in.
Rising uptake of managed analytics illustrates the shift from license ownership toward outcome-based engagements. CARTO's collaboration with Indigo Ag shows how agribusinesses outsource data-fusion and dashboard delivery, freeing staff for crop-science innovation. Outsourcing models also mitigate talent shortages in insurance and real estate, where spatial risk scoring is vital yet non-core. As a result, the services segment anchors long-term recurring revenue streams across the geospatial analytics market.
Surface analysis accounted for 35.7% of the geospatial analytics market size in 2024, underpinning flood forecasting and infrastructure siting. Executive teams, however, increasingly demand intuitive visuals, propelling geovisualization at a 14.8% CAGR. Network analysis retains momentum, supporting utility routing and last-mile delivery optimization.
Echo Analytics' pedestrian-traffic dashboards illustrate how 3D visuals and heat maps accelerate city-center retail planning. Augmented-reality overlays foster stakeholder buy-in for zoning approvals and capital works funding. As artificial intelligence auto-generates thematic maps, geovisualization lowers the entry barrier for non-GIS professionals, enlarging the addressable geospatial analytics market.
Geospatial Analytics Market is Segmented by Component (Software, Services, and Hardware), Analysis Type (Surface Analysis, Network Analysis, and More), Deployment Model (On-Premises and Cloud), End-User Vertical (Government, Defense and Intelligence and More), and by Geography. The Market Forecasts are Provided in Terms of Value (USD).
Geography Analysis
North America controlled 24.7% of the geospatial analytics market in 2024, supported by mature satellite infrastructure, extensive 5G rollout, and sustained defense spending. The U.S. Department of Defense's plan for 1,000 surveillance satellites will inject fresh imagery streams, spurring upgrades in analytic platforms. Canada's geospatial open-data initiatives and Mexico's urban-mobility pilots add incremental regional demand, though the United States dominates revenue. Federal programs such as the National Geospatial-Intelligence Agency's Luno commercial analytics contracts reinforce consistent procurement flows.
Asia-Pacific is forecast to register a 14.5% CAGR through 2030, propelled by smart-city grants, transport-corridor build-outs, and rising private-sector investment. China's remote-sensing market could quadruple by 2033 as Beijing funds hyperspectral and radar payloads. Japan's Project PLATEAU and India's National Spatial Data Infrastructure further validate public-sector appetite for standardized platforms. Rapid urbanization across Indonesia, Vietnam, and the Philippines drives municipal spending on flood-risk modeling, traffic orchestration, and land-tax digitization, deepening the regional geospatial analytics market.
Europe posts steady growth aided by open-data policies and green-transition funding. The United Kingdom's GBP 1 billion geospatial strategy underpins national asset registers and digital twin rollouts. Germany embeds location analytics in Industry 4.0 roadmaps, while France cooperates with Ukraine on joint intelligence capabilities, highlighting defense-market pull. Northern Europe leverages spatial tools for carbon budgeting and precision farming, fostering cross-border interoperability standards that simplify solution exports.
- Esri Inc.
- Hexagon AB
- Trimble Inc.
- Maxar Technologies Inc.
- Bentley Systems Inc.
- Fugro NV
- L3Harris Technologies Inc.
- Airbus Defence and Space
- MDA Ltd.
- Atkins PLC (SNC-Lavalin)
- Intermap Technologies
- Oracle Corporation
- SAP SE (HANA Spatial)
- Google LLC (Google Maps Platform)
- Amazon Web Services (Location Service)
- Microsoft Corporation (Azure Maps)
- HERE Technologies
- TomTom NV
- CARTO
- Precisely (MapInfo)
Additional Benefits:
- The market estimate (ME) sheet in Excel format
- 3 months of analyst support
TABLE OF CONTENTS
1 INTRODUCTION
- 1.1 Study Assumptions and Market Definition
- 1.2 Scope of the Study
2 RESEARCH METHODOLOGY
3 EXECUTIVE SUMMARY
4 MARKET LANDSCAPE
- 4.1 Market Overview
- 4.2 Market Drivers
- 4.2.1 Adoption of Smart-City Programs
- 4.2.2 Integration of 5G-enabled Location Services
- 4.2.3 Proliferation of IoT-derived Spatial Data
- 4.2.4 Smallsat Constellations Enabling High-Revisit Imagery
- 4.2.5 Hyper-local ESG and Climate-Risk Analytics Demand
- 4.2.6 Real-time Geofencing for Autonomous Operations
- 4.3 Market Restraints
- 4.3.1 High Costs and Operational Complexity
- 4.3.2 Legal and Privacy Hurdles
- 4.3.3 Data-bias in AI-driven Spatial Models
- 4.3.4 Interoperability Across Heterogeneous Standards
- 4.4 Supply-Chain Analysis
- 4.5 Technological Outlook
- 4.6 Regulatory Landscape
- 4.7 Porter's Five Forces Analysis
- 4.7.1 Threat of New Entrants
- 4.7.2 Bargaining Power of Buyers
- 4.7.3 Bargaining Power of Suppliers
- 4.7.4 Threat of Substitutes
- 4.7.5 Competitive Rivalry
- 4.8 Assesment of Macroeconomic Factors on the Market
5 MARKET SIZE AND GROWTH FORECASTS (VALUE)
- 5.1 By Component
- 5.1.1 Software
- 5.1.2 Services
- 5.1.3 Hardware
- 5.2 By Analysis Type
- 5.2.1 Surface Analysis
- 5.2.2 Network Analysis
- 5.2.3 Geovisualization
- 5.2.4 Others
- 5.3 By Deployment Model
- 5.3.1 On-Premises
- 5.3.2 Cloud
- 5.4 By End-user Vertical
- 5.4.1 Government
- 5.4.2 Defense and Intelligence
- 5.4.3 Agriculture
- 5.4.4 Natural Resources
- 5.4.5 Utility and Communication
- 5.4.6 Transportation and Logistics
- 5.4.7 Healthcare and Life Sciences
- 5.4.8 Others
- 5.5 By Geography
- 5.5.1 North America
- 5.5.1.1 United States
- 5.5.1.2 Canada
- 5.5.1.3 Mexico
- 5.5.2 South America
- 5.5.2.1 Brazil
- 5.5.2.2 Argentina
- 5.5.2.3 Rest of South America
- 5.5.3 Europe
- 5.5.3.1 Germany
- 5.5.3.2 United Kingdom
- 5.5.3.3 France
- 5.5.3.4 Italy
- 5.5.3.5 Rest of Europe
- 5.5.4 Asia-Pacific
- 5.5.4.1 China
- 5.5.4.2 Japan
- 5.5.4.3 India
- 5.5.4.4 South Korea
- 5.5.4.5 Southeast Asia
- 5.5.4.6 Rest of Asia-Pacific
- 5.5.5 Middle-East and Africa
- 5.5.5.1 Middle-East
- 5.5.5.1.1 Saudi Arabia
- 5.5.5.1.2 United Arab Emirates
- 5.5.5.1.3 Turkey
- 5.5.5.1.4 Rest of Middle East
- 5.5.5.2 Africa
- 5.5.5.2.1 South Africa
- 5.5.5.2.2 Egypt
- 5.5.5.2.3 Nigeria
- 5.5.5.2.4 Rest of Africa
- 5.5.1 North America
6 COMPETITIVE LANDSCAPE
- 6.1 Market Concentration
- 6.2 Strategic Moves
- 6.3 Market Share Analysis
- 6.4 Company Profiles (includes Global-level Overview, Market-level Overview, Core Segments, Financials as available, Strategic Information, Market Rank/Share for key companies, Products and Services, Recent Developments)
- 6.4.1 Esri Inc.
- 6.4.2 Hexagon AB
- 6.4.3 Trimble Inc.
- 6.4.4 Maxar Technologies Inc.
- 6.4.5 Bentley Systems Inc.
- 6.4.6 Fugro NV
- 6.4.7 L3Harris Technologies Inc.
- 6.4.8 Airbus Defence and Space
- 6.4.9 MDA Ltd.
- 6.4.10 Atkins PLC (SNC-Lavalin)
- 6.4.11 Intermap Technologies
- 6.4.12 Oracle Corporation
- 6.4.13 SAP SE (HANA Spatial)
- 6.4.14 Google LLC (Google Maps Platform)
- 6.4.15 Amazon Web Services (Location Service)
- 6.4.16 Microsoft Corporation (Azure Maps)
- 6.4.17 HERE Technologies
- 6.4.18 TomTom NV
- 6.4.19 CARTO
- 6.4.20 Precisely (MapInfo)
7 MARKET OPPORTUNITIES AND FUTURE OUTLOOK
- 7.1 White-space and Unmet-need Assessment
 地理空間分析市場:按類型、技術、部署模式、組織規模、應用程式和最終用戶分類-2026-2032年全球市場預測汽車地理空間分析市場:按交付方式、部署方式、感測器類型、車輛類型、自動駕駛等級和應用分類-2026-2032年全球市場預測
 2026年全球無人機地理空間分析市場報告
 地理空間分析市場分析及預測(至 2035 年):按類型、產品、服務、技術、組件、應用、部署、最終用戶和解決方案分類2026年全球地理空間分析人工智慧市場報告2026年全球地理空間分析市場報告
 全球地理空間分析市場規模、佔有率、趨勢和成長分析報告(2026-2034)
 義大利地理空間分析:市場佔有率分析、產業趨勢與統計、成長預測(2026-2031)
 日本地理空間分析市場報告(按組件、類型、技術、企業規模、部署模式、垂直產業和地區分類,2026-2034 年)
 到地理空間分析市場:2035年前的產業趨勢和全球預測 - 各元件類型,各技術類型,各部署類型,各組織規模,各業界,各地區