


 |
市場調查報告書
商品編碼
1849841
POS終端:市場佔有率分析、產業趨勢、統計數據和成長預測(2025-2030年)POS Terminal - Market Share Analysis, Industry Trends & Statistics, Growth Forecasts (2025 - 2030) |
||||||
※ 本網頁內容可能與最新版本有所差異。詳細情況請與我們聯繫。
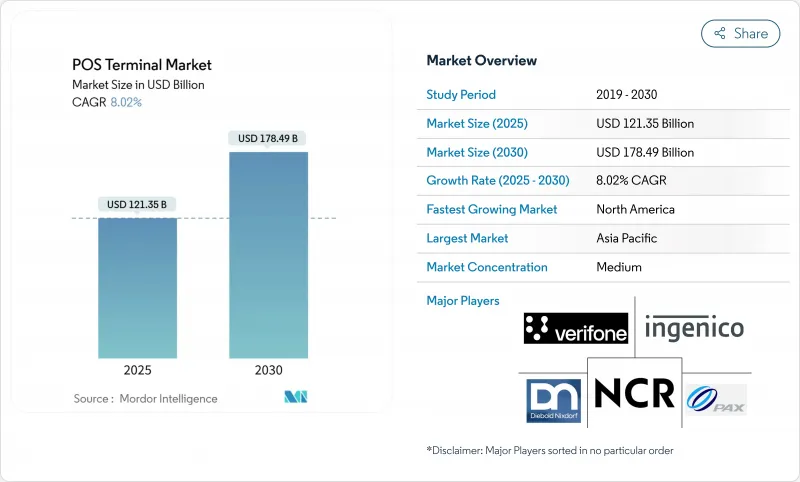
全球POS終端市場預計到2025年將達到1,213.5億美元,到2030年將達到1,784.9億美元,年複合成長率為8.02%。
這項成長的驅動力在於商家以雲端賦能、分析主導的系統取代傳統暫存器,這些系統將支付受理與庫存、客戶和合規管理融為一體。非接觸式支付、生物識別和人工智慧正推動POS終端市場從交易處理商業智慧。半導體元件的供應鏈壓力持續限制硬體生產,但軟體訂閱和混合部署模式克服了硬體瓶頸,推動了市場普及。能夠將全通路支付、合規性和低總體擁有成本相結合的供應商,最有希望滿足零售、酒店、醫療保健和交通運輸等行業日益成長的需求。
全球POS終端市場趨勢與洞察
零售業的日益普及
零售商目前正採用統一商務平台,將線上和線下交易連結起來,從而實現15-20%的效率提升和40%的排隊時間縮短。庫存聯網的POS終端市場提供即時庫存可見性,可將缺貨率降低30%,並將庫存積壓成本降低25%。小型商家正摒棄傳統暫存器,轉而採用企業級雲端系統。這一趨勢在亞太地區尤為顯著,該地區零售POS的普及率是全球平均的1.5倍。這種發展勢頭正在推動對整合支付、促銷和履約功能的終端的需求。隨著實體店向全通路模式轉型,那些為小型零售商提供量身定做的價格和支援的供應商正在贏得市場佔有率。
雲端基礎POS平台的普及率不斷提高
到2025年,雲端解決方案將佔新安裝量的73%,尤其是中小企業將資本支出轉向營運支出之際,雲端解決方案的需求將大幅成長。與傳統系統相比,持續的軟體更新可將設備壽命延長60%,並能快速回應不斷變化的會計準則。餐飲業者強調了使用雲端POS系統進行即時菜單和餐桌管理的優勢,通常可使平均客單價提高12%至18%。跨區域零售商則讚賞只需一次更新即可實施新的稅收規則,而無需進行硬體升級。這一趨勢將加速POS終端的市場滲透,尤其是在寬頻品質能夠支援始終線上雲端連線的情況下。
對資料安全和網路詐騙的擔憂
預計到2024年,詐騙行為將增加37%,這將促使人們對POS環境進行更嚴格的審查。行動POS透過無線連線擴大了攻擊面,導致每個商家每年在合規和監控方面需要投入18,000至25,000美元的安全成本。硬體更新周期落後於不斷演進的威脅,留下的安全漏洞需要透過軟體修補程式來彌補,並可能導致效能下降。生物辨識技術增強了身分驗證,但也引發了因地區而異的隱私問題,這使得POS終端市場的全球擴張變得更加複雜。
細分市場分析
至2030年,非接觸式支付解決方案將以14.9%的複合年成長率成長,到2024年,非接觸式設備將佔據POS終端市場71%的佔有率。非接觸式硬體POS終端市場規模將快速擴張,到2025年,78%的部署將包含NFC功能。消費者的偏好十分明確,超過51%的消費者經常選擇使用非接觸式支付卡或電子錢包,尤其是在購買25美元以下的商品時。能夠同時處理晶片密碼和非接觸式支付的混合終端可以幫助商家順利完成轉型,而不會疏遠注重安全的消費者。
穿戴式裝置、行動裝置和生物識別技術拓展了身分驗證選項,為交通運輸、飯店服務和醫療保健等領域開啟了便捷無阻的出行方式。與標準NFC相比,指紋辨識非接觸式支付可將詐騙降低60%。這些功能使供應商能夠交叉銷售與令牌化身分資料關聯的分析訂閱服務。隨著對強客戶身分驗證監管的日益嚴格,預計在POS終端市場,採用生物辨識技術的非接觸式解決方案將超越通用NFC技術。
儘管到2024年固定式POS終端仍將佔據POS終端市場54%的佔有率,但行動系統正以12.8%的複合年成長率加速成長。部署手持終端的零售連鎖店報告稱,排隊時間縮短了28%,員工生產力提高了15-20%。支援行動電話網路的終端內建SIM卡,即使在Wi-Fi覆蓋不到的地方也能確保連線。
在醫療保健領域,床邊支付設備可將帳單延遲減少高達 35%,並將收款率提高 25%。行動技術也為路邊取貨和基於活動的商務活動提供了支援。然而,加密通訊和設備管理技術的進步正在逐步縮小差距。採用政府級安全通訊協定的供應商可以進一步推動 POS 終端市場的成長。
POS終端市場依支付方式(接觸式、非接觸式)、POS類型(固定POS系統、行動/可攜式POS系統)、組件(硬體、軟體、服務)、部署類型(雲端基礎、本地部署)、終端用戶產業(零售、飯店、醫療保健等)和地區進行細分。市場預測以美元計價。
區域分析
亞太地區引領POS終端市場,主要得益於各國宣傳活動大力推廣無現金交易以及行動優先的消費文化。中國、日本和韓國的交易量龐大,而印度和新加坡則分別在「數位印度」和「智慧國家」舉措的推動下實現了快速成長。預計到2025年,該地區的卡片付款總額將達到24.7兆美元。生物辨識認證技術的日益普及正在推動人口密集城市的身份驗證。然而,區域網路連接的不足和監管的差異要求建立一個能夠支援離線處理的靈活架構。
南美洲是成長最快的地區,預計到2030年將以10.4%的複合年成長率成長。巴西正透過設備製造商與Stone和Pagseguro等數位收購方單機構的合作而加速發展。普惠金融計畫催生了對用於管理替代支付方式的設備的需求,在許多國家,70%的成年人沒有銀行帳戶。墨西哥和哥斯大黎加等國的電子帳單相關稅法要求企業立即進行硬體或軟體升級。
北美市場規模保持強勁,主要得益於其較早採用非接觸式支付和人工智慧主導的分析技術。光是美國一地,到2025年POS市場規模就將達到291.1億美元。歐洲正經歷強制性財政刺激,西班牙Verifactu系統的推廣應用是推動POS機更新換代的重要因素。中東和非洲智慧型手機普及率和都市化進程的交匯點蘊藏著巨大的成長潛力,但基礎設施的限制仍阻礙著農村地區的普及。
其他福利:
- Excel格式的市場預測(ME)表
- 3個月的分析師支持
目錄
第1章 引言
- 研究假設和市場定義
- 調查範圍
第2章調查方法
第3章執行摘要
第4章 市場情勢
- 市場概覽
- 市場促進因素
- 零售業的普及應用
- 雲端基礎POS平台的普及率不斷提高
- 非接觸式和行動支付的需求加速成長
- 將POS數據與高級分析和CRM整合
- 金融化和監管推動強制電子帳單
- 「POS即服務」訂閱模式降低了資本支出
- 市場限制
- 資料安全和網路詐騙問題
- 硬體可靠性和維護成本問題
- 支付標準的區域碎片化
- 半導體供應鏈的不穩定性
- 價值鏈分析
- 監管環境
- 技術展望(物聯網、人工智慧、邊緣處理)
- 波特五力分析
- 供應商的議價能力
- 買方的議價能力
- 新進入者的威脅
- 替代品的威脅
- 競爭對手之間的競爭
- 對宏觀經濟趨勢的市場評估
第5章 市場規模及成長預測(數值)
- 透過付款方式
- 接觸式
- 非接觸式
- 按POS類型
- 固定式POS系統
- 行動/可攜式POS系統
- 按組件
- 硬體
- 軟體
- 服務
- 透過部署模式
- 雲端基礎的
- 本地部署
- 按最終用戶行業分類
- 零售
- 飯店業
- 衛生保健
- 運輸/物流
- 其他終端用戶產業
- 按地區
- 北美洲
- 美國
- 加拿大
- 墨西哥
- 歐洲
- 德國
- 英國
- 法國
- 西班牙
- 義大利
- 其他歐洲地區
- 亞太地區
- 中國
- 日本
- 印度
- 韓國
- 東南亞
- 亞太其他地區
- 南美洲
- 巴西
- 阿根廷
- 其他南美洲
- 中東和非洲
- 中東
- GCC
- 土耳其
- 其他中東地區
- 非洲
- 南非
- 奈及利亞
- 其他非洲地區
- 北美洲
第6章 競爭情勢
- 市場集中度
- 策略性舉措(MandA、夥伴關係、資金籌措)
- 市佔率分析
- 公司簡介
- Ingenico SA(Worldline)
- VeriFone Systems Inc.
- PAX Technology Ltd.
- NCR Corporation
- Diebold Nixdorf Inc.
- Toshiba Global Commerce Solutions
- HP Inc.
- Panasonic Corporation
- Fujitsu Ltd.
- Samsung Electronics Co. Ltd.
- Newland Payment Technology
- BBPOS Ltd.
- Square Inc.(Block)
- Fiserv Inc.(Clover)
- Lightspeed Commerce Inc.
- Shopify Inc.(Shopify POS)
- Toast Inc.
- Revel Systems Inc.
- Oracle Corporation(MICROS)
- Agilysys Inc.
- Aptos Inc.
- GK Software SE
- NEC Corporation
- NEXGO(Shenzhen Xinguodu Technology)
- Qashier Pte Ltd.
- Cegid Group
- Cow Hills Retail BV
- PCMS Group Ltd.
第7章 市場機會與未來展望
The global POS terminal market is valued at USD 121.35 billion in 2025 and is forecast to reach USD 178.49 billion by 2030, advancing at an 8.02% CAGR.
Growth stems from merchants replacing legacy cash registers with cloud-enabled, analytics-driven systems that blend payment acceptance with inventory, customer, and compliance management. Contactless capability, biometric authentication, and artificial intelligence are moving the POS terminal market beyond transaction handling toward real-time business intelligence. Supply-chain pressure on semiconductor components continues to constrain hardware output, but software subscriptions and hybrid deployment models are lifting adoption despite hardware bottlenecks. Vendors that can combine omnichannel payments, regulatory compliance, and low total cost of ownership are best placed to capture incremental demand across retail, hospitality, healthcare, and transportation.
Global POS Terminal Market Trends and Insights
Growing Adoption in the Retail Sector
Retailers now deploy unified commerce platforms that connect in-store and online transactions, generating 15-20% efficiency gains and cutting queues by 40%. Inventory linked to the POS terminal market enables real-time stock visibility, which trims stockouts by 30% and excess inventory costs by 25%. Small merchants are bypassing legacy registers and embracing enterprise-grade cloud systems, a pattern most visible across Asia-Pacific where retail POS roll-outs outpace global averages by 1.5 times. The momentum reinforces demand for terminals that merge payment, promotion and fulfilment functions. Suppliers that tailor pricing and support to smaller retailers gain share as brick-and-mortar stores pivot toward omnichannel models.
Rising Adoption of Cloud-Based POS Platforms
Cloud solutions account for 73% of new installations in 2025, up sharply among small and mid-sized enterprises that convert capital expense to operating outflow. Continuous software updates extend terminal life by as much as 60% compared with traditional systems and allow rapid alignment with changing fiscal rules. Hospitality operators highlight the advantage; real-time menu and table management using cloud POS typically lifts average ticket values by 12-18%. Multi-jurisdiction retailers value the ability to roll out new tax rules through a single update rather than hardware swaps. The trend accelerates penetration of the POS terminal market, where broadband quality supports always-on cloud connectivity.
Data-Security and Cyber-Fraud Concerns
A 37% rise in fraud attempts during 2024 heightens scrutiny of POS environments. Mobile POS broadens attack surfaces through wireless links, prompting annual security outlays of USD 18,000-25,000 per merchant for compliance and monitoring. Hardware refresh cycles lag evolving threats, creating gaps that require software patches, which may erode performance. Biometrics harden authentication yet introduce privacy issues that differ across regions, complicating global roll-outs within the POS terminal market.
Other drivers and restraints analyzed in the detailed report include:
- Accelerating Demand for Contactless & Mobile Payments
- Integration of POS Data with Advanced Analytics and CRM
- Hardware Reliability and Maintenance-Cost Issues
For complete list of drivers and restraints, kindly check the Table Of Contents.
Segment Analysis
Contact-based devices retained 71% of the POS terminal market share in 2024, but contactless solutions are scaling at a 14.9% CAGR through 2030. The POS terminal market size for contactless-enabled hardware is set to widen rapidly as 78% of 2025 deployments include NFC. Consumer preference is clear: more than 51% regularly choose tap-and-go cards or wallets, especially for purchases below USD 25. Hybrid terminals that process both chip-and-PIN and contactless help merchants manage the transition without alienating security-minded shoppers.
Wearables, mobile devices and biometric taps expand authentication options and open the door to frictionless journeys in transit, hospitality and healthcare. Fingerprint-secured contactless payments cut fraud by 60% versus standard NFC. Such capability positions vendors to cross-sell analytics subscriptions tied to tokenised identity data. As regulations tighten around strong customer authentication, contactless solutions that embed biometric checks are expected to outperform generic NFC in the POS terminal market.
Fixed units still account for 54% of the POS terminal market size in 2024, yet mobile systems are accelerating at 12.8% CAGR. Retail chains deploying handheld devices report 28% shorter queues and 15-20% higher associate productivity. Cellular-enabled terminals operating with integrated SIM cards guarantee connectivity even where Wi-Fi falters.
In healthcare, bedside payment devices cut billing delays by up to 35% and improve collection rates by 25%. Mobility also underpins curbside pickup and event-based commerce. Security remains an issue, with 43% of merchants flagging data protection as the top hurdle when evaluating mobile platforms, but progress in encrypted communication and device management is gradually closing the gap. Providers that lock in government-grade security protocols can unlock further growth in the POS terminal market.
Point of Sale Terminal Market is Segmented by Mode of Payment Acceptance (Contact-Based, Contactless), POS Type (Fixed Point-Of-Sale Systems, Mobile / Portable Point-Of-Sale Systems), Component (Hardware, Software, Services), Deployment Mode (Cloud-Based, On-Premise), End-User Industry (Retail, Hospitality, Healthcare, and More), and Geography. The Market Forecasts are Provided in Terms of Value (USD).
Geography Analysis
Asia-Pacific leads the POS terminal market, propelled by government campaigns for cashless economies and a mobile-first consumer culture. China, Japan, and South Korea supply high transaction volumes, while India and Singapore climb rapidly under Digital India and Smart Nation initiatives, respectively. Regional card payments are expected to reach USD 24.7 trillion in 2025. Biometric verification adoption is rising, smoothing identity checks across densely populated cities. Yet, rural connectivity gaps and heterogeneous regulations require flexible architectures that support offline processing.
South America represents the fastest-growing region with a 10.4% CAGR forecast to 2030. Brazil drives momentum through partnerships between terminal makers and digital acquirers such as Stone and Pagseguro. Financial inclusion programmes create demand for devices that manage alternative payments, as 70% of adults remain unbanked in several countries. Fiscal e-invoicing laws across Mexico, Costa Rica, and others compel rapid hardware or software upgrades.
North America maintains scale through early adoption of contactless and AI-driven analytics. The United States alone accounted for a USD 29.11 billion POS segment in 2025. Europe progresses under mandatory fiscalisation; Spain's Verifactu rollout is a prominent trigger for replacements. The Middle East and Africa offer pockets of high growth where smartphone penetration and urbanisation intersect, though infrastructure limitations continue to slow rural uptake.
- Ingenico SA (Worldline)
- VeriFone Systems Inc.
- PAX Technology Ltd.
- NCR Corporation
- Diebold Nixdorf Inc.
- Toshiba Global Commerce Solutions
- HP Inc.
- Panasonic Corporation
- Fujitsu Ltd.
- Samsung Electronics Co. Ltd.
- Newland Payment Technology
- BBPOS Ltd.
- Square Inc. (Block)
- Fiserv Inc. (Clover)
- Lightspeed Commerce Inc.
- Shopify Inc. (Shopify POS)
- Toast Inc.
- Revel Systems Inc.
- Oracle Corporation (MICROS)
- Agilysys Inc.
- Aptos Inc.
- GK Software SE
- NEC Corporation
- NEXGO (Shenzhen Xinguodu Technology)
- Qashier Pte Ltd.
- Cegid Group
- Cow Hills Retail BV
- PCMS Group Ltd.
Additional Benefits:
- The market estimate (ME) sheet in Excel format
- 3 months of analyst support
TABLE OF CONTENTS
1 INTRODUCTION
- 1.1 Study Assumptions and Market Definition
- 1.2 Scope of the Study
2 RESEARCH METHODOLOGY
3 EXECUTIVE SUMMARY
4 MARKET LANDSCAPE
- 4.1 Market Overview
- 4.2 Market Drivers
- 4.2.1 Growing adoption in the retail sector
- 4.2.2 Rising adoption of cloud-based POS platforms
- 4.2.3 Accelerating demand for contactless and mobile payments
- 4.2.4 Integration of POS data with advanced analytics and CRM
- 4.2.5 Regulatory push for fiscalisation and e-invoicing mandates
- 4.2.6 "POS-as-a-Service" subscription models lowering cap-ex
- 4.3 Market Restraints
- 4.3.1 Data-security and cyber-fraud concerns
- 4.3.2 Hardware reliability and maintenance-cost issues
- 4.3.3 Fragmentation of regional payment standards
- 4.3.4 Semiconductor supply-chain volatility
- 4.4 Value Chain Analysis
- 4.5 Regulatory Landscape
- 4.6 Technological Outlook (IoT, AI, Edge-processing)
- 4.7 Porter's Five Forces Analysis
- 4.7.1 Bargaining Power of Suppliers
- 4.7.2 Bargaining Power of Buyers
- 4.7.3 Threat of New Entrants
- 4.7.4 Threat of Substitutes
- 4.7.5 Intensity of Competitive Rivalry
- 4.8 Assessment of Macro Economic Trends on the Market
5 MARKET SIZE AND GROWTH FORECASTS (VALUES)
- 5.1 By Mode of Payment Acceptance
- 5.1.1 Contact-based
- 5.1.2 Contactless
- 5.2 By POS Type
- 5.2.1 Fixed Point-of-Sale Systems
- 5.2.2 Mobile / Portable Point-of-Sale Systems
- 5.3 By Component
- 5.3.1 Hardware
- 5.3.2 Software
- 5.3.3 Services
- 5.4 By Deployment Mode
- 5.4.1 Cloud-based
- 5.4.2 On-Premise
- 5.5 By End-User Industry
- 5.5.1 Retail
- 5.5.2 Hospitality
- 5.5.3 Healthcare
- 5.5.4 Transportation and Logistics
- 5.5.5 Other End-user Industries
- 5.6 By Geography
- 5.6.1 North America
- 5.6.1.1 United States
- 5.6.1.2 Canada
- 5.6.1.3 Mexico
- 5.6.2 Europe
- 5.6.2.1 Germany
- 5.6.2.2 United Kingdom
- 5.6.2.3 France
- 5.6.2.4 Spain
- 5.6.2.5 Italy
- 5.6.2.6 Rest of Europe
- 5.6.3 Asia-Pacific
- 5.6.3.1 China
- 5.6.3.2 Japan
- 5.6.3.3 India
- 5.6.3.4 South Korea
- 5.6.3.5 Southeast Asia
- 5.6.3.6 Rest of Asia-Pacific
- 5.6.4 South America
- 5.6.4.1 Brazil
- 5.6.4.2 Argentina
- 5.6.4.3 Rest of South America
- 5.6.5 Middle East and Africa
- 5.6.5.1 Middle East
- 5.6.5.1.1 GCC
- 5.6.5.1.2 Turkey
- 5.6.5.1.3 Rest of Middle East
- 5.6.5.2 Africa
- 5.6.5.2.1 South Africa
- 5.6.5.2.2 Nigeria
- 5.6.5.2.3 Rest of Africa
- 5.6.1 North America
6 COMPETITIVE LANDSCAPE
- 6.1 Market Concentration
- 6.2 Strategic Moves (MandA, Partnerships, Funding)
- 6.3 Market Share Analysis
- 6.4 Company Profiles (includes Global level Overview, Market level overview, Core Segments, Financials as available, Strategic Information, Market Rank/Share for key companies, Products and Services, and Recent Developments)
- 6.4.1 Ingenico SA (Worldline)
- 6.4.2 VeriFone Systems Inc.
- 6.4.3 PAX Technology Ltd.
- 6.4.4 NCR Corporation
- 6.4.5 Diebold Nixdorf Inc.
- 6.4.6 Toshiba Global Commerce Solutions
- 6.4.7 HP Inc.
- 6.4.8 Panasonic Corporation
- 6.4.9 Fujitsu Ltd.
- 6.4.10 Samsung Electronics Co. Ltd.
- 6.4.11 Newland Payment Technology
- 6.4.12 BBPOS Ltd.
- 6.4.13 Square Inc. (Block)
- 6.4.14 Fiserv Inc. (Clover)
- 6.4.15 Lightspeed Commerce Inc.
- 6.4.16 Shopify Inc. (Shopify POS)
- 6.4.17 Toast Inc.
- 6.4.18 Revel Systems Inc.
- 6.4.19 Oracle Corporation (MICROS)
- 6.4.20 Agilysys Inc.
- 6.4.21 Aptos Inc.
- 6.4.22 GK Software SE
- 6.4.23 NEC Corporation
- 6.4.24 NEXGO (Shenzhen Xinguodu Technology)
- 6.4.25 Qashier Pte Ltd.
- 6.4.26 Cegid Group
- 6.4.27 Cow Hills Retail BV
- 6.4.28 PCMS Group Ltd.
7 MARKET OPPORTUNITIES AND FUTURE OUTLOOK
- 7.1 White-space and Unmet-need Assessment
 電子資金轉帳市場:按支付方式、交易類型、組成部分和最終用戶分類-2026-2032年全球市場預測POS終端市場:按類型、連接方式、部署方式和最終用戶分類-2026-2032年全球市場預測EMV POS終端市場:2026-2032年全球市場預測(依產品類型、連接方式、部署方式、支付方式及最終用戶分類)近距離場通訊 (NFC) POS 終端和支付市場:按組件、產品類型、支付方式、部署模式、組織規模和產業分類-2026-2032 年全球市場預測
 2026年全球銷售點終端市場報告人工智慧終端市場:按組件、組織規模、部署模式、技術、應用和產業分類-2026-2032年全球預測2026年全球零售POS終端市場報告2026年全球餐飲POS終端市場報告POS終端市場按組件、部署方式、外形規格、最終用戶和銷售管道,全球預測,2026-2032年
 POS終端市場分析及預測(至2035年):依類型、產品類型、服務、技術、組件、應用、部署類型、最終用戶及功能分類