


 |
市場調查報告書
商品編碼
1849829
水耕法:市場佔有率分析、產業趨勢、統計數據和成長預測(2025-2030 年)Hydroponics - Market Share Analysis, Industry Trends & Statistics, Growth Forecasts (2025 - 2030) |
||||||
※ 本網頁內容可能與最新版本有所差異。詳細情況請與我們聯繫。
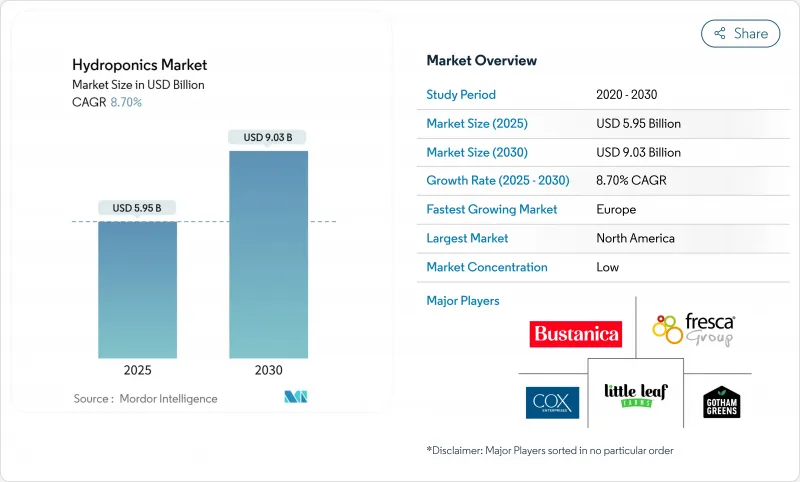
預計到 2025 年,水耕市場規模將達到 59.5 億美元,到 2030 年將達到 90.3 億美元,預測期(2025-2030 年)複合年成長率為 8.7%。
這種上升趨勢是由不斷成長的城市人口、企業永續性要求以及快速發展的可控環境技術的共同推動的。雖然目前密集型種植系統因其操作簡單而佔據主導地位,但隨著經營者尋求更高的資源效率,液態種植系統正在迅速擴張。主要企業正在整合人工智慧驅動的水耕程序,以提高產量並降低營運成本,而LED價格的下降也使得全年生產更具經濟效益。儘管能源消耗的成長仍然令人擔憂,但照明效率的提高和現場可再生能源的普及正在降低企業受電價波動的影響。
全球水耕市場趨勢與洞察
每平方公尺產量高,用水量低
水耕農業系統因其平方公尺產量可提高至多11倍,同時節水80%至90%,而對乾旱或人口密集的城市環境極具吸引力。像摩天大樓農場這樣的垂直農場幾乎可以循環利用所有灌溉用水,與傳統農地相比,節水消費量高達95%至99%。伊甸園綠色科技公司位於德克薩斯州的工廠僅佔地6.2萬平方英尺,每年即可生產34萬株植物,檢驗了可控環境農業如何將邊際土地轉化為可靠的食物來源。不斷上漲的市政水費進一步提升了水耕技術的市場提案,因為節省的每一公升水都直接轉化為營運成本的降低。城市負責人在核准城市中心的新農場時,優先考慮用水效率,加快核准流程,並在土地資源有限的大都會圈進行建設。這一趨勢在中東和亞洲的特大城市尤其明顯,這些地區的地下水枯竭和對進口水的依賴促使政府推出政策支持閉合迴路農業。
城市人口遷移和對本地生產食品的需求
城市人口占全球總人口的56%以上,居民越來越傾向購買近距離種植的農產品,以確保新鮮度和可追溯性。新冠疫情期間,供應鏈衝擊促使沃爾瑪等零售商與本地垂直農業供應商共同投資,以保障貨架供應。卡加利和休士頓等城市的地方政府項目正在將閒置的城市辦公空間改造成全年開放的種植中心,這表明閒置的商業空間可以轉化為食品工廠。年輕消費者願意為不含農藥的本地蔬菜支付15%至20%的溢價,這為提供訂閱服務的城市農場創造了穩定的現金流。公共和私人津貼抵消了推出成本,使規模較小的經營者也能在以前通常用於零售或共享辦公室的黃金地段獲得租賃權。這些因素共同建構了一個穩定的都市區基本客群,從而支撐了更高的平均售價並減少了配送排放。
前期投資和較長的投資回收期
高昂的前期成本和漫長的投資回收期阻礙了水耕技術的商業性應用。典型的500平方公尺的初始農場需要1.5萬至4萬美元的投資,每月能源和營養液費用高達1300美元,這對融資緊張的創業家來說是一大障礙。能源成本佔營運成本的50%之多,使得利潤率極易受到電力市場現貨價格上漲的影響。 2023年的市場動盪導致多家美國垂直農場破產,凸顯了激進擴張速度遠超融資的現狀。 2023年初,室內農業的創業融資下降了91%,迫使企業將盈利置於成長之上。在許多新興國家,兩位數的利率加劇了投資回報的難度,儘管潛在需求旺盛,但市場滲透速度卻十分緩慢。在主權財富基金補貼糧食安全基礎設施的地區,大型商業計劃得以推進,而小型生產商往往只能推遲投資,直到價格更低的承包套件出現。
細分市場分析
預計到2024年,整體式灌溉系統仍將佔銷售額的79.6%,顯示從土壤種植過渡到無肥種植的種植者對土壤種植的熟悉程度感到滿意。較低的資本投入和簡單的系統操作是其持續佔據主導地位的原因。然而,隨著業者尋求對氧氣供應和養分施用的更精準控制,液態灌溉系統預計到2030年將以12.6%的複合年成長率快速成長。與整體式灌溉系統相比,採用深水栽培(DWC)和營養液膜技術可使綠葉蔬菜產量提高30%至50%。閉合迴路設計還能實現徑流液的近乎完全回收利用,這在水費不斷上漲的地區是一項關鍵優勢。
混合式方法也正在湧現。嵌入惰性基材中的感測器可自動觸發液態營養液脈衝,將基質的根系穩定性與液態營養液精準輸送結合。這種適應性符合企業ESG目標,並能提高投資報酬率。因此,隨著水耕市場的成熟,預計會有更多種植者從靜態基質升級到感測器引導的營養液膜系統。
區域分析
北美預計在2024年佔據全球35.8%的銷售額,這得益於成熟的基礎設施、美國強力的津貼以及充足的風險投資。在美國,隨著醫院、學校和企業園區建造內部農場以減少食品運輸里程,商業水耕市場持續擴張。加拿大在可控環境種植方面的專業技術,得益於大麻合法化,正被應用於蔬菜生產,進一步增強了其技術排放。
預計歐洲將實現最快成長,到2030年複合年成長率將達到13.2%。歐盟的「從農場到餐桌」舉措提供了明確的政策支持,荷蘭等國正在部署人工智慧驅動的感測器網路,以減少化學投入並提高產量。德國正在推動溫室叢集與再生能源資產的協同發展,以降低營運成本並增加長期融資的機會。在西班牙,水耕生菜已獲得主流市場的認可,凸顯了消費者的接受度。
亞太地區蘊藏著巨大的未開發潛力。中國擁有60多家專業設備製造商,且地方政府的獎勵政策鼓勵在主要城市發展垂直農業。印度的新興企業已經證明,與傳統的土壤種植相比,垂直農業的產量可以提高40倍,這吸引了風險投資。在東南亞國家,糧食安全問題正獲得法律支持,推動新計劃的發展,但創業投資供應不穩定仍是規模化發展的一大障礙。隨著該地區中產階級的壯大和城市的擴張,隨著技術成本的下降,水耕市場可能會向東轉移。
其他福利:
- Excel格式的市場預測(ME)表
- 3個月的分析師支持
目錄
第1章 引言
- 研究假設和市場定義
- 調查範圍
第2章調查方法
第3章執行摘要
第4章 市場情勢
- 市場概覽
- 市場促進因素
- 每平方公尺產量高,用水量低
- 城市人口變化和對本地生產食品的需求
- 減少LED技術的資本投入
- 強制企業從事ESG農業相關工作
- 利用人工智慧驅動的營養配比最佳化提高投資報酬率
- CEA農場碳權貨幣化
- 市場限制
- 初始投資和較長的投資回收期
- 受控環境農業技能差距
- 加強含磷營養廢棄物的管理規定
- 電網故障和能源價格波動的風險
- 監管環境
- 技術展望
- 五力分析
- 供應商的議價能力
- 買方的議價能力
- 新進入者的威脅
- 替代品的威脅
- 競爭對手之間的競爭
第5章 市場規模與成長預測
- 按類型
- 聚合系統
- 封閉式系統
- 開放系統
- 流體系統
- 聚合系統
- 按作物類型
- 番茄
- 生菜和綠葉蔬菜
- 胡椒
- 黃瓜
- 微型菜苗
- 其他作物(草莓、羅勒等)
- 按地區
- 北美洲
- 美國
- 加拿大
- 墨西哥
- 北美其他地區
- 歐洲
- 德國
- 英國
- 法國
- 西班牙
- 義大利
- 荷蘭
- 其他歐洲地區
- 亞太地區
- 中國
- 日本
- 印度
- 澳洲
- 亞太其他地區
- 南美洲
- 巴西
- 阿根廷
- 其他南美洲
- 中東
- 沙烏地阿拉伯
- 阿拉伯聯合大公國
- 其他中東地區
- 非洲
- 南非
- 其他非洲地區
- 北美洲
第6章 競爭情勢
- 市場集中度
- 策略趨勢
- 市佔率分析
- 公司簡介
- GrowUp Farms
- BrightFarms(COX Enterprises, Inc)
- Pure Harvest Smart Farms
- Little Leaf Farms
- Thanet Earth(Fresca Group)
- Hydro Produce
- Emirates Hydroponics Farms
- Revol Greens
- Gotham Greens
- Nutrifresh India
- Badia Farms
- Sundrop Farms(Centuria Capital)
- Emirates Bustanica
- Sky Greens
第7章 市場機會與未來展望
The Hydroponics Market size is estimated at USD 5.95 billion in 2025 and is projected to reach USD 9.03 billion by 2030, at a CAGR of 8.7% during the forecast period (2025-2030).
This upward trajectory is propelled by the convergence of urban population growth, corporate sustainability mandates, and rapidly improving controlled-environment technologies. Aggregate growing systems currently dominate because they are simple to operate, but liquid systems are expanding more quickly as operators seek higher resource efficiency. Companies are integrating AI-driven nutrient routines to boost yields and cut operating costs, while falling LED prices are making year-round production economical. Rising energy use remains a concern; however, improvements in lighting efficiency and access to onsite renewables are lowering exposure to volatile power prices.
Global Hydroponics Market Trends and Insights
High-yield per square meter and lower water use
Hydroponic installations deliver up to 11-fold higher output per square meter while cutting water consumption by 80-90%, making them compelling for arid or densely built environments. Vertical farms such as Skyscraper Farm recycle nearly all irrigation water, demonstrating 95-99% savings compared with field agriculture. Eden Green Technology's Texas facility produces 340,000 plants annually on just 62,000 square feet, validating how controlled-environment agriculture turns marginal real estate into reliable food sources. Rising municipal water tariffs strengthen the hydroponics market value proposition as each liter of savings converts directly into lower operating costs. Urban planners highlight water efficiency when approving new inner-city farms, accelerating permit cycles, and build-outs in land-constrained metro areas. The trend is particularly acute in Middle Eastern and Asian megacities, where groundwater depletion and import dependency drive policy support for closed-loop farming.
Urban population shift and demand for local food
Cities account for over 56% of the world's population, and residents increasingly demand produce grown within a short radius to guarantee freshness and traceability. During the COVID-19 period, supply chain shocks pushed retailers such as Walmart to co-invest in regional vertical-farm suppliers to safeguard shelf continuity. Municipal programs convert under-utilized downtown offices into year-round grow hubs, as seen in Calgary and Houston, demonstrating how commercial vacancies can become food factories. Younger consumers willingly pay a 15-20% premium for pesticide-free local greens, creating predictable cash flow for urban farms serving subscription boxes. Public-private grants offset start-up costs, allowing small operators to secure leases in prime locations once reserved for retail or coworking ventures. Together, these factors underpin a steady urban customer base that supports higher average selling prices and reduces distribution emissions.
Up-front capex and long pay-back periods
High upfront costs and long payback periods hinder commercial hydroponics adoption. Typical 500 square meter starter farms require USD 15,000-40,000, while monthly energy and nutrient bills can reach USD 1,300, deterring cash-constrained entrepreneurs. Energy accounts for up to 50% of operating costs, exposing margins to spot-price spikes in liberalized power markets. The 2023 shakeout that pushed several U.S. vertical farms into bankruptcy highlighted how aggressive expansion outpaced cash flow. Venture funding for indoor agriculture slipped 91% during early 2023, forcing firms to prioritize profitability over growth. In many developing countries, double-digit interest rates exacerbate pay-back horizons, slowing hydroponics market penetration despite latent demand. Where sovereign wealth funds subsidize food security infrastructure, larger commercial projects move forward, and smaller growers often delay investments until cheaper turnkey kits emerge.
Other drivers and restraints analyzed in the detailed report include:
- Reduced capital expenditure for LED technology
- Corporate on-site ESG farming mandates
- Skills gap in controlled-environment agronomy
For complete list of drivers and restraints, kindly check the Table Of Contents.
Segment Analysis
Aggregate substrates continued to command 79.6% of revenue in 2024, illustrating how familiarity reassures growers shifting from soil to soilless cultivation. Their lower capital needs and simple mechanics underpin persistent dominance. Liquid systems, however, are accelerating at a 12.6% CAGR through 2030 as operators pursue finer control of oxygenation and nutrient dosing. Deep-water culture and nutrient film technique installations boost leafy-green yields by 30-50% compared with aggregate counterparts. Closed-loop designs also recycle nearly all solution runoff, an important differentiator where water tariffs are rising.
Hybrid approaches are emerging: sensors embedded in inert substrates automatically trigger liquid nutrient pulses, merging the root stability of aggregates with the precision of liquids. Such adaptability aligns with corporate ESG targets and elevates return on invested capital. Hence, more producers are expected to upgrade from static substrates to sensor-guided nutrient film lines as the hydroponics market matures.
The Hydroponics Market Report is Segmented by Type (Aggregate System and Liquid System), by Crop Type (Tomato, Lettuce and Leafy Greens, Pepper, Cucumber, and More), and by Geography (North America, Europe, Asia-Pacific, South America, Middle East, and Africa). The Market Forecasts are Provided in Terms of Value (USD).
Geography Analysis
North America secured 35.8% of global revenue in 2024 on the back of mature infrastructure, proactive USDA grants, and abundant venture financing. The hydroponics market size for U.S. commercial operations continues to swell as hospitals, schools, and corporate campuses build onsite farms to trim food-mile emissions. Canada's controlled-environment expertise, honed during cannabis legalization, is migrating into vegetable production and adding technical depth.
Europe promises the fastest climb with a 13.2% CAGR through 2030. The EU's Farm-to-Fork initiative supplies clear policy backing, while countries such as the Netherlands deploy AI-fueled sensor networks that cut chemical inputs and lift yields. Germany's push to co-locate greenhouse clusters with renewable power assets is lowering operating expenses and broadening access to long-term financing. Spain's mainstream acceptance of hydroponic lettuce highlights strong consumer readiness, a factor that accelerates supermarket partnerships.
Asia-Pacific presents a large untapped upside. China has more than 60 specialized equipment manufacturers, and provincial incentives encourage vertical farming in megacities. India's start-ups demonstrate 40-fold yield gains over soil plots, enticing additional venture capital. Food-security concerns in Southeast Asian nations are winning legislative support for new projects, although inconsistent power supply still complicates scaling. The region's rising middle class and urban footprint suggest the hydroponics market will pivot eastward as technological costs fall.
- GrowUp Farms
- BrightFarms (COX Enterprises, Inc)
- Pure Harvest Smart Farms
- Little Leaf Farms
- Thanet Earth (Fresca Group)
- Hydro Produce
- Emirates Hydroponics Farms
- Revol Greens
- Gotham Greens
- Nutrifresh India
- Badia Farms
- Sundrop Farms (Centuria Capital)
- Emirates Bustanica
- Sky Greens
Additional Benefits:
- The market estimate (ME) sheet in Excel format
- 3 months of analyst support
TABLE OF CONTENTS
1 Introduction
- 1.1 Study Assumptions and Market Definition
- 1.2 Scope of the Study
2 Research Methodology
3 Executive Summary
4 Market Landscape
- 4.1 Market Overview
- 4.2 Market Drivers
- 4.2.1 High-yield per square meter and lower water use
- 4.2.2 Urban population shift and demand for local food
- 4.2.3 Reduced capital expenditure for LED technology
- 4.2.4 Corporate on-site ESG farming mandates
- 4.2.5 AI nutrient-mix optimization boosting ROI
- 4.2.6 Carbon-credit monetization of CEA farms
- 4.3 Market Restraints
- 4.3.1 Up-front capex and long pay-back periods
- 4.3.2 Skills gap in controlled-environment agronomy
- 4.3.3 Rising P-based nutrient-waste regulations
- 4.3.4 Grid-outage risk and energy-price volatility
- 4.4 Regulatory Landscape
- 4.5 Technological Outlook
- 4.6 Porters Five Forces
- 4.6.1 Bargaining Power of Suppliers
- 4.6.2 Bargaining Power of Buyers
- 4.6.3 Threat of New Entrants
- 4.6.4 Threat from Substitutes
- 4.6.5 Intensity of Competitive Rivalry
5 Market Size and Growth Forecasts (Value, USD)
- 5.1 By Type
- 5.1.1 Aggregate System
- 5.1.1.1 Closed System
- 5.1.1.2 Open System
- 5.1.2 Liquid System
- 5.1.1 Aggregate System
- 5.2 By Crop Type
- 5.2.1 Tomato
- 5.2.2 Lettuce and Leafy Greens
- 5.2.3 Pepper
- 5.2.4 Cucumber
- 5.2.5 Micro-greens
- 5.2.6 Other Crops (Strawberry, Basil, etc.)
- 5.3 By Geography
- 5.3.1 North America
- 5.3.1.1 United States
- 5.3.1.2 Canada
- 5.3.1.3 Mexico
- 5.3.1.4 Rest of North America
- 5.3.2 Europe
- 5.3.2.1 Germany
- 5.3.2.2 United Kingdom
- 5.3.2.3 France
- 5.3.2.4 Spain
- 5.3.2.5 Italy
- 5.3.2.6 Netherlands
- 5.3.2.7 Rest of Europe
- 5.3.3 Asia-Pacific
- 5.3.3.1 China
- 5.3.3.2 Japan
- 5.3.3.3 India
- 5.3.3.4 Australia
- 5.3.3.5 Rest of Asia-Pacific
- 5.3.4 South America
- 5.3.4.1 Brazil
- 5.3.4.2 Argentina
- 5.3.4.3 Rest of South America
- 5.3.5 Middle East
- 5.3.5.1 Saudi Arabia
- 5.3.5.2 United Arab Emirates
- 5.3.5.3 Rest of Middle East
- 5.3.6 Africa
- 5.3.6.1 South Africa
- 5.3.6.2 Rest of Africa
- 5.3.1 North America
6 Competitive Landscape
- 6.1 Market Concentration
- 6.2 Strategic Moves
- 6.3 Market Share Analysis
- 6.4 Company Profiles (includes Global level Overview, Market level overview, Core Segments, Financials as available, Strategic Information, Market Rank/Share for key companies, Products and Services, and Recent Developments)
- 6.4.1 GrowUp Farms
- 6.4.2 BrightFarms (COX Enterprises, Inc)
- 6.4.3 Pure Harvest Smart Farms
- 6.4.4 Little Leaf Farms
- 6.4.5 Thanet Earth (Fresca Group)
- 6.4.6 Hydro Produce
- 6.4.7 Emirates Hydroponics Farms
- 6.4.8 Revol Greens
- 6.4.9 Gotham Greens
- 6.4.10 Nutrifresh India
- 6.4.11 Badia Farms
- 6.4.12 Sundrop Farms (Centuria Capital)
- 6.4.13 Emirates Bustanica
- 6.4.14 Sky Greens
7 Market Opportunities and Future Outlook
 無土栽培基質市場-2026-2032年全球市場預測水耕市場:2026-2032年全球市場預測(依系統類型、設備、作物類型、生長環境、生長面積、最終用戶及通路分類)水耕系統市場:按組件、類型、作物類型、面積和應用分類-2026-2032年全球市場預測
 水耕系統市場機會、成長要素、產業趨勢分析及2026-2035年預測。
 無土栽培市場預測至2034年-按栽培系統、生長介質、設施類型、應用、最終用戶和地區分類的全球分析
 水耕市場:依類型、作物、種植面積及地區分類
 水耕市場規模、佔有率、趨勢和預測:按類型、作物類型、設備和地區分類,2026-2034年
 2026年全球水耕市場報告
 全球水耕市場規模、佔有率、趨勢和成長分析報告(2026-2034年)全球水耕種植介質市場規模、佔有率、趨勢和成長分析報告(2026-2034)