


 |
市場調查報告書
商品編碼
1849808
網路分析:市場佔有率分析、產業趨勢、統計數據、成長預測(2025-2030)Network Analytics - Market Share Analysis, Industry Trends & Statistics, Growth Forecasts (2025 - 2030) |
||||||
※ 本網頁內容可能與最新版本有所差異。詳細情況請與我們聯繫。
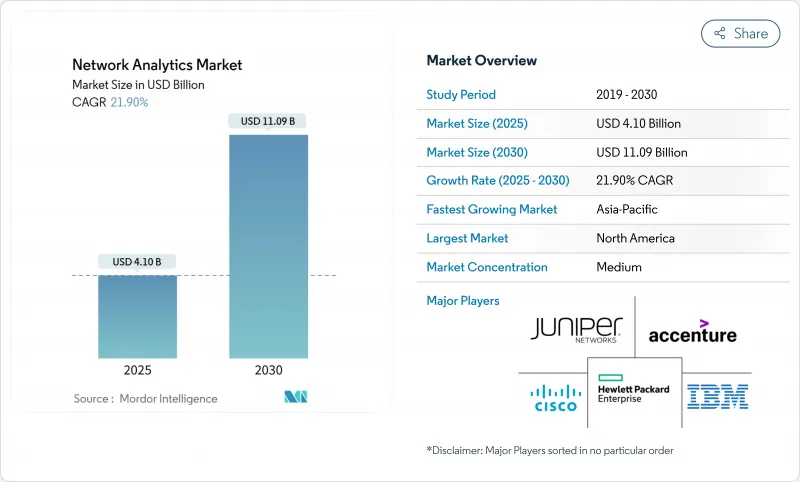
預計 2025 年網路分析市場的現值為 41 億美元,到 2030 年將達到 110.9 億美元,複合年成長率為 21.9%。
數據流量的快速成長、5G 的部署以及連網設備的激增,正在將網路分析從簡單的監控提升為數位基礎設施策略的核心要素。企業將分析視為預測性維護、容量規劃和安全的關鍵,而服務供應商則利用它來實現可編程網路的收益。人工智慧如今已為大多數主流平台提供支持,60% 的技術高管計劃利用人工智慧實現營運自動化和精簡。以 IBM 斥資 64 億美元收購 HashiCorp 為例,供應商整合標誌著對端到端堆疊的需求,該堆疊將分析與更廣泛的 IT 管理相結合。雖然高昂的初始成本和缺乏專業技能仍然是採用該技術的障礙,但雲端交付模式和託管服務正在降低進入門檻。
全球網路分析市場趨勢與洞察
對自主和自我管理網路的需求
網路複雜性日益增加,停機成本不斷上升(以雲端為中心的企業每分鐘 9,000 美元),這推動了對可自我修復基礎設施的需求。基於人工智慧的分析平台可以預測和修復故障,從而最佳化故障排除,從被動到主動。運行關鍵任務工作負載的架構越來越依賴人工智慧運作 (AIOps),72% 的 IT 領導者正在規劃基於平台的架構,該架構整合了分析、自動化和可觀察性。因此,供應商正在整合即時異常檢測和策略驅動的編配,以縮短平均修復時間並實現服務等級目標。
物聯網和機器對機器通訊的興起
網路分析平台增加了設備級可視性、通訊協定解碼和行為基準測試,以管理異質流量。在製造業、公共和智慧城市部署中,即時分析支援預測性維護和能源最佳化,從而實現可衡量的成本節約並延長正常運作。
初始成本高且投資收益不確定
全面部署需要軟體許可證、支援遠端檢測的硬體、系統整合和員工培訓。量化減少停機時間和改善客戶體驗所帶來的財務回報仍然很困難,尤其對於中小型組織而言。雖然基於訂閱的雲端交付方式可以減輕資本負擔,但新興經濟體的預算緊張仍然阻礙了其採用。
細分分析
雲端運算的採用率將以 24% 的複合年成長率成長,超過整體網路分析市場。這一趨勢的驅動力在於彈性可擴展性、付費使用制的經濟性以及分散式團隊的便利存取。儘管如此,由於日益成長的安全和主權需求,到 2024 年,本地安裝仍將保持 56% 的收入佔有率。隨著企業將傳統投資與未來敏捷性結合,混合架構正日益受到青睞,91% 的金融機構已著手實施雲端現代化計畫。
混合營運模式代表了一種務實的觀點:對資料管理要求嚴格的工作負載仍保留在本地,而突發性分析任務則遷移至公共雲端。這種二元性支援成本最佳化,且無需犧牲管治。分析師估計,目前 30% 的企業工作負載遷移至公共雲端,其中分析和 DevOps主導遷移。供應商正積極響應這一趨勢,提供容器化收集器、SaaS 儀表板以及橫跨私有和公共領域的統一策略引擎。持續整合管道將分析進一步嵌入日常營運中,並縮短了開發週期。
到2024年,解決方案將佔總收益的63%,但隨著企業對專業知識的持續追求,服務預計將以每年23.1%的速度成長。諮詢和整合服務使分析架構與業務目標保持一致,而託管服務則減輕了日常調整和規則維護的負擔。服務浪潮反映了更廣泛的IT外包模式,預計到2024年,託管服務供應商的規模將達到3,500億美元,到2033年將超過1兆美元。
服務合作夥伴擴大提供人工智慧主導的諮詢服務,將績效洞察與業務成果連結起來。採用此模式的企業報告稱,成本節省了20-30%,生產力提升了高達25%。為了滿足需求,供應商正在整合運作手冊、預訓練模型和遠端SOC功能,以加快價值實現速度並縮小人工智慧技能差距。這些進步已牢固確立了服務作為網路分析市場基石的地位,並帶來了經常性收益和更深層的客戶關係。
區域分析
由於早期採用、龐大的IT預算以及領先的供應商生態系統,北美地區將在2024年維持38%的收入佔有率。美國金融服務和醫療保健公司正在採用融合人工智慧的分析技術,以滿足嚴格的運作和隱私要求。加拿大通訊業者正在利用分析技術最佳化全國範圍內的5G部署,並管理農村地區的覆蓋義務。清晰的監管和充足的人才資源正在推動預測自動化的實驗,使該地區走在創新的前沿。
亞太地區是成長最快的地區,到2030年的複合年成長率將達到23.3%。中國和印度正在資助大規模的5G、智慧城市和工業IoT計劃,這些項目需要對多供應商環境有更細緻的可視性。日本和韓國正在將人工智慧與網路監控相結合,以支援自動駕駛汽車測試和工廠自動化;而澳洲則正在利用分析技術保護關鍵基礎設施免受網路威脅。
在監管趨嚴、安全意識不斷增強的背景下,歐洲正在不斷發展。英國和德國在金融服務和製造業領域引領著這一趨勢,並致力於在混合架構中尋求符合 GDPR 標準的洞察。法國和義大利正在加大通訊業者的採用力度,以在競爭激烈的行動市場中保持客戶滿意度。北歐和東歐的能源和公共產業正在部署分析技術,以檢測智慧電網遙測中的異常情況。該地區的成功供應商注重資料主權管理、精細的使用者存取策略以及自動化合規報告。
其他福利:
- Excel 格式的市場預測 (ME) 表
- 3個月的分析師支持
目錄
第1章 引言
- 研究假設和市場定義
- 調查範圍
第2章調查方法
第3章執行摘要
第4章 市場洞察
- 市場概況
- 市場促進因素
- 對自主和自我管理網路的需求
- 物聯網 (IoT) 和機器對機器通訊的興起
- 指數級數據流量和5G部署的壓力
- 封閉回路型人工智慧(AI)數位雙胞胎最佳化
- 基於 API 的網路即程式碼收益需要即時分析
- 市場限制
- 初始成本高且投資收益(RoI) 不確定
- 資料隱私和監管限制
- 網路資料管道中的 AI/ML Ops 技能差距
- 由於專有遙測通訊協定導致的供應商鎖定
- 價值/供應鏈分析
- 監管格局
- 技術展望
- 波特五力分析
- 供應商的議價能力
- 買家/消費者的議價能力
- 新進入者的威脅
- 替代品的威脅
- 競爭對手之間的競爭
第5章市場區隔
- 按部署模型
- 本地部署
- 雲
- 混合
- 按組件
- 解決方案
- 網路智慧平台
- 績效管理
- 安全分析
- 根本原因和異常檢測
- 流量最佳化
- 服務
- 專業服務
- 託管服務
- 解決方案
- 按用途
- 績效管理
- 故障管理
- 客戶體驗管理
- 安全和異常檢測
- 智慧路由與交通最佳化
- 按最終用戶
- 通訊服務供應商
- 通訊業者
- 網際網路服務供應商
- 衛星通訊業者
- 有線網路供應商
- 雲端服務供應商
- 公司
- 銀行、金融服務和保險(BFSI)
- 衛生保健
- 零售與電子商務
- 製造業
- 政府和公共部門
- 通訊服務供應商
- 按地區
- 北美洲
- 美國
- 加拿大
- 南美洲
- 巴西
- 南美洲其他地區
- 歐洲
- 英國
- 德國
- 法國
- 義大利
- 西班牙
- 俄羅斯
- 其他歐洲地區
- 亞太地區
- 中國
- 日本
- 印度
- 韓國
- 澳洲和紐西蘭
- 其他亞太地區
- 中東和非洲
- 中東
- 沙烏地阿拉伯
- 阿拉伯聯合大公國
- 土耳其
- 其他中東地區
- 非洲
- 南非
- 其他非洲國家
- 北美洲
第6章 競爭態勢
- 市場集中度
- 策略趨勢
- 市佔率分析
- 公司簡介
- Accenture PLC
- Cisco Systems Inc.
- Hewlett Packard Enterprise Co.
- IBM Corporation
- Juniper Networks Inc.
- SAS Institute Inc.
- Sandvine Corporation
- Alcatel-Lucent Enterprise SA
- TIBCO Software Inc.
- Broadcom Inc.(incl. VMware)
- Nokia Corporation
- Ericsson Inc.
- Huawei Technologies Co. Ltd.
- Dell Technologies Inc.
- Oracle Corporation
- NetScout Systems Inc.
- Allot Ltd.
- NEC Corporation
- ZTE Corporation
- Amdocs Ltd.
- F5 Networks Inc.
- Splunk Inc.
- Keysight Technologies Inc.
第7章 市場機會與未來趨勢
- 閒置頻段和未滿足需求評估
The network analytics market holds a present value of USD 4.10 billion in 2025 and is forecast to reach USD 11.09 billion by 2030, advancing at a 21.9% CAGR.
Rapid data-traffic growth, 5G roll-outs, and the surge in connected devices have pushed network analytics from simple monitoring to a core element of digital infrastructure strategy. Enterprises view analytics as essential for predictive maintenance, capacity planning, and security, while service providers use it to monetize programmable networks. Artificial intelligence now underpins most leading platforms, with 60% of technology executives planning AI-enabled automation to streamline operations. Consolidation among vendors, illustrated by IBM's USD 6.4 billion acquisition of HashiCorp, signals demand for end-to-end stacks that blend analytics with broader IT management. Although high initial costs and specialized skill shortages still hinder adoption, cloud delivery models and managed services are easing entry barriers.
Global Network Analytics Market Trends and Insights
Need for Autonomous and Self-Managing Networks
Escalating network complexity and the cost of downtime-USD 9,000 per minute for cloud-centric firms-have intensified demand for self-healing infrastructure. AI-infused analytics platforms now predict and remediate faults, enabling a shift from reactive troubleshooting to proactive optimisation. Industries running mission-critical workloads increasingly depend on AIOps, with 72% of IT leaders planning platform-based architectures that merge analytics, automation, and observability. As a result, vendors are embedding real-time anomaly detection and policy-driven orchestration to cut mean-time-to-repair and protect service-level objectives.
Rise of IoT and Machine-to-Machine Communications
Network analytics platforms have added device-level visibility, protocol decoding, and behavioural baselining to manage heterogeneous traffic. In manufacturing, utilities, and smart-city roll-outs, real-time analytics supports predictive maintenance and energy optimisation, unlocking measurable cost savings and uptime improvements.
High Initial Costs and Uncertain Return on Investment
Comprehensive deployments require software licences, telemetry-ready hardware, systems integration, and staff training. Quantifying financial returns linked to reduced outages or improved customer experience remains challenging, particularly for small and mid-sized organisations. Subscription-based cloud delivery eases capital burdens, yet budget pressures in emerging economies still slow adoption.
Other drivers and restraints analyzed in the detailed report include:
- Exponential Data Traffic and 5G Roll-Out Pressure
- Closed-Loop AI Digital-Twin Optimisation
- API-Based Network-as-Code Monetisation Needs Real-Time Analytics
- Data-Privacy and Regulatory Constraints
For complete list of drivers and restraints, kindly check the Table Of Contents.
Segment Analysis
Cloud deployments are set to expand at a 24% CAGR, outpacing the overall network analytics market. The move is driven by elastic scalability, pay-as-you-go economics, and easier access for distributed teams. Despite that momentum, on-premise installations retained 56% revenue in 2024 due to heightened security and sovereignty needs. Hybrid architectures have gained favour as organisations bridge legacy investments with future agility, a trend reinforced by financial institutions, where 91% have already begun their cloud modernisation journeys.
Hybrid operating patterns illustrate a pragmatic view: workloads with stringent data-control requirements remain on-premise, while bursty analytic tasks shift to public clouds. This duality supports cost optimisation without sacrificing governance. Analysts note that 30% of enterprise workloads now sit in public clouds, with analytics and DevOps leading migrations. Vendors have responded by delivering containerised collectors, SaaS dashboards, and unified policy engines that span private and public domains. Continuous integration pipelines further embed analytics into daily operations, compressing development cycles.
Solutions dominated 2024 revenue with 63%, yet services are forecast to grow 23.1% annually as organisations seek specialised expertise. Consulting and integration engagements align analytics architectures with business objectives, while managed services offload daily tuning and rule-maintenance. The services wave mirrors broader IT outsourcing patterns; the managed service provider segment is projected to reach USD 350 billion in 2024 and top USD 1 trillion by 2033.
Service partners increasingly deliver AI-driven advisory offerings that contextualise performance insights into business outcomes. Enterprises adopting such models have reported 20-30% cost savings and up to 25% productivity gains. To meet demand, vendors package runbooks, pre-trained models, and remote SOC capabilities, shortening time to value and mitigating the AI skills gap. This evolution cements services as a cornerstone of the network analytics market, unlocking recurring revenue and deeper client relationships.
Network Analytics Market Report is Segmented by Deployment Model (On-Premise, Cloud, and Hybrid), Component (Solutions and Services), Application (Performance Management, Fault Management, and More), End-User (Communication Service Providers, Cloud Service Providers, and More), and Geography (North America, Europe, Asia-Pacific, and More). The Market Forecasts are Provided in Terms of Value (USD).
Geography Analysis
North America retained 38% revenue share in 2024, supported by early adoption, sizeable IT budgets, and an advanced supplier ecosystem. United States financial-services and healthcare organisations deploy AI-infused analytics to satisfy stringent uptime and privacy mandates. Canadian carriers use analytics to optimise nationwide 5G roll-outs and manage rural-coverage obligations. Regulatory clarity and abundant talent expedite experimentation with predictive automation, keeping the region at the forefront of innovation.
Asia-Pacific is the fastest-growing region with a 23.3% CAGR to 2030. China and India fund large-scale 5G, smart-city, and industrial-IoT projects that demand granular visibility into multi-vendor environments. Japan and South Korea integrate AI with network monitoring to support autonomous-vehicle trials and factory automation, while Australia leverages analytics to protect critical infrastructure from cyber threats.
Europe advances amid stringent regulations and heightened security awareness. United Kingdom and Germany lead adoption in financial services and manufacturing, seeking GDPR-compliant insights across hybrid architectures. France and Italy augment telecom deployments to maintain customer satisfaction in competitive mobile markets. Energy and utilities operators in Northern and Eastern Europe deploy analytics to detect anomalies in smart-grid telemetry. Vendors thriving in the region emphasise data-sovereignty controls, granular user-access policies, and automated compliance reporting.
- Accenture PLC
- Cisco Systems Inc.
- Hewlett Packard Enterprise Co.
- IBM Corporation
- Juniper Networks Inc.
- SAS Institute Inc.
- Sandvine Corporation
- Alcatel-Lucent Enterprise SA
- TIBCO Software Inc.
- Broadcom Inc. (incl. VMware)
- Nokia Corporation
- Ericsson Inc.
- Huawei Technologies Co. Ltd.
- Dell Technologies Inc.
- Oracle Corporation
- NetScout Systems Inc.
- Allot Ltd.
- NEC Corporation
- ZTE Corporation
- Amdocs Ltd.
- F5 Networks Inc.
- Splunk Inc.
- Keysight Technologies Inc.
Additional Benefits:
- The market estimate (ME) sheet in Excel format
- 3 months of analyst support
TABLE OF CONTENTS
1 INTRODUCTION
- 1.1 Study Assumptions and Market Definition
- 1.2 Scope of the Study
2 RESEARCH METHODOLOGY
3 EXECUTIVE SUMMARY
4 MARKET INSIGHTS
- 4.1 Market Overview
- 4.2 Market Drivers
- 4.2.1 Need for autonomous and self-managing networks
- 4.2.2 Rise of Internet of Things (IoT) and machine-to-machine communications
- 4.2.3 Exponential data traffic and 5G roll-out pressure
- 4.2.4 Closed-loop Artificial Intelligence (AI) digital-twin optimisation
- 4.2.5 API-based network-as-code monetisation needs real-time analytics
- 4.3 Market Restraints
- 4.3.1 High initial costs and uncertain Return on Investment (RoI)
- 4.3.2 Data-privacy and regulatory constraints
- 4.3.3 AI/ML Ops skills gap for network data pipelines
- 4.3.4 Vendor lock-in via proprietary telemetry protocols
- 4.4 Value / Supply-Chain Analysis
- 4.5 Regulatory Landscape
- 4.6 Technological Outlook
- 4.7 Porter's Five Forces Analysis
- 4.7.1 Bargaining Power of Suppliers
- 4.7.2 Bargaining Power of Buyers/Consumers
- 4.7.3 Threat of New Entrants
- 4.7.4 Threat of Substitute Products
- 4.7.5 Intensity of Competitive Rivalry
5 MARKET SEGMENTATION
- 5.1 By Deployment Model
- 5.1.1 On-premise
- 5.1.2 Cloud
- 5.1.3 Hybrid
- 5.2 By Component
- 5.2.1 Solutions
- 5.2.1.1 Network intelligence platforms
- 5.2.1.2 Performance management
- 5.2.1.3 Security analytics
- 5.2.1.4 Root-cause and anomaly detection
- 5.2.1.5 Traffic optimisation
- 5.2.2 Services
- 5.2.2.1 Professional services
- 5.2.2.2 Managed services
- 5.2.1 Solutions
- 5.3 By Application
- 5.3.1 Performance management
- 5.3.2 Fault management
- 5.3.3 Customer experience management
- 5.3.4 Security and anomaly detection
- 5.3.5 Smart routing and traffic optimisation
- 5.4 By End User
- 5.4.1 Communication service providers
- 5.4.1.1 Telecom providers
- 5.4.1.2 Internet service providers
- 5.4.1.3 Satellite communication providers
- 5.4.1.4 Cable network providers
- 5.4.2 Cloud service providers
- 5.4.3 Enterprises
- 5.4.3.1 Banking, Financial Services, and Insurance (BFSI)
- 5.4.3.2 Healthcare
- 5.4.3.3 Retail and e-commerce
- 5.4.3.4 Manufacturing
- 5.4.3.5 Government and public sector
- 5.4.1 Communication service providers
- 5.5 By Geography
- 5.5.1 North America
- 5.5.1.1 United States
- 5.5.1.2 Canada
- 5.5.2 South America
- 5.5.2.1 Brazil
- 5.5.2.2 Rest of South America
- 5.5.3 Europe
- 5.5.3.1 United Kingdom
- 5.5.3.2 Germany
- 5.5.3.3 France
- 5.5.3.4 Italy
- 5.5.3.5 Spain
- 5.5.3.6 Russia
- 5.5.3.7 Rest of Europe
- 5.5.4 Asia-Pacific
- 5.5.4.1 China
- 5.5.4.2 Japan
- 5.5.4.3 India
- 5.5.4.4 South Korea
- 5.5.4.5 Australia and New Zealand
- 5.5.4.6 Rest of Asia-Pacific
- 5.5.5 Middle East and Africa
- 5.5.5.1 Middle East
- 5.5.5.1.1 Saudi Arabia
- 5.5.5.1.2 United Arab Emirates
- 5.5.5.1.3 Turkey
- 5.5.5.1.4 Rest of Middle East
- 5.5.5.2 Africa
- 5.5.5.2.1 South Africa
- 5.5.5.2.2 Rest of Africa
- 5.5.1 North America
6 COMPETITIVE LANDSCAPE
- 6.1 Market Concentration
- 6.2 Strategic Moves
- 6.3 Market Share Analysis
- 6.4 Company Profiles {(includes Global level Overview, Market level overview, Core Segments, Financials as available, Strategic Information, Market Rank/Share for key companies, Products and Services, and Recent Developments)}
- 6.4.1 Accenture PLC
- 6.4.2 Cisco Systems Inc.
- 6.4.3 Hewlett Packard Enterprise Co.
- 6.4.4 IBM Corporation
- 6.4.5 Juniper Networks Inc.
- 6.4.6 SAS Institute Inc.
- 6.4.7 Sandvine Corporation
- 6.4.8 Alcatel-Lucent Enterprise SA
- 6.4.9 TIBCO Software Inc.
- 6.4.10 Broadcom Inc. (incl. VMware)
- 6.4.11 Nokia Corporation
- 6.4.12 Ericsson Inc.
- 6.4.13 Huawei Technologies Co. Ltd.
- 6.4.14 Dell Technologies Inc.
- 6.4.15 Oracle Corporation
- 6.4.16 NetScout Systems Inc.
- 6.4.17 Allot Ltd.
- 6.4.18 NEC Corporation
- 6.4.19 ZTE Corporation
- 6.4.20 Amdocs Ltd.
- 6.4.21 F5 Networks Inc.
- 6.4.22 Splunk Inc.
- 6.4.23 Keysight Technologies Inc.
7 MARKET OPPORTUNITIES AND FUTURE TRENDS
- 7.1 White-space and Unmet-need Assessment
 網路分析市場:2026-2032年全球市場預測(依產品類型、定價模式、應用、部署模式及最終用戶分類)
 2026年全球網路切片分析市場報告
 網路分析市場分析及預測(至2035年):類型、產品類型、服務、技術、組件、應用、部署模式、最終用戶、解決方案2026年全球網路數據分析(NWDAF)整合服務市場報告2026年全球網路分析市場報告網路安全分析市場分析及預測(至 2035 年):按類型、產品類型、服務、技術、組件、應用、部署模式、最終用戶、功能和解決方案分類
 網路分析市場 - 全球產業規模、佔有率、趨勢、機會、預測:按組件、網路類型、最終用戶、地區和競爭對手分類,2021-2031 年
 網路分析市場規模、佔有率、成長及全球產業分析:依類型、應用和地區劃分的洞察與未來預測(2026-2034 年)網路分析市場 - 2026-2031 年預測
 網路分析市場