


 |
市場調查報告書
商品編碼
1848122
快遞、速遞和小包裹(CEP):市場佔有率分析、行業趨勢、統計數據和成長預測 (2025-2030)Courier, Express, And Parcel (CEP) - Market Share Analysis, Industry Trends & Statistics, Growth Forecasts (2025 - 2030) |
||||||
※ 本網頁內容可能與最新版本有所差異。詳細情況請與我們聯繫。
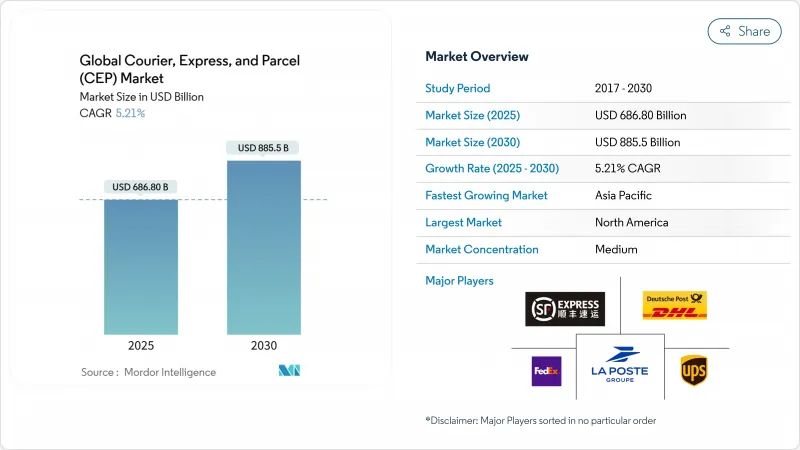
預計到 2025 年,快遞、速遞和小包裹(CEP) 市場規模將達到 6,868 億美元,到 2030 年將達到 8,855 億美元,2025 年至 2030 年的複合年成長率為 5.21%。
這一前景預示著物流業正從疫情期間的激增轉向以優質服務、網路自動化和選擇性運力擴張為驅動的穩步成長。儘管電子商務仍然是貨運量的核心驅動力,但營運商目前正致力於透過動態定價、技術賦能的路線規劃以及增值垂直服務(例如醫療物流)來保障利潤率。隨著越來越多的中小型出口商使用數位化市場,跨境貨運量正在成長,但成熟地區的國內貨運量已趨於平穩。資本持續流向能夠整合航空運力、區域公路車隊和宅配樞紐以最佳化成本和速度的數位化優先網路。諸如DSV收購DB Schenker之類的併購交易凸顯了規模的戰略價值,因為勞動力短缺、燃油中性車隊和航空貨運限制提高了營運門檻。
全球快遞、速遞與小包裹(CEP) 市場趨勢與洞察
電子商務的興起推動了新興亞太地區B2C小包裹量的成長
智慧型主導購物正在推動小包裹需求成長,目前57%的網購用戶使用行動裝置進行購物。跨境量也不斷成長,主要得益於社群電商的蓬勃發展,預計到2030年,社群電商的銷售額將達到8.5兆美元。中國的跨境小包裹流量以及預計到2025年將達到21.4兆元(3.1兆美元)的數位零售市場都在不斷擴大,促使營運商部署靈活的樞紐來管理各種類型的包裹。在東南亞地區,對網路建設的投資旨在擴大農村地區的覆蓋範圍,提高配送時間的可靠性,確保服務水準與城市市場持平。
歐洲地區中小企業利用數位市場進行跨國出口
歐洲中小企業擴大透過線上市場直接向全球客戶出貨,這推動了海關協調的需求。世界貿易組織90個成員國正在就電子商務制定通用規則進行談判,以減少程序摩擦。自動化申報和基於區塊鏈的文件系統可以將平均貿易成本降低11%。標準化的跨境服務將使企業能夠集中貨運量、降低單位成本,並擴大快遞、速遞和小包裹(CEP)市場。
跨太平洋航線的航空運力限制
儘管2024年貨機供應量成長了8%,但預計2025年來自中國的需求將成長20%,導致艙位緊張,現貨貨運價格年增15%。新飛機交付有限,將使未來成長率僅4.4%。隨著營運商優先運輸高價商品並發展二級樞紐,成本上升將對快遞、速遞和小包裹(CEP)市場的複合年成長率構成壓力。
細分市場分析
2025年至2030年間,醫療保健產業的複合年成長率(CAGR)將達到5.75%,成為成長最快的產業。 DHL和UPS分別計劃將醫療保健領域的銷售額提升至108億美元和200億美元,凸顯了其戰略重點。即時數據記錄器確保了合規性,並為快遞小包裹(CEP)市場定價中包含的額外費用提供了依據。
到2024年,電子商務將佔銷售額的36.94%,但在成熟地區成長將逐漸放緩。製造業和批發業將提供穩定的B2B交易,但隨著數位化減少紙本文件的交換,金融服務業的出貨量將會下降。
預計2025年至2030年,國際小包裹將以5.57%的複合年成長率成長。貿易協定和海關程序的數位化將簡化清關流程,從而推動跨境快遞、速遞和小包裹(CEP)服務的市場規模成長。國內配送在2024年將維持69.09%的市場佔有率,但成熟的電子商務的興起將抑制其成長。
百世公司推出的每公斤7元人民幣(約0.98美元)的快遞服務等技術賦能型服務,將東南亞消費者與中國商家連結起來,展現了出口一體化帶來的成本節約。世貿組織數位貿易框架和區域全面經濟夥伴關係協定(RCEP)的關稅協調將進一步鼓勵中小企業進行國際運輸,為成熟的一體化企業拓展獲利管道。
區域分析
2024年,北美將佔總銷售額的36.76%,這主要得益於消費者對兩日達服務的期望以及完善的末端物流設施。持續的司機短缺推高了營運成本,促使企業進行自動化試驗,並收購UPS-Andlauer等醫療保健領域的專業公司,以確保在細分市場中獲得成長。都市區微型履約中心和當日達服務有助於穩定保費,即使貨運量成長放緩。
亞太地區將成為成長最快的地區,2025年至2030年的複合年成長率將達到6.77%,主要得益於跨境電子商務和消費者收入的成長。中國21.4兆元人民幣(3.1兆美元)的數位零售基礎將提高小包裹密度,而RCEP關稅同盟將減少貿易摩擦。大和控股的目標是到2027會計年度實現2兆至2.4兆日圓(2,800億至3,300億美元)的銷售額,並承諾實現碳中和,以履行區域永續性義務。歐洲將傳統的郵政基礎設施與積極的脫碳政策結合。荷蘭郵政(PostNL)計劃到2030年在比荷盧經濟聯盟實現100%零排放氣體配送。 DHL和Ebri的合併結合了國際和國內優勢,每年處理超過10億英國小包裹。
中東和非洲將受益於海灣合作理事會(GCC)的多元化發展計畫。沙烏地阿拉伯的自動化中心就是一個例證,該中心透過投資將該地區打造成為洲際運輸的橋樑。中部走廊沿線的安全風險和基礎設施分散仍然是限制成長的因素,因此與擁有本地專業知識的國家郵政業者建立合作關係更為有利。南美洲雖然面積仍然較小,但正在推進的海關改革,例如巴西的「Remessa Conforme」計劃,正在提高數據品質和合規性,並透過全球平台促進跨境服務的擴展。貨幣波動和道路網路中斷使得採取靈活的、因國而異的策略勢在必行。
其他福利:
- Excel格式的市場預測(ME)表
- 3個月的分析師支持
目錄
第1章 引言
- 研究假設和市場定義
- 調查範圍
第2章調查方法
第3章執行摘要
第4章 市場情勢
- 市場概覽
- 人口統計數據
- 按經濟活動分類的GDP分配
- 按經濟活動分類的GDP成長
- 通貨膨脹
- 經濟表現及概況
- 電子商務產業的趨勢
- 製造業趨勢
- 運輸和倉儲部門的GDP
- 出口趨勢
- 進口趨勢
- 燃油價格
- 物流績效
- 基礎設施
- 法律規範
- 價值鍊和通路分析
- 市場促進因素
- 新興亞太地區電子商務滲透率的提高推動了B2C小包裹量的成長。
- 歐洲中小企業利用數位市場進行跨境出口
- 北美當日送達服務的優質化
- 海灣合作理事會國家政府推動郵政網路現代化
- 在北歐引進戶外PUDO網路
- 日本醫療保健低溫運輸合規要求
- 市場限制
- 跨太平洋航空運力限制
- 美國和英國長期存在的司機短缺問題影響了最後一公里配送成本。
- 歐盟27國實施外送車輛排放法規
- 中非走廊沿線安全風險日益上升
- 市場創新
- 波特五力分析
- 競爭對手之間的競爭
- 新進入者的威脅
- 供應商的議價能力
- 買方的議價能力
- 替代品的威脅
第5章 市場規模與成長預測
- 目的地
- 國內的
- 國際的
- 配送速度
- 表達
- 非快遞
- 模型
- 企業對企業 (B2B)
- 企業對消費者 (B2C)
- 消費者對消費者 (C2C)
- 運輸重量
- 重型貨物
- 輕量級貨幣
- 中等重量
- 交通途徑
- 航空
- 路
- 其他
- 終端用戶產業
- 電子商務
- 金融服務(BFSI)
- 衛生保健
- 製造業
- 一級產業
- 批發零售(線下)
- 其他
- 地區
- 亞太地區
- 澳洲
- 中國
- 印度
- 印尼
- 日本
- 馬來西亞
- 巴基斯坦
- 菲律賓
- 泰國
- 越南
- 亞太其他地區
- 歐洲
- 阿爾巴尼亞
- 保加利亞
- 克羅埃西亞
- 捷克共和國
- 丹麥
- 愛沙尼亞
- 芬蘭
- 法國
- 德國
- 匈牙利
- 冰島
- 義大利
- 拉脫維亞
- 立陶宛
- 荷蘭
- 挪威
- 波蘭
- 羅馬尼亞
- 俄羅斯
- 斯洛伐克共和國
- 斯洛維尼亞
- 西班牙
- 瑞典
- 瑞士
- 英國
- 其他歐洲地區
- 中東和非洲
- 卡達
- 沙烏地阿拉伯
- 阿拉伯聯合大公國
- 埃及
- 奈及利亞
- 南非
- 其他中東和非洲地區
- 北美洲
- 加拿大
- 墨西哥
- 美國
- 北美其他地區
- 南美洲
- 阿根廷
- 巴西
- 智利
- 其他南美洲
- 亞太地區
第6章 競爭情勢
- 市場集中度
- 關鍵策略舉措
- 市佔率分析
- 公司簡介
- Aramex
- Australian Postal Corporation
- Canada Post Corporation(Including Purolator, Inc.)
- China Post
- CJ Logistics
- Deppon Logistics Co., Ltd.
- DHL Group
- Empresa Brasileira de Correios e Telegrafos
- FedEx
- InPost Sp. z oo
- International Distribution Services PLC
- JD.com, Inc.(Including JD Logistics, Inc.)
- La Poste Group(Including DPD Group)
- LX International Corp.(Including LX Pantos Co., Ltd.)
- Osterreichische Post AG(Austrian Post)
- Poste Italiane
- PostNL NV
- PostNord AB
- SF Express(KEX-SF)
- SG Holdings Co., Ltd.
- STO Express Co., Ltd.(Shentong Express)
- Swiss Post, Ltd.
- United Parcel Service of America, Inc.(UPS)
- Yamato Holdings Co., Ltd.
- ZTO Express(Cayman), Inc.
第7章 市場機會與未來展望
The courier express parcel market size is valued at USD 686.8 billion in 2025 and is forecast to reach USD 885.5 billion by 2030, advancing at a 5.21% CAGR between 2025-2030.
This outlook signals a transition from the pandemic-era surge toward steadier expansion led by premium services, network automation, and selective capacity additions. E-commerce remains the core volume engine, yet operators now emphasize margin protection through dynamic pricing, technology-enabled routing, and value-added verticals such as healthcare logistics. Cross-border flows are expanding as more small and medium exporters rely on digital marketplaces, while domestic volumes plateau in mature regions. Capital continues gravitating to digital-first networks able to integrate air capacity, regional road fleets, and out-of-home delivery points to optimize cost and speed. Consolidation, highlighted by DSV's purchase of DB Schenker, underlines the strategic value of scale as labor shortages, fuel-neutral fleets, and air-freight constraints raise operating thresholds.
Global Courier, Express, And Parcel (CEP) Market Trends and Insights
E-commerce Penetration Driving B2C Parcel Volumes in Emerging Asia-Pacific Region
Smartphone-led shopping now drives parcel demand as 57% of online buyers purchase via mobile devices. Cross-border volumes climb in tandem with social-commerce sales, projected at USD 8.5 trillion by 2030. China's cross-border parcel flows grew alongside a RMB 21.4 trillion (USD 3.01 trillion) digital-retail sector in 2025, prompting operators to deploy flexible hubs that manage varied package profiles. Network investments across Southeast Asia target wider rural reach and delivery-time certainty, ensuring service parity with urban markets.
Cross-Border SME Exports Leveraging Digital Marketplaces in Europe Region
European SMEs increasingly ship direct to global customers through online marketplaces, intensifying demand for harmonized customs clearance. Negotiations among 90 WTO members seek common e-commerce rules to reduce procedural friction. Automated declarations and blockchain-backed documents can cut average trade costs by 11%. Standardized cross-border services enable operators to pool volumes, lower unit costs, and enlarge the courier express parcel market.
Air-Capacity Constraints on the Trans-Pacific Lanes
Freighter supply rose 8% in 2024, yet demand from China is set to climb 20% in 2025, tightening space and lifting spot rates 15% year-on-year. Limited new-aircraft deliveries cap future growth near 4.4%. Operators prioritize high-value goods and explore secondary hubs, but elevated costs weigh on the courier express parcel market CAGR.
Other drivers and restraints analyzed in the detailed report include:
- Same-Day Delivery Premiumization in Urban North America
- Government Push for Postal Network Modernization in GCC Countries
- Chronic Driver Shortage
For complete list of drivers and restraints, kindly check the Table Of Contents.
Segment Analysis
Healthcare recorded the fastest 5.75% CAGR between 2025-2030 as aging populations lift demand for temperature-controlled deliveries. DHL and UPS aim to grow healthcare revenues to USD 10.8 billion and USD 20 billion, respectively, underscoring strategic focus. Real-time data loggers ensure compliance, justifying premium fees embedded within the overall courier express parcel market pricing.
E-commerce still represented 36.94% of 2024 revenue but shows a gradual deceleration in mature regions. Manufacturing and wholesale trade offer steady B2B flows, while financial services shipments decline as digitization reduces physical document exchange.
International parcels are projected to expand at a 5.57% CAGR between 2025-2030. The courier express parcel market size tied to cross-border flows is set to widen as trade agreements and electronic customs procedures simplify clearance. Domestic deliveries keep a 69.09% share in 2024, but mature e-commerce penetration caps growth.
Technology-enabled services such as BEST Inc.'s CNY 7 (USD 0.98) per-kilogram offering connect Southeast Asian shoppers to Chinese merchants, illustrating cost reductions through consolidated exports. WTO digital-trade frameworks and RCEP customs harmonization further encourage SMEs to ship internationally, expanding high-margin lanes for established integrators.
The Global Courier, Express, and Parcel (CEP) Market Report is Segmented by Destination (Domestic and International), by Speed of Delivery (Express and More), by Model (Business-To-Business and More), by Shipment Weight (Heavy Weight Shipments and More), Mode of Transport (Air and More), by End User Industry (E-Commerce and More), and by Geography (Asia-Pacific and More). The Market Forecasts are Provided in Terms of Value (USD).
Geography Analysis
North America commanded 36.76% of 2024 revenue, anchored by consumer expectations for two-day delivery and developed last-mile assets. Persistent driver shortages magnify operating costs, prompting automation pilots and the acquisition of healthcare specialists such as UPS-Andlauer to secure growth niches. Urban micro-fulfillment centers and same-day offerings support premium-rate stability even as volume growth moderates.
Asia-Pacific is the fastest-growing region at 6.77% CAGR between 2025-2030, propelled by cross-border e-commerce and rising consumer incomes. China's RMB 21.4 trillion (USD 3.01 trillion) digital retail base drives parcel density, while RCEP customs alignment lowers friction. Yamato Holdings targets JPY 2-2.4 trillion (USD 0.28-0.33 trillion) revenue by FY2027, embedding carbon-neutral pledges to align with regional sustainability mandates. Europe combines legacy postal infrastructure with aggressive decarbonization policies. The ban on new combustion vans by 2035 accelerates fleet electrification; PostNL plans 100% emission-free Benelux delivery by 2030. DHL's merger with Evri pools international and domestic strengths to handle more than 1 billion UK parcels per year.
Middle East and Africa benefit from GCC diversification programs. Saudi Arabia's automated hub exemplifies investments positioning the region as an intercontinental transit bridge. Security risks on central corridors and fragmented infrastructure still temper growth, favoring partnerships with national postal operators that bring local expertise. South America remains smaller but developing customs reforms, such as Brazil's Remessa Conforme program, improve data quality and compliance, encouraging global platforms to expand cross-border offerings. Currency volatility and patchy road networks require flexible, country-specific approaches.
- Aramex
- Australian Postal Corporation
- Canada Post Corporation (Including Purolator, Inc.)
- China Post
- CJ Logistics
- Deppon Logistics Co., Ltd.
- DHL Group
- Empresa Brasileira de Correios e Telegrafos
- FedEx
- InPost Sp. z o.o.
- International Distribution Services PLC
- JD.com, Inc. (Including JD Logistics, Inc.)
- La Poste Group (Including DPD Group)
- LX International Corp. (Including LX Pantos Co., Ltd.)
- Osterreichische Post AG (Austrian Post)
- Poste Italiane
- PostNL N.V.
- PostNord AB
- SF Express (KEX-SF)
- SG Holdings Co., Ltd.
- STO Express Co., Ltd. (Shentong Express)
- Swiss Post, Ltd.
- United Parcel Service of America, Inc. (UPS)
- Yamato Holdings Co., Ltd.
- ZTO Express (Cayman), Inc.
Additional Benefits:
- The market estimate (ME) sheet in Excel format
- 3 months of analyst support
TABLE OF CONTENTS
1 Introduction
- 1.1 Study Assumptions and Market Definition
- 1.2 Scope of the Study
2 Research Methodology
3 Executive Summary
4 Market Landscape
- 4.1 Market Overview
- 4.2 Demographics
- 4.3 GDP Distribution by Economic Activity
- 4.4 GDP Growth by Economic Activity
- 4.5 Inflation
- 4.6 Economic Performance and Profile
- 4.6.1 Trends in E-Commerce Industry
- 4.6.2 Trends in Manufacturing Industry
- 4.7 Transport and Storage Sector GDP
- 4.8 Export Trends
- 4.9 Import Trends
- 4.10 Fuel Price
- 4.11 Logistics Performance
- 4.12 Infrastructure
- 4.13 Regulatory Framework
- 4.14 Value Chain and Distribution Channel Analysis
- 4.15 Market Drivers
- 4.15.1 E-commerce Penetration Driving B2C Parcel Volumes in Emerging Asia-Pacific Region
- 4.15.2 Cross-Border SME Exports Leveraging Digital Marketplaces in Europe Region
- 4.15.3 Same-Day Delivery Premiumization in Urban North America
- 4.15.4 Government Push for Postal Network Modernization in GCC Countries
- 4.15.5 Adoption of Out-of-Home PUDO Networks in Nordics
- 4.15.6 Cold-Chain Compliance Requirements for Healthcare CEP in Japan
- 4.16 Market Restraints
- 4.16.1 Air Capacity Constraints Witnessed on the Trans-Pacific Lanes
- 4.16.2 Chronic Driver Shortage Impacting Last-Mile Costs in the US and UK
- 4.16.3 Regulatory Caps Implementation on Delivery Fleet Emissions in EU27
- 4.16.4 Rising Security Risks on Africa's Central Corridor Routes
- 4.17 Technology Innovations in the Market
- 4.18 Porter's Five Forces Analysis
- 4.18.1 Competitive Rivalry
- 4.18.2 Threat of New Entrants
- 4.18.3 Bargaining Power of Suppliers
- 4.18.4 Bargaining Power of Buyers
- 4.18.5 Threat of Substitutes
5 Market Size and Growth Forecasts (Value, USD)
- 5.1 Destination
- 5.1.1 Domestic
- 5.1.2 International
- 5.2 Speed of Delivery
- 5.2.1 Express
- 5.2.2 Non-Express
- 5.3 Model
- 5.3.1 Business-to-Business (B2B)
- 5.3.2 Business-to-Consumer (B2C)
- 5.3.3 Consumer-to-Consumer (C2C)
- 5.4 Shipment Weight
- 5.4.1 Heavy Weight Shipments
- 5.4.2 Light Weight Shipments
- 5.4.3 Medium Weight Shipments
- 5.5 Mode of Transport
- 5.5.1 Air
- 5.5.2 Road
- 5.5.3 Others
- 5.6 End User Industry
- 5.6.1 E-Commerce
- 5.6.2 Financial Services (BFSI)
- 5.6.3 Healthcare
- 5.6.4 Manufacturing
- 5.6.5 Primary Industry
- 5.6.6 Wholesale and Retail Trade (Offline)
- 5.6.7 Others
- 5.7 Geography
- 5.7.1 Asia-Pacific
- 5.7.1.1 Australia
- 5.7.1.2 China
- 5.7.1.3 India
- 5.7.1.4 Indonesia
- 5.7.1.5 Japan
- 5.7.1.6 Malaysia
- 5.7.1.7 Pakistan
- 5.7.1.8 Philippines
- 5.7.1.9 Thailand
- 5.7.1.10 Vietnam
- 5.7.1.11 Rest of Asia-Pacific
- 5.7.2 Europe
- 5.7.2.1 Albania
- 5.7.2.2 Bulgaria
- 5.7.2.3 Croatia
- 5.7.2.4 Czech Republic
- 5.7.2.5 Denmark
- 5.7.2.6 Estonia
- 5.7.2.7 Finland
- 5.7.2.8 France
- 5.7.2.9 Germany
- 5.7.2.10 Hungary
- 5.7.2.11 Iceland
- 5.7.2.12 Italy
- 5.7.2.13 Latvia
- 5.7.2.14 Lithuania
- 5.7.2.15 Netherlands
- 5.7.2.16 Norway
- 5.7.2.17 Poland
- 5.7.2.18 Romania
- 5.7.2.19 Russia
- 5.7.2.20 Slovak Republic
- 5.7.2.21 Slovenia
- 5.7.2.22 Spain
- 5.7.2.23 Sweden
- 5.7.2.24 Switzerland
- 5.7.2.25 United Kingdom
- 5.7.2.26 Rest of Europe
- 5.7.3 Middle East and Africa
- 5.7.3.1 Qatar
- 5.7.3.2 Saudi Arabia
- 5.7.3.3 UAE
- 5.7.3.4 Egypt
- 5.7.3.5 Nigeria
- 5.7.3.6 South Africa
- 5.7.3.7 Rest of Middle East and Africa
- 5.7.4 North America
- 5.7.4.1 Canada
- 5.7.4.2 Mexico
- 5.7.4.3 United States
- 5.7.4.4 Rest of North America
- 5.7.5 South America
- 5.7.5.1 Argentina
- 5.7.5.2 Brazil
- 5.7.5.3 Chile
- 5.7.5.4 Rest of South America
- 5.7.1 Asia-Pacific
6 Competitive Landscape
- 6.1 Market Concentration
- 6.2 Key Strategic Moves
- 6.3 Market Share Analysis
- 6.4 Company Profiles (Includes Global Level Overview, Market Level Overview, Core Segments, Financials as Available, Strategic Information, Market Rank/Share for Key Companies, Products and Services, and Recent Developments)
- 6.4.1 Aramex
- 6.4.2 Australian Postal Corporation
- 6.4.3 Canada Post Corporation (Including Purolator, Inc.)
- 6.4.4 China Post
- 6.4.5 CJ Logistics
- 6.4.6 Deppon Logistics Co., Ltd.
- 6.4.7 DHL Group
- 6.4.8 Empresa Brasileira de Correios e Telegrafos
- 6.4.9 FedEx
- 6.4.10 InPost Sp. z o.o.
- 6.4.11 International Distribution Services PLC
- 6.4.12 JD.com, Inc. (Including JD Logistics, Inc.)
- 6.4.13 La Poste Group (Including DPD Group)
- 6.4.14 LX International Corp. (Including LX Pantos Co., Ltd.)
- 6.4.15 Osterreichische Post AG (Austrian Post)
- 6.4.16 Poste Italiane
- 6.4.17 PostNL N.V.
- 6.4.18 PostNord AB
- 6.4.19 SF Express (KEX-SF)
- 6.4.20 SG Holdings Co., Ltd.
- 6.4.21 STO Express Co., Ltd. (Shentong Express)
- 6.4.22 Swiss Post, Ltd.
- 6.4.23 United Parcel Service of America, Inc. (UPS)
- 6.4.24 Yamato Holdings Co., Ltd.
- 6.4.25 ZTO Express (Cayman), Inc.
7 Market Opportunities and Future Outlook
- 7.1 White-Space and Unmet-Need Assessment
 2026年全球超當地語系化配送應用市場報告
 2026-2030年全球宅配包裹(CEP)市場
 宅配、包裹及小包裹市場報告:按服務類型、目的地、物品、最終用途行業和地區分類(2026-2034 年)2026年全球宅配車輛市場報告
 超當地語系化配送應用市場分析及預測(至2035年):按類型、產品、服務、技術、組件、應用、設備、流程、部署類型及最終用戶分類
 亞太地區快遞、速遞和小包裹(CEP):市場佔有率分析、行業趨勢和統計數據、成長預測(2026-2031)泰國快遞、速遞和小包裹(CEP) 市場佔有率分析、行業趨勢和統計數據、成長預測 (2026-2031)美國快遞、速遞和小包裹(CEP):市場佔有率分析、行業趨勢和統計數據、成長預測 (2026-2031)英國快遞、速遞和小包裹(CEP) 市場佔有率分析、行業趨勢和統計數據、成長預測 (2026-2031)越南快遞、速遞和小包裹(CEP):市場佔有率分析、行業趨勢和統計數據、成長預測(2026-2031)