


 |
市場調查報告書
商品編碼
1846270
安全雷射掃描器:市場佔有率分析、行業趨勢、統計數據和成長預測(2025-2030 年)Safety Laser Scanner - Market Share Analysis, Industry Trends & Statistics, Growth Forecasts (2025 - 2030) |
||||||
※ 本網頁內容可能與最新版本有所差異。詳細情況請與我們聯繫。
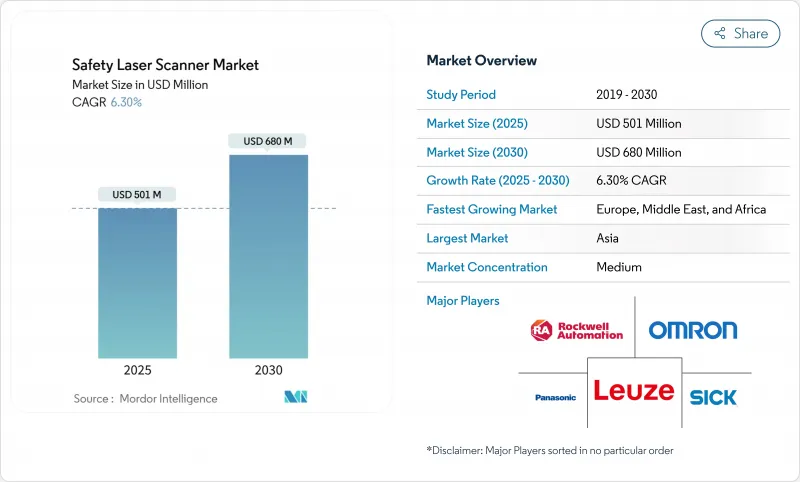
預計到 2025 年,安全雷射掃描儀市場規模將達到 5.01 億美元,到 2030 年將達到 6.8 億美元,複合年成長率為 6.3%。
亞太地區將以7.5%的複合年成長率成為成長最快的地區,這主要得益於中國電子自動化和日本「暗倉」計劃的蓬勃發展。自動導引車(AGV)和自主移動機器人(AMR)的普及、ISO 13849-1和IEC 61496標準的實施,以及向整合工業4.0架構的預測性、數據豐富的安全系統轉型,都推動了強勁的發展勢頭。市場競爭強度適中,領先供應商透過275度視野角、safeHDDM®濾波和板載分析等技術實現差異化,而新參與企業則致力於推廣經濟高效的3D超音波和視覺解決方案。巴西的NR-12和澳洲的IECEx等區域法規提高了市場進入門檻,但也為專用外殼和防爆設計帶來了機會。
全球安全雷射掃描器市場趨勢與洞察
歐洲內部物流樞紐快速採用自主移動機器人技術
歐洲的倉庫正在部署每天執行超過1000次任務的自主移動機器人(AMR),例如ifm electronic GmbH公司的MiR100,其覆蓋範圍可達30公里。 ISO 3691-4標準要求動態保護區域變化,而固定防護裝置無法滿足這些變化。因此,具備多區域切換和乙太網路/IP介面的行動式安全雷射掃描儀正成為物料輸送自動化不可或缺的關鍵推動因素,而不僅僅是合規設備。
德國汽車OEM廠商實施ISO 13849-1和IEC 61496標準
德國汽車製造商現在要求使用符合SIL3認證標準的掃描儀,並附帶EN ISO 12100:2024風險評估文件。新標準涵蓋網路安全設計以及基於人工智慧的危險預測和識別。提供自適應自診斷掃描器的供應商已獲得優先供應商地位,但前期驗證成本推高了系統價格。
巴西和阿根廷二級供應商的SIL2/PLd認證成本高昂
巴西的 NR-12 要求提供葡萄牙語文件並由現場工程師進行驗證,這會使掃描儀的購買價格增加高達 20%,從而減緩小型供應商的採用速度並抑制該地區的成長,但同時也為擁有本地合規團隊的供應商開闢了諮詢業務的市場。
細分市場分析
到2024年,固定式雷射掃描器將佔據安全雷射掃描器市場57.1%的佔有率,這得益於其在固定式壓力機和輸送機領域的成熟運作。然而,隨著自主移動機器人(AMR)在倉庫中日益普及,移動式雷射掃描器市場到2030年的複合年成長率(CAGR)將達到8.5%。行動式安全雷射掃描器市場預計到2030年將達到2.7億美元,主要得益於其緊湊、節能的設計和符合ISO 3691-4標準。例如,Pilz公司的PSENscan最多可配置70個字段,使AMR能夠在幾毫秒內重新調整其防護功能。固定式雷射掃描器仍然主導著高精度汽車車體白線市場,在該市場中,可重複的防護幾何形狀比靈活性更為重要。
防護區域的偏好正在改變:5米掃描儀在覆蓋範圍和延遲之間取得了良好的平衡,預計到2024年將佔總銷量的42%,而配備最佳化光學系統的7米型號的年複合成長率將達到7.2%。同時,3D掃描仍將是複雜焊接單元的高階細分市場,而注重成本的買家則會繼續選擇堅固耐用的2D設備。
到2024年,輸送機和包裝應用將佔總收入的33%,而區域防護和門禁控制領域將以7.5%的複合年成長率實現最快成長,這主要得益於更嚴格的人員安全法規。多區域掃描器現在取代了圍繞機器人焊接工位和堆垛機的機械圍欄,從而提高了生產線的靈活性。 SICK公司的microScan3可同時運作三個安全區域。隨著保險公司要求認證,預計到2030年,用於區域防護的安全雷射掃描器的市佔率將上升至37%。
AGV 和 AMR 目前佔據第二大市場佔有率,但隨著物流自動化獲得大量資本預算(尤其是來自電商營運商的預算),它們很可能很快就會超越傳送帶。掃描器 OEM 廠商正在整合診斷閘道器,以便車隊管理軟體能夠擷取健康資料並安排預測性維護,將運轉率維持在 99% 以上。
全球安全雷射掃描器市場按類型(固定式安全雷射掃描器、行動安全雷射掃描器及其他)、應用領域(汽車、食品飲料及其他)、終端用戶產業(汽車、醫療保健、製藥)和地區(北美、歐洲、亞太及其他)進行細分。市場規模和預測均以美元計價。
區域分析
到2024年,歐洲將佔據35%的收益,這主要得益於嚴格的CE設備指令和密集的整合商網路。同時,北歐地區的機器人技術正轉向基於攝影機的系統,這給價格帶來了壓力,同時也加速了影像處理附加元件的普及。針對碳中和生產的區域津貼計畫將進一步鼓勵自動化,間接促進掃描儀的銷售。
亞太地區正以7.5%的複合年成長率成長。中國的電子工廠需要整合協作機器人的速度和分離監控系統,而日本的物流公司則致力於實現無人值守營運。同時,台灣和韓國技術純熟勞工短缺,促使市場對包含遠距離診斷的承包安全解決方案的需求激增。印度的一級汽車供應商已開始試用乙太網路/IP掃描儀,以確保待開發區線的未來發展,但進口關稅仍是限制其快速擴張的因素。
在北美,美國職業安全與健康管理局 (OSHA) 已核准雷射防護裝置,明確了 NRTL 認證途徑。金屬成型中小企業的維修計劃和新建電動車電池工廠正在推動市場需求。然而,對傳統 CAN 網路的廣泛依賴減緩了向資料豐富的乙太網路模型的過渡。南美洲正努力應對 NR-12 的成本負擔,中小企業尋求更便宜的機械防護裝置,而跨國 OEM 廠商則為了滿足企業安全 KPI 而繼續採購。非洲仍處於起步階段,礦場開始採用配備掃描器的機器人鑽機,但數量仍然很少。
其他福利:
- Excel格式的市場預測(ME)表
- 3個月的分析師支持
目錄
第1章 引言
- 研究假設和市場定義
- 調查範圍
第2章調查方法
第3章執行摘要
第4章 市場情勢
- 市場概覽
- 市場促進因素
- 歐洲內部物流樞紐快速採用自主移動機器人技術
- 德國汽車OEM廠商實施ISO 13849-1和IEC 61496標準
- 為美國改造老舊機械設備以符合 OSHA 1910.212 標準
- 協作機器人在中國電子組裝蓬勃發展
- 日本第三方物流公司的暗倉正在推動對270°行動掃描器的需求。
- 市場限制
- 巴西和阿根廷二級供應商的SIL2/PLd認證成本高昂
- 澳洲某礦場因粉塵引發的故障
- Nordic Robotics 的視覺安全攝影機正在降低價格
- 中東中小企業掃描器整合的技術工人缺口
- 價值/供應鏈分析
- 監理與技術展望
- 波特五力分析
- 新進入者的威脅
- 買方/消費者的議價能力
- 供應商的議價能力
- 替代品的威脅
- 競爭對手之間的競爭強度
第5章 市場規模與成長預測
- 按類型
- 固定式安全雷射掃描儀
- 行動安全雷射掃描儀
- 防護視野(3公尺、5公尺、7公尺)
- 掃描尺寸(2D、3D)
- 連接方式(乙太網路、CAN、IO-Link)
- 透過使用
- AGV 和 AMR
- 機器人單元
- 輸送機和包裝線
- 區域保護和門禁控制
- 按最終用戶產業
- 汽車產業
- 飲食
- 醫療保健和製藥
- 消費品和電子產品
- 物流/倉儲
- 金屬/重型機械
- 石油和天然氣
- 按連接性
- Ethernet
- CAN
- IO-Link
- 按地區
- 北美洲
- 美國
- 加拿大
- 墨西哥
- 歐洲
- 英國
- 德國
- 法國
- 義大利
- 其他歐洲國家
- 亞太地區
- 中國
- 日本
- 印度
- 韓國
- 其他亞太地區
- 中東
- 以色列
- 沙烏地阿拉伯
- 阿拉伯聯合大公國
- 土耳其
- 其他中東地區
- 非洲
- 南非
- 埃及
- 其他非洲國家
- 南美洲
- 巴西
- 阿根廷
- 其他南美
- 北美洲
第6章 競爭情勢
- 市場集中度
- 策略舉措
- 市佔率分析
- 公司簡介
- SICK AG
- OMRON Corporation
- Keyence Corporation
- Leuze Electronic GmbH
- Panasonic Industrial Sensors
- Banner Engineering
- Hans Turck GmbH
- Hokuyo Automatic Co., Ltd.
- IDEC Corporation
- Pilz GmbH and Co. KG
- Datalogic SpA
- Rockwell Automation Inc.
- Arcus Automation Pvt Ltd.
- FARO Technologies, Inc.
- Hexagon AB
- Trimble Inc.
- Pepperl+Fuchs SE
- ABB Ltd.
- Blickfeld GmbH
- Slamcore Ltd.
第7章 市場機會與未來展望
The safety laser scanner market is valued at USD 501 million in 2025 and is forecast to expand to USD 680 million by 2030, advancing at a 6.3% CAGR.
Europe anchors demand with a 35% revenue contribution, while Asia-Pacific is set to post the fastest 7.5% CAGR, buoyed by Chinese electronics automation and "dark-warehouse" projects in Japan-and-r15-08-(industrial-mobile-robots)-implementation). Strong momentum comes from automated guided vehicles (AGVs) and autonomous mobile robots (AMRs), enforcement of ISO 13849-1 and IEC 61496, and a shift toward predictive, data-rich safety systems that integrate with Industry 4.0 architectures. Competitive intensity is moderate: leading vendors differentiate through 275-degree fields of view, safeHDDM(R) filtering, and on-board analytics, while new entrants push cost-efficient 3D ultrasonic or vision-based alternatives. Region-specific regulations, such as Brazil's NR-12 and Australia's IECEx mandates, raise entry barriers but also open opportunities for specialist housings and explosion-proof designs.
Global Safety Laser Scanner Market Trends and Insights
Rapid Adoption of AMRs in European Intralogistics Hubs
European warehouses now field AMR fleets exceeding 1,000 daily missions, such as ifm electronic GmbH's MiR100 deployment covering 30 km of routes. ISO 3691-4 obliges dynamic protective-field changes, which stationary guarding cannot meet. Consequently, mobile safety laser scanners with multi-zone switching and Ethernet/IP interfaces become essential enablers, rather than mere compliance devices, for material-handling automation.
ISO 13849-1 & IEC 61496 Enforcement at German Automotive OEMs
German carmakers now demand SIL3-validated scanners packaged with full EN ISO 12100:2024 risk-assessment files. New criteria include cybersecurity design and AI-based predictive hazard identification. Vendors that offer adaptive, self-diagnosing scanners secure preferred-supplier status, although upfront validation costs increase system pricing.
High SIL2/PLd Certification Costs for Brazilian & Argentine Tier-2 Suppliers
Brazil's NR-12 requires Portuguese documentation and on-site engineer validation, adding up to 20% of a scanner's purchase price. Smaller suppliers delay adoption, slowing regional growth yet opening consultancy niches for vendors with local compliance teams.
Other drivers and restraints analyzed in the detailed report include:
- Retrofitting Legacy Machinery in US SMEs for OSHA 1910.212 Compliance
- Collaborative-Robot Boom in Chinese Electronics Assembly
- Dust-Induced False Trips in Australian Mining Sites
For complete list of drivers and restraints, kindly check the Table Of Contents.
Segment Analysis
Stationary units retained 57.1% of the safety laser scanner market in 2024, supported by proven uptime on fixed presses and conveyors. Mobile variants, however, are tracking an 8.5% CAGR to 2030 as AMRs proliferate in warehouses. The safety laser scanner market size for mobile solutions is projected to reach USD 270 million by 2030, underpinned by compact battery-efficient designs and ISO 3691-4 compliance. Pilz's PSENscan, for instance, ships with up to 70 configurable fields, letting AMRs recalibrate protection in milliseconds. Stationary models still dominate high-precision automotive body-in-white lines where repeatable guard shapes outweigh flexibility.
Protective-field preference is shifting. Five-meter scanners captured 42% of 2024 revenue because they balance coverage and latency, whereas seven-meter models, equipped with optimized optics, will log a 7.2% CAGR. Meanwhile, 3D scanning remains a premium niche for complex welding cells, while cost-driven buyers stick with robust 2D units.
Conveyor and packaging applications drew 33% of 2024 revenue, but stricter personnel-safety rules elevate area protection & access control to the fastest 7.5% CAGR. Multi-zone scanners now ring robot welding bays and palletisers, replacing mechanical fences that impede line flexibility. SICK's microScan3 permits three separate safety fields running in parallel, a critical feature for dense packaging floors. The safety laser scanner market share for area protection is set to climb to 37% by 2030 as insurers demand certification evidence.
AGVs and AMRs form the second-largest bucket, yet they will soon eclipse conveyors because intralogistics automation receives the bulk of capital budgets, especially from e-commerce operators. Scanner OEMs embed diagnostic gateways so that fleet-management software can pull health data and schedule predictive maintenance, keeping uptime above 99%.
Global Safety Laser Scanners Market is Segmented Into Type(Stationary Safety Laser Scanners, Mobile Safety Laser Scanners, and More), Application(automotive, Food and Beverage, and More), End-User Industry (Automotive, Healthcare, and Pharmaceutical), and Geography (North America, Europe, Asia Pacific, and More ). The Market Sizes and Forecasts are Provided in Terms of Value in USD
Geography Analysis
Europe controlled 35% of 2024 revenue, leveraging strict CE machinery directives and a dense integrator network. German OEMs issue tightened procurement specs that elevate scanner functional safety, whereas Nordic robots shift to camera-based systems, creating price pressure yet also accelerating image-processing add-ons. Regional grant programs targeting carbon-neutral production further incentivize automation, indirectly lifting scanner sales.
Asia-Pacific is on course for a 7.5% CAGR. China's electronics plants require integrated Speed-and-Separation Monitoring for cobots, and Japan's logistics firms pursue lights-out operations. Meanwhile, skilled-labour shortages in Taiwan and Korea spur turnkey safety packages bundled with remote diagnostics. India's automotive Tier-1 suppliers begin piloting Ethernet/IP scanners to future-proof greenfield lines, yet import duties still curb rapid expansion.
North America benefits from OSHA endorsement of laser guarding and clearer NRTL certification pathways. Retrofit projects in metal-forming SMEs and new EV battery plants fuel demand. However, widespread reliance on legacy CAN networks slows the shift to data-rich Ethernet models. South America struggles with NR-12 cost burdens that push smaller outfits toward cheaper mechanical guards, though multinational OEMs maintain purchases to meet corporate safety KPIs. Africa remains nascent; mining enclaves adopt scanner-protected robotic drilling rigs but volumes stay low.
- SICK AG
- OMRON Corporation
- Keyence Corporation
- Leuze Electronic GmbH
- Panasonic Industrial Sensors
- Banner Engineering
- Hans Turck GmbH
- Hokuyo Automatic Co., Ltd.
- IDEC Corporation
- Pilz GmbH and Co. KG
- Datalogic SpA
- Rockwell Automation Inc.
- Arcus Automation Pvt Ltd.
- FARO Technologies, Inc.
- Hexagon AB
- Trimble Inc.
- Pepperl+Fuchs SE
- ABB Ltd.
- Blickfeld GmbH
- Slamcore Ltd.
Additional Benefits:
- The market estimate (ME) sheet in Excel format
- 3 months of analyst support
TABLE OF CONTENTS
1 INTRODUCTION
- 1.1 Study Assumptions and Market Definition
- 1.2 Scope of the Study
2 RESEARCH METHODOLOGY
3 EXECUTIVE SUMMARY
4 MARKET LANDSCAPE
- 4.1 Market Overview
- 4.2 Market Drivers
- 4.2.1 Rapid Adoption of AMRs in European Intralogistics Hubs
- 4.2.2 ISO 13849-1 and IEC 61496 Enforcement at German Automotive OEMs
- 4.2.3 Retrofitting Legacy Machinery in US SMEs for OSHA 1910.212 Compliance
- 4.2.4 Collaborative-Robot Boom in Chinese Electronics Assembly
- 4.2.5 Dark Warehouses in Japanese 3PL Driving 270° Mobile Scanner Demand
- 4.3 Market Restraints
- 4.3.1 High SIL2/PLd Certification Costs for Brazilian and Argentine Tier-2 Suppliers
- 4.3.2 Dust-Induced False Trips in Australian Mining Sites
- 4.3.3 Price Erosion from Vision-based Safety Cameras in Nordic Robotics
- 4.3.4 Skilled-Labour Gap for Scanner Integration in Middle-East SMEs
- 4.4 Value / Supply-Chain Analysis
- 4.5 Regulatory and Technological Outlook
- 4.6 Porter's Five Forces Analysis
- 4.6.1 Threat of New Entrants
- 4.6.2 Bargaining Power of Buyers/Consumers
- 4.6.3 Bargaining Power of Suppliers
- 4.6.4 Threat of Substitute Products
- 4.6.5 Intensity of Competitive Rivalry
5 MARKET SIZE AND GROWTH FORECASTS (VALUE)
- 5.1 By Type
- 5.1.1 Stationary Safety Laser Scanners
- 5.1.2 Mobile Safety Laser Scanners
- 5.1.3 Protective-Field Range (3 m, 5 m, 7 m)
- 5.1.4 Scanning Dimension (2D, 3D)
- 5.1.5 Connectivity (Ethernet, CAN, IO-Link)
- 5.2 By Application
- 5.2.1 AGVs and AMRs
- 5.2.2 Robotic Cells
- 5.2.3 Conveyor and Packaging Lines
- 5.2.4 Area Protection and Access Control
- 5.3 By End-user Industry
- 5.3.1 Automotive
- 5.3.2 Food and Beverage
- 5.3.3 Healthcare and Pharmaceuticals
- 5.3.4 Consumer Goods and Electronics
- 5.3.5 Logistics and Warehousing
- 5.3.6 Metals and Heavy Machinery
- 5.3.7 Oil and Gas
- 5.4 By Connectivity
- 5.4.1 Ethernet
- 5.4.2 CAN
- 5.4.3 IO-Link
- 5.5 By Geography
- 5.5.1 North America
- 5.5.1.1 United States
- 5.5.1.2 Canada
- 5.5.1.3 Mexico
- 5.5.2 Europe
- 5.5.2.1 United Kingdom
- 5.5.2.2 Germany
- 5.5.2.3 France
- 5.5.2.4 Italy
- 5.5.2.5 Rest of Europe
- 5.5.3 Asia-Pacific
- 5.5.3.1 China
- 5.5.3.2 Japan
- 5.5.3.3 India
- 5.5.3.4 South Korea
- 5.5.3.5 Rest of Asia-Pacific
- 5.5.4 Middle East
- 5.5.4.1 Israel
- 5.5.4.2 Saudi Arabia
- 5.5.4.3 United Arab Emirates
- 5.5.4.4 Turkey
- 5.5.4.5 Rest of Middle East
- 5.5.5 Africa
- 5.5.5.1 South Africa
- 5.5.5.2 Egypt
- 5.5.5.3 Rest of Africa
- 5.5.6 South America
- 5.5.6.1 Brazil
- 5.5.6.2 Argentina
- 5.5.6.3 Rest of South America
- 5.5.1 North America
6 COMPETITIVE LANDSCAPE
- 6.1 Market Concentration
- 6.2 Strategic Moves
- 6.3 Market Share Analysis
- 6.4 Company Profiles {(includes Global level Overview, Market level overview, Core Segments, Financials as available, Strategic Information, Market Rank/Share for key companies, Products and Services, and Recent Developments)}
- 6.4.1 SICK AG
- 6.4.2 OMRON Corporation
- 6.4.3 Keyence Corporation
- 6.4.4 Leuze Electronic GmbH
- 6.4.5 Panasonic Industrial Sensors
- 6.4.6 Banner Engineering
- 6.4.7 Hans Turck GmbH
- 6.4.8 Hokuyo Automatic Co., Ltd.
- 6.4.9 IDEC Corporation
- 6.4.10 Pilz GmbH and Co. KG
- 6.4.11 Datalogic SpA
- 6.4.12 Rockwell Automation Inc.
- 6.4.13 Arcus Automation Pvt Ltd.
- 6.4.14 FARO Technologies, Inc.
- 6.4.15 Hexagon AB
- 6.4.16 Trimble Inc.
- 6.4.17 Pepperl+Fuchs SE
- 6.4.18 ABB Ltd.
- 6.4.19 Blickfeld GmbH
- 6.4.20 Slamcore Ltd.
7 MARKET OPPORTUNITIES AND FUTURE OUTLOOK
- 7.1 White-space and Unmet-need Assessment


