


 |
市場調查報告書
商品編碼
1846245
液體分析儀器:市場佔有率分析、行業趨勢、統計數據和成長預測(2025-2030 年)Liquid Analytical Instrument - Market Share Analysis, Industry Trends & Statistics, Growth Forecasts (2025 - 2030) |
||||||
※ 本網頁內容可能與最新版本有所差異。詳細情況請與我們聯繫。
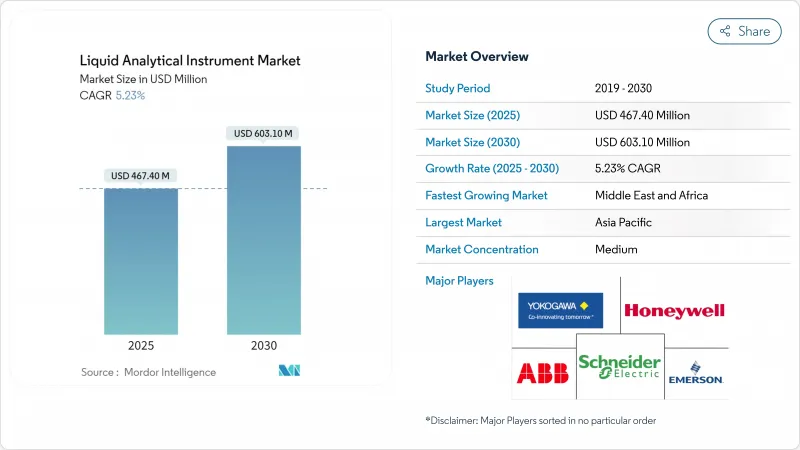
液體分析儀器市場規模預計在 2025 年達到 4.674 億美元,在 2030 年達到 6.031 億美元,在此期間的複合年成長率為 5.23%。
公共產業日益成長的合規壓力、快速發展的工業自動化以及向智慧感測器平台的轉變,正在支撐核心應用領域的穩定成長。半導體製造、一次性生物製程和綠氫能計劃中日益嚴格的水質規範,正在加速對線上pH值、電導率和總有機碳 (TOC) 分析儀的訂單。供應商正在將人工智慧融入探頭和控制器,使公用事業公司能夠從例行檢查轉向預測性維護,從而降低營運成本並滿足更嚴格的排放法規。亞太地區憑藉著積極的產能擴張,在設備採用方面處於領先地位,而中東地區的海水淡化和電解大型企劃正在擴大高鹽度儀表的覆蓋範圍。
全球液體分析儀器市場趨勢與洞察
市政公共產業加速採用智慧感測器和工業物聯網進行即時水質管理
公用事業公司正在用連續感測器網路取代定期抓取取樣,該網路可將加密資料流傳輸到雲端儀表板。辛辛那提公共污水處理區將pH值、電導率和溶氧探頭與工業物聯網平台整合後,雨水收集能力提高了20%,處理成本降低了90%。即時警報使操作員能夠在溢流發生之前轉移流量,從而減少了監管罰款和保險索賠。因此,內建無線射頻的堅固設備的更換需求高於有線傳統設備。在美國和西歐,智慧下水道系統的資金投入正在蓬勃發展,隨著各城市對百年老管網進行現代化改造,這為液體分析儀器市場提供了支撐。然而,成功的規模化擴張依賴於能夠限制系統整合瓶頸的開放通訊協定。
製藥業轉向一次性生物加工,需要隨線分析
連續生技藥品生產需要即時確認純淨水符合美國和歐洲藥典的監管限值。 Endress+Hauser 的 CA78/CA79 分析儀提供 50 秒 TOC 讀數,具有紫外線氧化和差分電導率檢測功能,可為操作員提供即時回饋以調整進料流。線上感測器可減少與離線採樣相關的停機時間,同時限制一次性生物反應器中交叉污染的風險。隨著美國、愛爾蘭和新加坡的生物製藥廠的發展,超純水分析儀供應商正在簽訂多年的框架合約。新型探頭透過自動診斷和智慧驗證功能縮短了驗證週期,吸引了擴大多分子規模的合約開發和受託製造公司。對基因和細胞治療生產的監管審查日益嚴格,進一步推動了對高精度、低維護測量平台的需求。
熟練技術人員的短缺增加了校準和維護停機成本
複雜的分析儀需要定期進行多點校準、隔膜更換以及與認證參考材料相符。許多公用事業公司難以留住技術人員,導致設備停機兩週或更長時間,並存在違規的風險。 2025 年對 350 家供水商的調查指出,勞動力差異是數位轉型的最大障礙。雖然製造商現在正在添加自清潔接頭和遠端協助功能,但關鍵維護仍然需要現場專業知識。當線上探頭未通過認證並停止批次時,停機成本會增加。培訓計畫和擴增實境支援工具只能部分緩解此限制,勞動力可用性仍然是液體分析儀市場採用的長期限制因素。
細分分析
pH/ORP分析儀將佔2024年收入的37.8%,這證實了它們在中和、消毒和化學注入過程中的普遍應用。由於監管授權通常會規定排放pH值範圍,即使是微小的偏差也可能腐蝕設備或損害生物處理,因此需求強勁。該細分市場受益於微型化、無玻璃感測器,這些感測器能夠承受微電子和製藥行業使用的高純度水。由於大多數設施已經配備pH迴路,因此成長將緩慢,但考慮到電極的劣化,更換週期仍然可靠。
總有機碳、化學需氧量和生物需氧量分析儀的複合年成長率最高,預計2030年將達到5.7%。線上紫外線-過硫酸鹽TOC系統目前反應時間僅30秒,讓操作員即時調整營養物去除曝氣。在超純水成本較高的無塵室中,這些系統的採用與零液體排放目標一致。因此,預計到2030年,TOC分析儀市場將超越傳統參數,而傳統的批量取樣測試的合規性審核仍然具有挑戰性。
隨著持續監控對分散式控制策略至關重要,隨線分析將在2024年貢獻54.7%的收入。這些系統透過乙太網路APL將數位訊號傳輸到監控平台,使操作員能夠每隔幾秒鐘最佳化一次化學藥劑投加量。在全天候運作的工廠中,線上設備是首選,因為手動採樣的停機時間會影響產量。帶有熱插拔墨盒的冗餘感測器設計可減少維護時間並提高長期可靠性。
可攜式儀表的複合年成長率最高,達到 5.2%,這得益於環境官員和合約服務人員對整個流域進行快速、檢驗測量的需求。手持式裝置現已與智慧型手機配對,使用近紅外線微光譜儀在單一比色皿中評估顏色、濁度和硝酸鹽。多參數探頭減輕了現場工程師的套件負擔,藍牙資料登錄支援雲報告。因此,液體分析儀市場正積極響應這一需求,推出堅固的 IP67 外殼、感應式充電和通用 USB-C韌體更新,即使在偏遠地區也能進行現場韌體實用化。
區域分析
2024年,亞太地區將佔全球總收入的34.2%,其中中國大陸、台灣和韓國將安裝超純水廠,為先進的半導體生產線提供水源。該地區每年新增多個300毫米晶圓廠,每個晶圓廠都需要數千個pH值、二氧化矽和電阻率環路來保障晶圓產量比率。新加坡和印度的製藥業叢集正在效仿美國GMP規範,安裝電導率網路,以即時檢驗純水的儲存。政府的環保措施正在推動紡織廠和電鍍廠的持續監測,從而刺激液體分析設備市場的基準需求。
由於沙烏地阿拉伯和阿拉伯聯合大公國強制使用逆滲透海水淡化以確保市政供水,到2030年,中東和非洲的複合年成長率將達到6.3%。基於電解的綠色氫能計畫嚴重依賴海水淡化基礎設施,並需要在共用製程島上安裝耐高鹽度的感測器。取水口、鹽水出口和氫電解槽之間的管道距離較長,需要每公里進行分散式分析,以滿足ISO 22734的要求。與全球供應商的夥伴關係將加速服務中心的在地化,並加強區域售後服務網路。
在歐盟關於微量污染物的嚴格指令下,歐洲保持了穩步成長,棕地煉油廠和石化廠紛紛升級為在線光譜儀,以符合色度計的要求。北美地區在2029年截止日期之前增加了PFAS檢測設備的支出。拉丁美洲和非洲的公用事業面臨預算限制,但正在獲得世界銀行的洩漏檢測和水質監測資金,以支持其逐步現代化。
其他福利:
- Excel 格式的市場預測 (ME) 表
- 3個月的分析師支持
目錄
第1章 引言
- 研究假設和市場定義
- 調查範圍
第2章調查方法
第3章執行摘要
第4章 市場狀況
- 市場概況
- 市場促進因素
- 市政當局加速採用智慧感測器和工業物聯網進行即時水質管理
- 製藥業轉向需要線上電導率和 TOC 分析的一次性生物程序
- 北美和歐盟更嚴格的 PFAS 和微量污染物排放法規推動了先進分析設備的發展
- 中東地區綠色氫能和海水淡化計劃的擴張推動了對高鹽度pH/ORP的需求
- 東亞半導體產能快速擴張需要超純水監測
- 隨著食品業轉向連續加工,對衛生型 CIP 相容感測器的需求日益增加
- 市場限制
- 熟練技術人員短缺導致校準和維護的停機成本增加
- 光學溶解氧/濁度感測器的交叉敏感性和污垢問題限制了現場的可靠性
- 預算凍結推遲了開發中國家地方政府的更替週期
- 碎片化的通訊協定標準阻礙即插即用整合
- 產業生態系統分析
- 技術展望
- 波特五力分析
- 新進入者的威脅
- 買家/消費者的議價能力
- 供應商的議價能力
- 替代品的威脅
- 競爭對手之間的競爭強度
第5章市場規模及成長預測(金額)
- 按測量參數
- pH/ORP
- 電導率
- 溶氧(DO)
- 濁度
- 總有機碳/COD/BOD
- 氯和殘留氯
- 鈉和矽酸鹽
- 營養分析儀(硝酸鹽、磷酸鹽等)
- 依設備類型
- 線上/線上分析儀
- 可攜式/手持式儀表
- 桌上型/實驗室系統
- 按組件
- 分析單元
- 感測器/探頭
- 顯示器/控制器
- 試劑和耗材
- 軟體和整合服務
- 按最終用戶產業
- 水和污水處理
- 石油天然氣/石化
- 發電(熱能、核能、可再生能源)
- 飲食
- 製藥和生物技術
- 化學
- 紙漿和造紙
- 半導體和電子
- 金屬和採礦
- 其他終端使用者產業(海洋、農業、學術等)
- 按地區
- 北美洲
- 美國
- 加拿大
- 墨西哥
- 歐洲
- 德國
- 英國
- 法國
- 北歐的
- 其他歐洲國家
- 南美洲
- 巴西
- 南美洲其他地區
- 亞太地區
- 中國
- 日本
- 印度
- 東南亞
- 其他亞太地區
- 中東和非洲
- 中東
- 波灣合作理事會成員國
- 土耳其
- 其他中東地區
- 非洲
- 南非
- 其他非洲國家
- 北美洲
第6章 競爭態勢
- 市場集中度
- 策略舉措
- 市佔率分析
- 公司簡介
- Endress+Hauser Group
- Emerson Electric Co.
- Yokogawa Electric Corporation
- ABB Ltd.
- Hach Company(Danaher)
- Schneider Electric SE
- Honeywell International Inc.
- Mettler-Toledo International Inc.
- Teledyne Technologies Inc.
- Thermo Fisher Scientific Inc.
- Xylem Inc.
- Georg Fischer(GF)Piping Systems
- KROHNE Messtechnik GmbH
- Hanna Instruments Inc.
- Burkert Fluid Control Systems
- Horiba Ltd.
- Swan Analytical Instruments AG
- Electro-Chemical Devices Inc.
- Analytical Systems Keco Inc.
- Sensorex(Ametek)
第7章 市場機會與未來展望
The liquid analytical instrument market size is valued at USD 467.4 million in 2025 and is forecast to reach USD 603.1 million by 2030, reflecting a 5.23% CAGR during the period.
Rising compliance pressure on municipal utilities, rapid industrial automation, and a pivot toward smart sensor platforms anchor steady growth across core applications. Semiconductor fabrication, single-use bioprocessing, and green hydrogen projects demand ever-tighter water quality specifications, accelerating orders for inline pH, conductivity, and total organic carbon (TOC) analyzers. Vendors are embedding artificial intelligence into probes and controllers so that utilities can shift from scheduled checks to predictive maintenance, trimming operating expenses while meeting stricter discharge rules. Asia-Pacific leads equipment uptake on the back of aggressive capacity additions, while Middle East megaprojects for desalination and electrolysis expand the addressable base for high-salinity instruments.
Global Liquid Analytical Instrument Market Trends and Insights
Accelerating adoption of smart sensors and IIoT for real-time water quality control in municipal utilities
Utilities are replacing periodic grab sampling with continuous sensor networks that send encrypted data streams to cloud dashboards. Cincinnati's Metropolitan Sewer District raised wet-weather collection capacity by 20% and cut treatment costs by 90% after integrating pH, conductivity, and dissolved oxygen probes with an IIoT platform. Real-time alerts let operators divert flows before overflows occur, which lowers regulatory fines and insurance claims. Ruggedized instruments with built-in wireless radios therefore post stronger replacement demand than cabled legacy devices. The surge in smart sewer funding across the United States and western Europe sustains the liquid analytical instrument market as cities modernize century-old networks. Successful scale-up, however, hinges on open communication protocols that limit system integration bottlenecks.
Pharmaceutical shift to single-use bioprocessing demanding inline conductivity and TOC analytics
Continuous biologics manufacturing mandates instant confirmation that purified water meets United States Pharmacopeia and European Pharmacopoeia limits. Endress+Hauser's CA78/CA79 analyzers provide 50-second TOC readouts with UV oxidation and differential conductivity detection, giving operators immediate feedback to adjust feed streams. Inline sensors reduce downtime associated with off-line sampling while curbing cross-contamination risks in disposable bioreactors. As biopharmaceutical plants multiply across the United States, Ireland, and Singapore, suppliers of ultrapure water analyzers secure multi-year framework agreements. New probes use autodiagnostics and Smart-Verify functions to shorten validation cycles, which appeals to contract development and manufacturing organizations scaling multiple molecules. Growing regulatory scrutiny of gene and cell therapy production further boosts demand for high-accuracy, low-maintenance measurement platforms.
Skilled technician shortage inflating calibration and maintenance downtime costs
Complex analyzers require periodic multi-point calibration, diaphragm replacement, and verification against certified reference materials. Many utilities struggle to secure technicians, extending instrument downtime beyond two weeks and risking compliance breaches. A 2025 survey of 350 water operators identified workforce gaps as the top obstacle to digital transformation. Manufacturers now add self-cleaning junctions and remote-assist features, yet critical maintenance still demands on-site expertise. Downtime costs swell when batch processes halt because an inline probe fails qualification. Training programs and augmented-reality support tools only partly mitigate the constraint, leaving labor availability as a long-term drag on adoption for the liquid analytical instrument market.
Other drivers and restraints analyzed in the detailed report include:
- Tightening PFAS and micro-pollutant discharge limits
- Expansion of green hydrogen and desalination projects in Middle East
- Cross-sensitivity and fouling issues in optical DO/turbidity sensors
For complete list of drivers and restraints, kindly check the Table Of Contents.
Segment Analysis
pH and ORP analyzers held 37.8% of 2024 revenue, underlining their ubiquity across neutralization, disinfection, and chemical dosing processes. Demand persists because regulatory permits often specify discharge pH bands, and even minor deviations can corrode assets or impair biological treatment. The segment benefits from miniaturized glass-free sensors that withstand high-purity water used in microelectronics and pharmaceutical utilities. Growth moderates as most facilities already own pH loops, yet replacement cycles remain dependable given electrode aging.
Total organic carbon, chemical oxygen demand, and biological oxygen demand analyzers record the fastest 5.7% CAGR to 2030 as regulators turn to organic-load metrics for catchment-wide pollution control. Inline UV-persulfate TOC systems now deliver 30-second responses, letting operators adjust nutrient removal aeration in real time. Adoption inside clean-rooms where ultrapure water costs run high aligns with zero-liquid-discharge targets. As a result, the liquid analytical instrument market size for TOC analyzers is projected to outpace legacy parameters through 2030 while challenging traditional batch grab testing for compliance audits.
Inline analyzers contributed 54.7% revenue in 2024 as continuous monitoring became integral to distributed control strategies. These systems stream digital signals over Ethernet-APL to supervisory platforms so operators can optimize chemical dosing every few seconds. Plants running around-the-clock favor inline devices because downtime for manual sampling threatens throughput. Redundant sensor designs with hot-swap cartridges reduce maintenance windows, advancing long-term reliability.
Portable meters deliver the highest 5.2% CAGR because environmental officers and contract service crews need fast verification readings across catchments. Handheld units now pair with smartphones, using near-infrared micro-spectrometers to assess color, turbidity, and nitrate with one cuvette. Multi-parameter probes shrink kit weight for field engineers, and Bluetooth data logging supports cloud reporting. Consequently, the liquid analytical instrument market responds with rugged IP67 housings, inductive charging, and universal USB-C firmware updates that make on-site firmware refresh practical even in remote areas
The Liquid Analytical Instrument Market Report is Segmented by Measurement Parameter (pH/ORP, Conductivity, Turbidity, and More), Instrument Form Factor (In-line/On-line Analyzers, Portable/Hand-held, and More), Component (Analyzer Unit, Sensor/Probe, Display/Controller, and More), End-User Industry (Water and Wastewater Treatment, Chemicals, and More), and Geography. The Market Forecasts are Provided in Terms of Value (USD).
Geography Analysis
Asia-Pacific retained 34.2% of 2024 revenue, with China, Taiwan, and South Korea installing ultrapure water plants to feed advanced semiconductor lines. The region adds multiple 300 mm fabs annually, each requiring thousands of pH, silica, and resistivity loops to guard wafer yields. Pharmaceutical clusters in Singapore and India replicate U.S. GMP practices, installing conductivity networks that verify purified water storage in real time. Government environmental crackdowns enforce continuous monitoring across textile and electroplating parks, adding to baseline demand in the liquid analytical instrument market.
Middle East and Africa posts a 6.3% CAGR through 2030 as Saudi Arabia and United Arab Emirates mandate reverse-osmosis desalination to secure municipal supply. Electrolysis-based green hydrogen initiatives piggyback on desalination infrastructure, requiring high-salinity-tolerant sensors in shared process islands. Long pipeline distances between intake, brine outfall, and hydrogen electrolyzers necessitate distributed analytics every kilometer to meet ISO 22734 requirements. Partnerships with global vendors accelerate localization of service centers, strengthening after-sales networks in the region.
Europe maintains steady growth amid strict Union directives on micro-pollutants, while brownfield refineries and petrochemical plants upgrade to inline spectroscopy for color-number compliance. North America boosts spend on PFAS detection instruments ahead of the 2029 deadline. Latin American and African utilities face budget constraints but receive World Bank funds earmarked for leak-detection and water quality monitoring, supporting gradual modernization.
- Endress+Hauser Group
- Emerson Electric Co.
- Yokogawa Electric Corporation
- ABB Ltd.
- Hach Company (Danaher)
- Schneider Electric SE
- Honeywell International Inc.
- Mettler-Toledo International Inc.
- Teledyne Technologies Inc.
- Thermo Fisher Scientific Inc.
- Xylem Inc.
- Georg Fischer (GF) Piping Systems
- KROHNE Messtechnik GmbH
- Hanna Instruments Inc.
- Burkert Fluid Control Systems
- Horiba Ltd.
- Swan Analytical Instruments AG
- Electro-Chemical Devices Inc.
- Analytical Systems Keco Inc.
- Sensorex (Ametek)
Additional Benefits:
- The market estimate (ME) sheet in Excel format
- 3 months of analyst support
TABLE OF CONTENTS
1 INTRODUCTION
- 1.1 Study Assumptions and Market Definition
- 1.2 Scope of the Study
2 RESEARCH METHODOLOGY
3 EXECUTIVE SUMMARY
4 MARKET LANDSCAPE
- 4.1 Market Overview
- 4.2 Market Drivers
- 4.2.1 Accelerating Adoption of Smart Sensors and IIoT for Real-Time Water Quality Control in Municipal Utilities
- 4.2.2 Pharmaceutical Shift to Single-Use Bioprocessing Demanding Inline Conductivity and TOC Analytics
- 4.2.3 Tightening PFAS and Micro-Pollutant Discharge Limits in North America and EU Driving Advanced Analyzers
- 4.2.4 Expansion of Green Hydrogen and Desalination Projects in Middle East Boosting High-Salinity pH/ORP Demand
- 4.2.5 Rapid Semiconductor capacity Additions in East Asia Requiring Ultrapure Water Monitoring
- 4.2.6 Food Industry's Move to Continuous Processing Elevating Need for Hygienic, CIP-Ready Sensors
- 4.3 Market Restraints
- 4.3.1 Skilled Technician Shortage Inflating Calibration and Maintenance Downtime Costs
- 4.3.2 Cross-Sensitivity and Fouling Issues in Optical DO/Turbidity Sensors Limiting Field Reliability
- 4.3.3 Budget Freezes in Municipal Utilities of Developing Nations Slowing Replacement Cycles
- 4.3.4 Fragmented Communication Protocol Standards Hindering Plug-and-Play Integration
- 4.4 Industry Ecosystem Analysis
- 4.5 Technological Outlook
- 4.6 Porter's Five Forces Analysis
- 4.6.1 Threat of New Entrants
- 4.6.2 Bargaining Power of Buyers/Consumers
- 4.6.3 Bargaining Power of Suppliers
- 4.6.4 Threat of Substitute Products
- 4.6.5 Intensity of Competitive Rivalry
5 MARKET SIZE AND GROWTH FORECASTS (VALUES)
- 5.1 By Measurement Parameter
- 5.1.1 pH/ORP
- 5.1.2 Conductivity
- 5.1.3 Dissolved Oxygen (DO)
- 5.1.4 Turbidity
- 5.1.5 Total Organic Carbon/COD/BOD
- 5.1.6 Chlorine and Residual Chlorine
- 5.1.7 Sodium and Silicate
- 5.1.8 Nutrient Analyzers (Nitrate, Phosphate, etc.)
- 5.2 By Instrument Form Factor
- 5.2.1 In-line/On-line Analyzers
- 5.2.2 Portable/Hand-held Meters
- 5.2.3 Benchtop/Laboratory Systems
- 5.3 By Component
- 5.3.1 Analyzer Unit
- 5.3.2 Sensor/Probe
- 5.3.3 Display/Controller
- 5.3.4 Reagents and Consumables
- 5.3.5 Software and Integration Services
- 5.4 By End-User Industry
- 5.4.1 Water and Wastewater Treatment
- 5.4.2 Oil and Gas/Petrochemical
- 5.4.3 Power Generation (Thermal, Nuclear, Renewables)
- 5.4.4 Food and Beverage
- 5.4.5 Pharmaceuticals and Biotechnology
- 5.4.6 Chemicals
- 5.4.7 Pulp and Paper
- 5.4.8 Semiconductor and Electronics
- 5.4.9 Metals and Mining
- 5.4.10 Other End-User Industries (Marine, Agriculture, Academic, etc.)
- 5.5 By Geography
- 5.5.1 North America
- 5.5.1.1 United States
- 5.5.1.2 Canada
- 5.5.1.3 Mexico
- 5.5.2 Europe
- 5.5.2.1 Germany
- 5.5.2.2 United Kingdom
- 5.5.2.3 France
- 5.5.2.4 Nordics
- 5.5.2.5 Rest of Europe
- 5.5.3 South America
- 5.5.3.1 Brazil
- 5.5.3.2 Rest of South America
- 5.5.4 Asia-Pacific
- 5.5.4.1 China
- 5.5.4.2 Japan
- 5.5.4.3 India
- 5.5.4.4 South-East Asia
- 5.5.4.5 Rest of Asia-Pacific
- 5.5.5 Middle East and Africa
- 5.5.5.1 Middle East
- 5.5.5.1.1 Gulf Cooperation Council Countries
- 5.5.5.1.2 Turkey
- 5.5.5.1.3 Rest of Middle East
- 5.5.5.2 Africa
- 5.5.5.2.1 South Africa
- 5.5.5.2.2 Rest of Africa
- 5.5.1 North America
6 COMPETITIVE LANDSCAPE
- 6.1 Market Concentration
- 6.2 Strategic Moves
- 6.3 Market Share Analysis
- 6.4 Company Profiles (includes Global level Overview, Market level overview, Core Segments, Financials as available, Strategic Information, Market Rank/Share for key companies, Products and Services, and Recent Developments)
- 6.4.1 Endress+Hauser Group
- 6.4.2 Emerson Electric Co.
- 6.4.3 Yokogawa Electric Corporation
- 6.4.4 ABB Ltd.
- 6.4.5 Hach Company (Danaher)
- 6.4.6 Schneider Electric SE
- 6.4.7 Honeywell International Inc.
- 6.4.8 Mettler-Toledo International Inc.
- 6.4.9 Teledyne Technologies Inc.
- 6.4.10 Thermo Fisher Scientific Inc.
- 6.4.11 Xylem Inc.
- 6.4.12 Georg Fischer (GF) Piping Systems
- 6.4.13 KROHNE Messtechnik GmbH
- 6.4.14 Hanna Instruments Inc.
- 6.4.15 Burkert Fluid Control Systems
- 6.4.16 Horiba Ltd.
- 6.4.17 Swan Analytical Instruments AG
- 6.4.18 Electro-Chemical Devices Inc.
- 6.4.19 Analytical Systems Keco Inc.
- 6.4.20 Sensorex (Ametek)
7 MARKET OPPORTUNITIES AND FUTURE OUTLOOK
- 7.1 White-space and Unmet-Need Assessment


