


 |
市場調查報告書
商品編碼
1846244
表面視覺與檢測設備:市場佔有率分析、產業趨勢與統計、成長預測(2025-2030)Surface Vision & Inspection Equipment - Market Share Analysis, Industry Trends & Statistics, Growth Forecasts (2025 - 2030) |
||||||
※ 本網頁內容可能與最新版本有所差異。詳細情況請與我們聯繫。
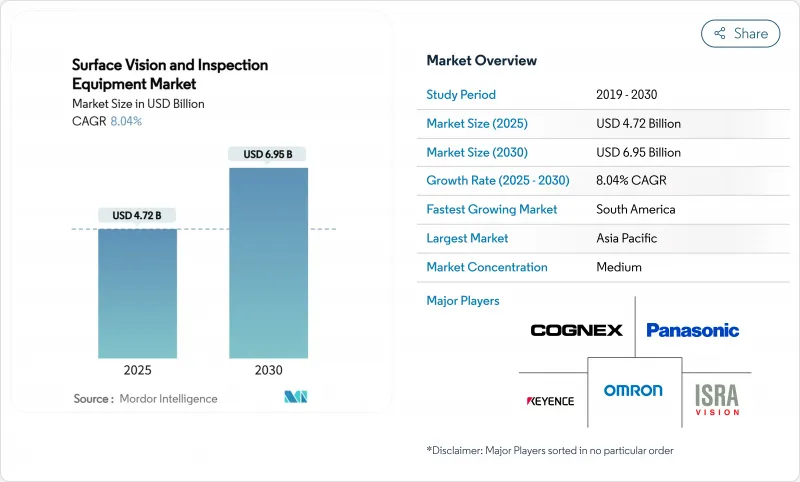
表面視覺和檢測設備市場規模預計將在 2025 年產生 47.2 億美元的收益,到 2030 年將擴大到 69.5 億美元,在此期間的複合年成長率為 8.04%。
高光譜影像、邊緣即時人工智慧 (AI) 推理以及按次付費服務模式的加速應用,正在拓展高級視覺品質保證的覆蓋範圍。汽車電池生產線、太陽能電池製造和半導體前端營運領域的需求激增,進一步強化了近零缺陷製造的戰略價值。同時,互聯工業 4.0 架構的擴展,迫使企業將網路安全和資料管治置於其視覺系統藍圖的核心。中端市場製造商對此做出了回應,他們青睞可攜式低成本掃描器和計量型的軟體訂閱,以縮短投資回報週期。
全球表面視覺與檢測設備市場趨勢與洞察
對低成本高產量製造的需求日益成長
基於影像處理的自動化技術使檢查週期從幾分鐘縮短到幾秒鐘,同時保持超過99%的檢測準確率。中國一些「暗」設施運作的電子工廠正在檢驗全天候生產模式,並實現15-20%的節能。因此,成本壓力增強了離散製造和流程製造領域表面視覺和檢測設備市場的需求。
精密工業對零缺陷品質的要求日益提高
先進的半導體節點、電動車電池組和植入式醫療設備要求不存在潛在缺陷。例如,Onto Innovation 報告稱,2025 年第一季與 DRAM 和環繞閘極結構相關的收益成長,凸顯了檢測與晶圓產量比率之間的關聯。電池製造商也同樣採用全天候視覺分析來預防下游安全故障。因此,表面視覺和檢測設備市場正在高可靠性領域吸引更多資本配置。
缺乏熟練的視覺技術人員和整合複雜性
韓國僅有19.5%的中小企業表示已採用智慧工廠。康耐視正努力應對人才缺口,將17%的銷售額投入研發,並透過低程式碼介面簡化設定。然而,人力資本限制仍將限制表面檢測和影像處理設備市場的短期擴張速度。
細分分析
到2024年,相機將佔總收入的44%,鞏固其作為偵測堆疊基本要素的地位。感測器解析度、影格速率和紫外線靈敏度的進步正在擴展半導體後端和Micro-LED生產線的缺陷檢測範圍。照明和光學元件與這些相機緊密整合,以揭示拋光金屬上的微小刮痕並檢測透明基板中的空隙。市場區隔的規模支撐著表面視覺和偵測設備市場,確保了互補光學元件和影像擷取卡的批量定價。
儘管基數較小,但預計到2030年,人工智慧視覺平台的複合年成長率將達到9.4%。將捲積卷積類神經網路直接嵌入智慧相機,可以消除先前基於主機的推理所需的延遲。康耐視於2024年4月宣布推出一款整合3D人工智慧設備,顯示供應商能夠將多個子系統整合到單一機殼中。這種融合將重塑成本結構,並擴大表面視覺和檢測設備市場中可實現的用例範圍。
由於條碼解碼、存在性檢查和標籤檢驗等任務幾乎不需要深度數據,2D視覺仍保持63%的市場佔有率。隨著生產線速度的提升,這些傳統任務將持續帶來持續成長的更新收益。同時,人工智慧驅動的配置正以8.8%的複合年成長率快速擴張,能夠有效應對光照變化、形狀變形以及干擾基於規則的腳本的重疊特徵。預計到2030年,受推理引擎成本下降的推動,人工智慧系統的表面視覺和偵測設備市場規模將達到21億美元。
雖然3D影像在變速箱殼體測量和航太緊固件深度檢驗等應用領域仍屬小眾領域,但結構光與神經推理的融合正開始模糊過去的界線。將2D、3D和頻譜內容整合到統一軟體套件中的供應商,可以在表面視覺和檢測設備產業中獲得交叉銷售溢價。
區域分析
受中國、日本和韓國大型電子和汽車供應鏈的推動,亞太地區預計在2024年將佔全球營收的39%。由於國家政策強化了對「智慧製造」的需求,中國機器視覺供應商在2024年的營收成長了30%以上。韓國每10,000人擁有1,012台機器人,顯示該地區對整合智慧光學技術的自動化硬體的需求龐大。
歐洲和北美市場需求持續強勁,尤其是在航太、半導體前端和受監管的醫療設備領域,證明了其高昂的定價是合理的。受電氣化和印刷電子計劃激增的推動,預計到2030年,北美表面視覺和檢測設備市場規模將接近18億美元。製造商也重視與提供優質服務的供應商的接近性,以避免整合的複雜性。
南美洲是成長最快的地區,複合年成長率達8.4%,這得益於巴西的現代化進程以及阿根廷的汽車和農業設備出口。智利和巴西的電池和太陽能投資為有遠見的供應商提供了新的著陸點。儘管中東和非洲仍是新興市場,但沙烏地阿拉伯和阿拉伯聯合大公國不斷成長的藥品產量正在為未來的應用奠定基礎。
其他福利:
- Excel 格式的市場預測 (ME) 表
- 3個月的分析師支持
目錄
第1章 引言
- 研究假設和市場定義
- 調查範圍
第2章調查方法
第3章執行摘要
第4章 市場狀況
- 市場概況
- 市場促進因素
- 對低成本高產量製造的需求日益成長
- 精密工業對零缺陷品質的要求日益提高
- 採用工業 4.0 和智慧工廠自動化
- 高光譜影像在地下缺陷檢測的應用
- 付費偵測服務模式,降低中小企業資金投入門檻
- ESG主導的強制性檢查,以減少電池和太陽能電池生產線的廢棄物
- 市場限制
- 缺乏熟練的影像處理工程師和整合複雜性
- 高解析度 3D 系統的初始成本高
- 實驗室連網中的網路安全風險
- 產品組合的快速變化超出了演算法更新周期
- 價值/供應鏈分析
- 監管狀況
- 技術展望
- 五力分析
- 新進入者的威脅
- 買方的議價能力
- 供應商的議價能力
- 替代品的威脅
- 競爭對手之間的競爭強度
第5章市場規模及成長預測
- 按組件
- 相機
- 照明設備
- 光學設備
- 影像擷取器和處理器
- 軟體
- 其他組件
- 依系統類型
- 2D視覺系統
- 3D視覺系統
- 人工智慧視覺系統
- 依部署方式
- 線上/線上檢查
- 離線偵測
- 可攜式/手持式系統
- 按應用產業
- 車
- 電氣和電子
- 半導體和 PCB
- 醫療和醫藥產品
- 食品、飲料及包裝
- 金屬和紙張
- 郵政和物流
- 其他行業
- 按地區
- 北美洲
- 美國
- 加拿大
- 墨西哥
- 南美洲
- 巴西
- 阿根廷
- 南美洲其他地區
- 歐洲
- 英國
- 德國
- 法國
- 義大利
- 西班牙
- 其他歐洲國家
- 亞太地區
- 中國
- 日本
- 印度
- 韓國
- ASEAN
- 澳洲
- 紐西蘭
- 其他亞太地區
- 中東和非洲
- 中東
- GCC
- 土耳其
- 以色列
- 其他中東地區
- 非洲
- 南非
- 奈及利亞
- 埃及
- 其他非洲國家
- 北美洲
第6章 競爭態勢
- 市場集中度
- 策略舉措
- 市佔率分析
- 公司簡介
- Omron Corporation
- Cognex Corporation
- Keyence Corporation
- Isra Vision AG
- Teledyne DALSA
- Panasonic Corporation
- AMETEK Surface Vision
- Basler AG
- Stemmer Imaging AG
- Matrox Imaging Ltd.
- Edmund Optics Inc.
- Sick AG
- Sony Semiconductor Solutions
- Datalogic SpA
- Shenzhen Sipotek Technology Co., Ltd.
- Daitron Inc.
- Opto Engineering Srl
- FlexFilm Ltd.
- Comvis AG
- Omnitron Sensors
第7章 市場機會與未來展望
The surface vision and inspection equipment market size recorded USD 4.72 billion in revenue in 2025 and is forecast to advance to USD 6.95 billion by 2030, reflecting an 8.04% CAGR over the period.
Accelerating adoption of hyperspectral imaging, real-time artificial intelligence (AI) inference at the edge, and pay-per-inspection service models are widening access to advanced visual quality assurance. Demand spikes in automotive battery lines, solar cell production, and semiconductor front-end fabrication reinforce the strategic value of near-zero-defect manufacturing. In tandem, the escalation of connected Industry 4.0 architectures is prompting corporations to place cybersecurity and data governance at the center of vision-system roadmaps. Mid-sized manufacturers are responding by favoring portable, low-capex scanners and pay-as-you-use software subscriptions that shorten investment payback cycles.
Global Surface Vision & Inspection Equipment Market Trends and Insights
Increasing need for higher manufacturing throughput at lower cost
Vision-enabled automation is enabling processors to compress inspection cycles from minutes to seconds while sustaining >=99% detection accuracy, as evidenced by cutting-tool systems running four-second cycles assemblymag.com. Electronics factories operating as "dark" facilities in China validate the 24/7 production model and capture energy savings of 15-20%. Cost-down pressures therefore reinforce the case for the surface vision and inspection equipment market across discrete and process manufacturing.
Rising demand for zero-defect quality in precision industries
Advanced semiconductor nodes, electric-vehicle battery packs, and implantable medical devices tolerate no latent defects. For example, Onto Innovation reported Q1 2025 revenue growth tied to DRAM and gate-all-around geometries, underscoring inspection's link to wafer yield. Battery cell producers are similarly adopting round-the-clock visual analytics to prevent downstream safety failures. Consequently, the surface vision and inspection equipment market captures rising capital allocations in high-reliability segments.
Scarcity of skilled vision engineers and integration complexity
Only 19.5% of South Korean SMEs report smart-factory uptake, citing limited technical capability as the top hurdle. Cognex is countering the talent gap by channeling 17% of revenue into R&D to simplify setup through low-code interfaces. Yet the human-capital constraint continues to temper the near-term expansion rate of the surface vision and inspection equipment market.
Other drivers and restraints analyzed in the detailed report include:
- Adoption of Industry 4.0 and smart-factory automation
- Emergence of hyperspectral imaging for sub-surface defect detection
- High upfront cost of high-resolution 3D systems
For complete list of drivers and restraints, kindly check the Table Of Contents.
Segment Analysis
Cameras represented 44% of 2024 revenue, cementing their status as the foundational element of any inspection stack. Progress in sensor resolution, frame rate, and ultraviolet sensitivity is expanding the attainable defect envelope in semiconductor back-end and micro-LED lines. Lighting and optics integrate tightly with those cameras to expose fine scratches on polished metals and detect voids in transparent substrates. The segment's scale anchors the surface vision and inspection equipment market and secures volume pricing on complementary optics and frame grabbers.
AI-enabled vision platforms, while a smaller base, are forecast to post a 9.4% CAGR to 2030. Embedding convolutional neural networks directly into smart cameras reduces latencies that previously mandated host-based inference. Cognex's April 2024 launch of an integrated 3D-with-AI device illustrates how suppliers now collapse multiple sub-systems into a single housing. This convergence is set to reshape the cost stack and expand addressable use cases across the surface vision and inspection equipment market.
2D vision keeps a 63% foothold thanks to barcode decoding, presence checks, and label verification that rarely require depth data. These legacy tasks continue to secure incremental refresh revenue as line speeds accelerate. At the same time, AI-enabled configurations are scaling quickly at an 8.8% CAGR, delivering robustness to variable lighting, shape deformation, and overlapping features that confound rule-based scripts. The surface vision and inspection equipment market size for AI-enabled systems is projected to reach USD 2.1 billion by 2030, supported by declining inference-engine costs.
3D imaging remains a niche for applications like gearbox housing measurement or aerospace fastener depth validation, but the blend of structured light and neural inference is starting to blur historical boundaries. Suppliers that merge 2D, 3D, and spectral content within unified software suites stand to capture cross-selling premiums in the surface vision and inspection equipment industry.
The Surface Vision and Inspection Equipment Market Report is Segmented by Component (Camera, Lighting Equipment, and More), System Type (2D Vision Systems, 3D Vision Systems, AI-Enabled Vision Systems), Deployment Mode (In-line/On-line Inspection, Off-Line Inspection, and More), Application Industry (Automotive, Electrical and Electronics, and More), and by Geography. The Market Forecasts are Provided in Terms of Value (USD).
Geography Analysis
Asia Pacific captured 39% of global revenue in 2024, powered by large-scale electronics and auto supply chains in China, Japan, and South Korea. Chinese machine-vision vendors benefited from >=30% sales growth in 2024 as state policies reinforced "smart manufacturing" imperatives. South Korea's robot density of 1,012 units per 10,000 workers illustrates the region's appetite for automation hardware that embeds intelligent optics.
Europe and North America retain robust demand lines anchored in aerospace, semiconductor front-end, and regulated medical-device sectors that justify premium pricing. The surface vision and inspection equipment market size for North America is forecast to approach USD 1.8 billion by 2030 as electrification and printed-electronics projects proliferate. Manufacturers also value proximity to high-service vendors to navigate integration complexity.
South America is the fastest-growing territory with an 8.4% CAGR, underpinned by Brazil's modernization agenda and Argentina's push into automotive and agricultural-equipment exports. Battery and solar investments in Chile and Brazil offer fresh landing zones for vision suppliers. Although Middle East & Africa remains an emerging prospect, rising pharmaceutical production in Saudi Arabia and UAE is laying foundations for future uptake.
- Omron Corporation
- Cognex Corporation
- Keyence Corporation
- Isra Vision AG
- Teledyne DALSA
- Panasonic Corporation
- AMETEK Surface Vision
- Basler AG
- Stemmer Imaging AG
- Matrox Imaging Ltd.
- Edmund Optics Inc.
- Sick AG
- Sony Semiconductor Solutions
- Datalogic S.p.A.
- Shenzhen Sipotek Technology Co., Ltd.
- Daitron Inc.
- Opto Engineering Srl
- FlexFilm Ltd.
- Comvis AG
- Omnitron Sensors
Additional Benefits:
- The market estimate (ME) sheet in Excel format
- 3 months of analyst support
TABLE OF CONTENTS
1 INTRODUCTION
- 1.1 Study Assumptions and Market Definition
- 1.2 Scope of the Study
2 RESEARCH METHODOLOGY
3 EXECUTIVE SUMMARY
4 MARKET LANDSCAPE
- 4.1 Market Overview
- 4.2 Market Drivers
- 4.2.1 Increasing need for higher manufacturing throughput at lower cost
- 4.2.2 Rising demand for zero-defect quality in precision industries
- 4.2.3 Adoption of Industry 4.0 and smart-factory automation
- 4.2.4 Emergence of hyperspectral imaging for sub-surface defect detection
- 4.2.5 Pay-per-inspection service models lowering SME capex barriers
- 4.2.6 ESG-driven mandatory inspection in battery and solar lines to cut waste
- 4.3 Market Restraints
- 4.3.1 Scarcity of skilled vision engineers and integration complexity
- 4.3.2 High upfront cost of high-resolution 3D systems
- 4.3.3 Cyber-security risks in connected inspection networks
- 4.3.4 Rapid product-mix changes outpacing algorithm update cycles
- 4.4 Value / Supply-Chain Analysis
- 4.5 Regulatory Landscape
- 4.6 Technological Outlook
- 4.7 Porter's Five Forces
- 4.7.1 Threat of New Entrants
- 4.7.2 Bargaining Power of Buyers
- 4.7.3 Bargaining Power of Suppliers
- 4.7.4 Threat of Substitutes
- 4.7.5 Intensity of Competitive Rivalry
5 MARKET SIZE AND GROWTH FORECASTS (VALUE)
- 5.1 By Component
- 5.1.1 Camera
- 5.1.2 Lighting Equipment
- 5.1.3 Optics
- 5.1.4 Frame Grabbers and Processors
- 5.1.5 Software
- 5.1.6 Other Components
- 5.2 By System Type
- 5.2.1 2D Vision Systems
- 5.2.2 3D Vision Systems
- 5.2.3 AI-enabled Vision Systems
- 5.3 By Deployment Mode
- 5.3.1 In-line / On-line Inspection
- 5.3.2 Off-line Inspection
- 5.3.3 Portable / Hand-held Systems
- 5.4 By Application Industry
- 5.4.1 Automotive
- 5.4.2 Electrical and Electronics
- 5.4.3 Semiconductor and PCB
- 5.4.4 Medical and Pharmaceuticals
- 5.4.5 Food and Beverage and Packaging
- 5.4.6 Metals and Paper
- 5.4.7 Postal and Logistics
- 5.4.8 Other Industries
- 5.5 By Geography
- 5.5.1 North America
- 5.5.1.1 United States
- 5.5.1.2 Canada
- 5.5.1.3 Mexico
- 5.5.2 South America
- 5.5.2.1 Brazil
- 5.5.2.2 Argentina
- 5.5.2.3 Rest of South America
- 5.5.3 Europe
- 5.5.3.1 United Kingdom
- 5.5.3.2 Germany
- 5.5.3.3 France
- 5.5.3.4 Italy
- 5.5.3.5 Spain
- 5.5.3.6 Rest of Europe
- 5.5.4 Asia Pacific
- 5.5.4.1 China
- 5.5.4.2 Japan
- 5.5.4.3 India
- 5.5.4.4 South Korea
- 5.5.4.5 ASEAN
- 5.5.4.6 Australia
- 5.5.4.7 New Zealand
- 5.5.4.8 Rest of Asia Pacific
- 5.5.5 Middle East and Africa
- 5.5.5.1 Middle East
- 5.5.5.1.1 GCC
- 5.5.5.1.2 Turkey
- 5.5.5.1.3 Israel
- 5.5.5.1.4 Rest of Middle East
- 5.5.5.2 Africa
- 5.5.5.2.1 South Africa
- 5.5.5.2.2 Nigeria
- 5.5.5.2.3 Egypt
- 5.5.5.2.4 Rest of Africa
- 5.5.1 North America
6 COMPETITIVE LANDSCAPE
- 6.1 Market Concentration
- 6.2 Strategic Moves
- 6.3 Market Share Analysis
- 6.4 Company Profiles {(includes Global level Overview, Market level overview, Core Segments, Financials as available, Strategic Information, Market Rank/Share for key companies, Products and Services, and Recent Developments)}
- 6.4.1 Omron Corporation
- 6.4.2 Cognex Corporation
- 6.4.3 Keyence Corporation
- 6.4.4 Isra Vision AG
- 6.4.5 Teledyne DALSA
- 6.4.6 Panasonic Corporation
- 6.4.7 AMETEK Surface Vision
- 6.4.8 Basler AG
- 6.4.9 Stemmer Imaging AG
- 6.4.10 Matrox Imaging Ltd.
- 6.4.11 Edmund Optics Inc.
- 6.4.12 Sick AG
- 6.4.13 Sony Semiconductor Solutions
- 6.4.14 Datalogic S.p.A.
- 6.4.15 Shenzhen Sipotek Technology Co., Ltd.
- 6.4.16 Daitron Inc.
- 6.4.17 Opto Engineering Srl
- 6.4.18 FlexFilm Ltd.
- 6.4.19 Comvis AG
- 6.4.20 Omnitron Sensors
7 MARKET OPPORTUNITIES AND FUTURE OUTLOOK
- 7.1 White-space and Unmet-Need Assessment
 人工智慧驅動的工業機器人市場預測至2034年——全球產品、機器人類型、部署模式、技術、最終用戶和區域分析
 AI驅動的工業機器人市場機會、成長要素、產業趨勢分析以及2026年至2035年的預測。
 2026年全球表面目視檢測市場報告
 表面視覺與檢測市場 - 全球產業規模、佔有率、趨勢、機會及預測(按組件、應用、地區和競爭格局分類,2021-2031年)
 表面視覺與檢測市場(按組件、技術、類型、應用、最終用途產業和部署模式)—全球預測 2025-20322032 年人工智慧工業視覺市場預測:按組件、部署模式、技術、應用、最終用戶和地區進行的全球分析標籤檢測機市場預測(至 2032 年):按產品類型、組件、機器類型、技術、應用、最終用戶和地區進行的全球分析
 表面視覺檢測市場:按組件、類型、應用和地區分類
 表面視覺和檢測市場規模、佔有率、趨勢分析報告:按組件、按表麵類型、按系統、按應用、按地區、細分市場預測,2024-2030 年