


 |
市場調查報告書
商品編碼
1846242
立體顯示器:市場佔有率分析、產業趨勢、統計數據和成長預測(2025-2030 年)Volumetric Display - Market Share Analysis, Industry Trends & Statistics, Growth Forecasts (2025 - 2030) |
||||||
※ 本網頁內容可能與最新版本有所差異。詳細情況請與我們聯繫。
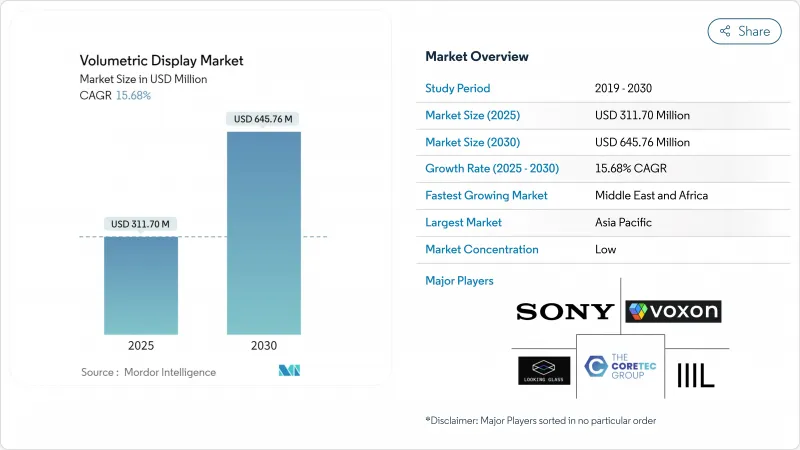
預計到 2025 年,體顯示市場規模將達到 3.117 億美元,到 2030 年將達到 6.4576 億美元。
在預測期內,這項技術將從實驗性創新發展成為手術室、指揮中心和先進駕駛座的核心視覺化平台。對3D解剖成像的強勁需求、國防領域對無玻璃情境察覺主機採購的增加,以及汽車產業向全擋風玻璃3D集群的轉變,都推動了這一成長。同時,投影機每流明成本持續下降,即時全像處理器降低了延遲,從而以更低的整體擁有成本實現優質的用戶體驗。軟體創新的不斷湧現,正將競爭優勢從光學硬體轉移到掌控渲染引擎和內容生態系統的公司,重塑體顯示市場的差異化格局。
全球體顯示市場趨勢與洞察
微創手術中3D解剖可視化技術的應用
為了克服平面顯示器的空間限制,醫院正在整合立體顯示技術。例如,RealView Imaging公司的Holoscope-i系統能夠投射互動式3D/4D全像圖,外科醫生可以從任何角度進行觀察,從而減輕眼部疲勞並縮短手術時間。一項多機構研究發現,在61%的病例中,手術團隊更傾向於使用全像規劃而非2D影像,這推動了臨床應用的發展。隨著螢光導航手術與全像輸出技術的融合,相關平台將從簡單的檢視器發展成為整合式手術主機。採購模式表明,到2027年,這類設備將成為複雜手術室的標配,從而推動立體顯示市場硬體的年度需求成長。
國防部門對無玻璃360°情境察覺系統的需求
中東各國軍隊正在指揮中心部署立體顯示器,使多名軍官無需佩戴頭戴式設備即可共用同一3D戰場視圖。美國研究實驗室資助的測試證實,與2D拼接地圖相比,立體顯示器能夠更快地識別目標並加快任務規劃速度。目前情報、監視與偵察(ISR)升級的預算撥款顯示,採購工作將穩定持續到2026年,並計畫推出無玻璃3D桌面。由於原始設備製造商(OEM)將對產品進行軍用規格機殼認證以及防沙防塵認證,因此國防訂單為立體顯示器市場提供了穩定的收益來源。
亞高清原生解析度的持續存在限制了臨床診斷
目前大多數體素顯示系統的像素密度都達不到臨床醫師進行微血管和病理檢查的要求。橫向解析度低的問題在大型協作工作台上尤為突出,迫使放射科醫師必須回到CT工作站取得更精細的影像。雖然對色彩感知全像最佳化技術的研究正在縮小這一差距,但診斷級原型仍停留在實驗室階段。在像素間距達到數位顯微鏡的閾值之前,體素顯示市場在醫療收益方面將更依賴手術規劃而非診斷。
細分市場分析
掃描式體顯示架構,憑藉成熟的生產工具和經過現場驗證的可靠性,將在 2024 年佔據 67.6% 的體顯示市場佔有率。旋轉式餘輝視覺技術可在緊湊的體積內呈現明亮的影像,使其成為醫療和國防主機的理想選擇,因為全像雷射激發圖形消除了移動部件並縮短了維護週期。
近期彩色靜態體立方體的演示表明,其具有卓越的環境耐受性,吸引了那些無法承受機械振動的實驗室。隨著全像材料規模的擴大,靜態體系統可望削弱掃頻體系統的主導地位,推動靜態體顯示市場到2030年規模超過1.9億美元。同時掌握這兩種技術的供應商將能夠有效應對未來客戶偏好的波動。
光學硬體(投影機和雷射引擎)仍佔 37.1% 的市場佔有率,因為亮度和色域仍然取決於光子效率。然而,渲染軟體和高頻寬GPU 的複合年成長率 (CAGR) 正以 16.6% 的速度成長,隨著越來越多的消費者需要即時 4K 全像圖,它們已超越光學硬體。隨著配備全像圖專用指令集的處理器進入商用電路板,預計 2025 年至 2030 年間,體顯示計算子系統的市場規模將成長近一倍。
為了應對這項挑戰,以硬體為中心的公司與遊戲引擎供應商合作,捆綁開發工具包(SDK),而純軟體公司則向投影機製造商授權智慧財產權模組(IP)。這種轉變重塑了能夠在不引入視覺偽影的情況下壓縮干涉圖案的演算法的價值獲取方式,也為立體顯示產業的下一輪競爭奠定了基礎。
區域分析
到2024年,亞太地區將佔據立體顯示市場33.2%的佔有率,其中日本、中國和韓國的大型企業集團將引領這一市場。日本決定在其新版紙幣上嵌入全像肖像,標誌著全像顯示技術正被主流市場接受,並激勵當地的光學元件供應商。韓國通訊業者已進行了5G全像通話的現場演示,吸引了許多企業先導計畫。該地區密集的供應商網路有助於縮短前置作業時間並加快產品更新換代速度。
北美位居第二,其中以美國手術機器人製造商和一家將容積式主機整合到其C2套件中的國防研究機構最為突出。聯邦政府對先進製造測試平台的資助,提高了中小企業接觸這項技術的機會,拓寬了中端市場前景。加拿大安大略省和不列顛哥倫比亞省的醫療技術叢集正在增設臨床檢驗基地,進一步提升了該地區的信譽。
歐洲持續關注汽車整合。一家德國一級供應商與一位光學專家合作,設計了符合聯合國歐洲經濟委員會(UN ECE)眩光規定的擋風玻璃安裝式全像圖。歐盟雷射安全標準的製定可能會延緩該技術的普及,但最終會提升標準質量,一旦獲得認證,將增強其出口吸引力。
到2030年,中東和非洲地區的複合年成長率將達到17.2%,位居榜首。各國國防部正為聯合行動中心採購無玻璃的360度全景工作台。海灣地區的主權財富基金正在資助配備全像投影設施的娛樂中心,這將進一步提升部隊的客流量。拉丁美洲也積極採用這項技術,巴西的大學正在工業設計課程中試行建造立體實驗室。
其他福利:
- Excel格式的市場預測(ME)表
- 3個月的分析師支持
目錄
第1章 引言
- 研究假設和市場定義
- 調查範圍
第2章調查方法
第3章執行摘要
第4章 市場情勢
- 市場概覽
- 市場促進因素
- 3D解剖視覺化技術在微創手術的應用(北美、歐洲)
- 中東地區對無玻璃360°情境察覺系統的國防需求
- 汽車抬頭顯示器演變為車用3D儀錶群(德國、日本)
- 媒體和娛樂業轉向基於位置的全像景點(亞洲)
- 固體雷射降低了每流明投影成本(全球)
- 電信 5G 部署可實現即時立體遠端遠距臨場系統(美國、韓國)
- 市場限制
- 亞高清原生解析度的持續存在限制了臨床診斷
- 與同類中小企業的 3D 視覺化工具相比,其購置成本較高。
- 內容創作生態系統的限制阻礙了其大規模應用。
- 高強度雷射光源安全法規(歐盟)
- 產業生態系分析
- 監理與技術展望
- 波特五力分析
- 新進入者的威脅
- 買方的議價能力
- 供應商的議價能力
- 替代品的威脅
- 競爭對手之間的競爭
第5章 市場規模與成長預測(金額)
- 按顯示類型
- 掃描體積顯示
- 靜態音量顯示
- 按組件
- 投影雷射模組
- 顯示面板和光學元件
- 渲染軟體和GPU硬體
- 全像材料
- 其他組件
- 按顯示尺寸
- 可視角度小於 360°(立方體尺寸小於 24 英吋)
- 360°桌面(24吋至40吋立方體)
- 大尺寸(40吋或更大)
- 透過使用
- 醫學影像與手術規劃
- 遠距臨場系統和視訊會議
- 教育和培訓模擬
- 廣告數位電子看板
- 娛樂和遊戲
- 工程與設計視覺化
- 國防與安全指揮中心
- 其他用途
- 按最終用戶產業
- 醫療保健提供者
- 汽車和運輸
- 媒體、體育和娛樂場所
- 工業/製造業
- 航太/國防
- 學術和研究機構
- 其他
- 按地區
- 北美洲
- 美國
- 加拿大
- 墨西哥
- 歐洲
- 德國
- 英國
- 法國
- 北歐的
- 其他歐洲國家
- 南美洲
- 巴西
- 其他南美
- 亞太地區
- 中國
- 日本
- 印度
- 東南亞
- 其他亞太地區
- 中東和非洲
- 中東
- 波灣合作理事會成員國
- 土耳其
- 其他中東地區
- 非洲
- 南非
- 其他非洲國家
- 北美洲
第6章 競爭格局
- 策略舉措
- 市佔率分析
- 公司簡介
- Voxon Photonics
- Looking Glass Factory Inc.
- Coretec Group Inc.
- Seekway Technology Ltd.
- Burton Inc.
- Leia Inc.
- LightSpace Technologies
- HoloTech Studios
- SeeReal Technologies
- Sony Corporation
- Magic Leap Inc.
- Google LLC
- Microsoft Corporation
- RealView Imaging Ltd.
- WayRay AG
- zSpace Inc.
- Deepsky Corporation
- Alioscopy
- Holoxica Ltd.
- The 3rd Dimension Technologies
- VividQ
- ForwardX Robotics
- Shenzhen Giant Real Technology
第7章 市場機會與未來展望
The volumetric display market size is valued at USD 311.7 million in 2025 and is on course to expand to USD 645.76 million by 2030, reflecting a sturdy 15.68% CAGR.
Over the forecast period the technology shifts from experimental novelty toward a core visualization platform across operating rooms, command centers, and advanced cockpits. Strong demand for 3D anatomical imaging, growing defense procurement of glass-free situational-awareness consoles, and automotive moves toward full-windshield 3D clusters underpin this climb. In parallel, projector costs per lumen keep falling while real-time hologram processors shorten latency, making premium user experiences available at lower total cost of ownership. Intensifying software innovation is tilting competitive advantage toward firms that control rendering engines and content ecosystems rather than only optical hardware, rewriting the basis of differentiation inside the volumetric display market.
Global Volumetric Display Market Trends and Insights
Adoption of 3D Anatomical Visualization in Minimally Invasive Surgeries
Hospitals integrate volumetric displays to overcome the spatial constraints of flat monitors. Systems such as RealView Imaging's Holoscope-i project interactive 3D/4D holograms that surgeons can inspect from any angle, lowering eye strain and shortening procedure times. Multi-institutional studies show surgical teams preferred holographic planning in 61% of cases over 2D images, reinforcing clinical momentum. As fluorescence-guided surgery merges with holographic output, the platform evolves from simple viewer to integrated surgical console. Purchasing patterns indicate the equipment will be standard in complex surgery suites by 2027, lifting annual hardware demand inside the volumetric display market.
Defense Demand for Glass-Free 360° Situational-Awareness Systems
Armed forces in the Middle East deploy volumetric displays inside command posts to let multiple officers share the same 3D battlespace view without headsets. Tests funded by the US Air Force Research Lab confirm quicker target recognition and mission-planning cycles compared with tiled 2D maps. Budget allocations for ISR upgrades now earmark glass-free 3D tables, signaling steady procurement through 2026. As OEMs certify mil-spec housing and sand-dust tolerance, defense orders form a reliable revenue stream for the volumetric display market.
Persistent Sub-HD Native Resolution Limiting Clinical Diagnostics
Most current volumetric systems fall below the pixel density clinicians need for micro-vascular inspection or pathology review. Lower lateral resolution becomes more pronounced on large collaborative tables, forcing radiologists to revert to CT workstations for fine detail. Research into color-aware holographic optimization is closing the gap, yet diagnostic-grade prototypes remain in labs. Until pixel pitches match digital microscopy thresholds, the volumetric display market must rely on surgical planning rather than diagnostics for medical revenue.
Other drivers and restraints analyzed in the detailed report include:
- Automotive HUD Evolution Toward In-Cabin 3D Instrument Clusters
- Media and Entertainment Pivot to Location-Based Holographic Attractions
- High Acquisition Cost versus Competing 3D Visualization Tools in SMEs
For complete list of drivers and restraints, kindly check the Table Of Contents.
Segment Analysis
Swept-volume architectures capture 67.6% volumetric display market share in 2024 thanks to mature production tooling and field-proven reliability. Rotational persistence of vision enables bright images inside compact footprints, ideal for medical and defense consoles. Static-volume units, though smaller today, post the strongest 17.7% CAGR as holographic-laser-excited graphics eliminate moving parts, slashing maintenance cycles.
Recent demonstrations of color static-volume cubes show excellent environmental robustness, enticing laboratories that cannot tolerate mechanical vibration. As holographic materials scale, static-volume systems are forecast to erode swept-volume dominance, pushing the volumetric display market size for static architectures past USD 190 million by 2030. Vendors that master both paths hedge against future customer preference swings.
Optical hardware-projectors and laser engines-retains 37.1% share because brightness and color gamut still depend on photon efficiency. Yet rendering software and high-bandwidth GPUs accelerate at 16.6% CAGR, outpacing optics as buyers demand real-time 4K holograms. The volumetric display market size for compute subsystems is forecast to nearly double between 2025 and 2030 as processors with hologram-specific instruction sets reach commercial boards.
In response, hardware-centric firms form alliances with game-engine vendors to bundle SDKs, while pure-play software houses license IP blocks to projector manufacturers. The shift recasts value capture toward algorithms that compress interference patterns without visual artifacts, setting the next competitive battleground inside the volumetric display industry.
The Volumetric Display Market Report is Segmented by Display Type (Swept Volume Display, and Static Volume Display), Component (Projectors and Laser Modules, and More), Display Size (Below 360° Viewing Volume, and More), Application (Medical Imaging and Surgical Planning, and More), End-User Industry (Automotive and Transportation, and More), and Geography. The Market Forecasts are Provided in Terms of Value (USD).
Geography Analysis
Asia-Pacific led with 33.2% share of the volumetric display market in 2024, anchored by Japanese, Chinese, and South-Korean conglomerates that combine semiconductor strength with large domestic entertainment spend. Japan's decision to embed holographic portraits in new banknotes signals mainstream acceptance, catalyzing local optics suppliers. South-Korea's telcos demonstrated live 5G hologram calls, drawing enterprise pilot projects. The region's dense supplier base keeps lead-times short, accelerating refresh cycles.
North America ranks second, propelled by US surgical-robot makers and defense labs that integrate volumetric consoles into C2 suites. Federal funding for advanced manufacturing testbeds exposes SMEs to the technology, expanding mid-market prospects. Canada's med-tech clusters in Ontario and British Columbia add clinical validation sites, reinforcing regional credibility.
Europe remains focused on automotive integration. German Tier-1s partner with optics specialists to engineer windshield-embedded holograms compliant with UN ECE glare rules. EU laser-safety norms slow deployments but ultimately raise baseline quality, building export appeal once certificates are issued.
The Middle East and Africa register the highest 17.2% CAGR through 2030 as defense ministries procure glass-free 360° tables for joint-ops centers. Sovereign funds in the Gulf finance entertainment complexes that feature holographic attractions, further boosting unit flow. Latin America shows nascent adoption, with Brazil's universities piloting volumetric labs for industrial design curricula, seeding future demand across the continent.
- Voxon Photonics
- Looking Glass Factory Inc.
- Coretec Group Inc.
- Seekway Technology Ltd.
- Burton Inc.
- Leia Inc.
- LightSpace Technologies
- HoloTech Studios
- SeeReal Technologies
- Sony Corporation
- Magic Leap Inc.
- Google LLC
- Microsoft Corporation
- RealView Imaging Ltd.
- WayRay AG
- zSpace Inc.
- Deepsky Corporation
- Alioscopy
- Holoxica Ltd.
- The 3rd Dimension Technologies
- VividQ
- ForwardX Robotics
- Shenzhen Giant Real Technology
Additional Benefits:
- The market estimate (ME) sheet in Excel format
- 3 months of analyst support
TABLE OF CONTENTS
1 INTRODUCTION
- 1.1 Study Assumptions and Market Definition
- 1.2 Scope of the Study
2 RESEARCH METHODOLOGY
3 EXECUTIVE SUMMARY
4 MARKET LANDSCAPE
- 4.1 Market Overview
- 4.2 Market Drivers
- 4.2.1 Adoption of 3D Anatomical Visualization in Minimally Invasive Surgeries (North America and Europe)
- 4.2.2 Defense Demand for Glass-Free 360° Situational Awareness Systems (Middle East)
- 4.2.3 Automotive HUD Evolution Toward In-Cabin 3D Instrument Clusters (Germany, Japan)
- 4.2.4 Media and Entertainment Pivot to Location-Based Holographic Attractions (Asia)
- 4.2.5 Falling Projection Cost per Lumen via Solid-State Lasers (Global)
- 4.2.6 Telecom 5G Rollout Enabling Real-time Volumetric Telepresence (US, South Korea)
- 4.3 Market Restraints
- 4.3.1 Persistent Sub-HD Native Resolution Limiting Clinical Diagnostics
- 4.3.2 High Acquisition Cost vs. Competing 3D Visualization Tools in SMEs
- 4.3.3 Limited Content Authoring Ecosystem Hindering Mass Adoption
- 4.3.4 Safety Regulations around High-Intensity Laser Sources (EU)
- 4.4 Industry Ecosystem Analysis
- 4.5 Regulatory and Technological Outlook
- 4.6 Porter's Five Forces Analysis
- 4.6.1 Threat of New Entrants
- 4.6.2 Bargaining Power of Buyers
- 4.6.3 Bargaining Power of Suppliers
- 4.6.4 Threat of Substitutes
- 4.6.5 Competitive Rivalry
5 MARKET SIZE AND GROWTH FORECASTS (VALUES)
- 5.1 By Display Type
- 5.1.1 Swept Volume Display
- 5.1.2 Static Volume Display
- 5.2 By Component
- 5.2.1 Projectors and Laser Modules
- 5.2.2 Display Panels and Optical Elements
- 5.2.3 Rendering Software and GPU Hardware
- 5.2.4 Holographic Materials
- 5.2.5 Other Components
- 5.3 By Display Size
- 5.3.1 Below 360° Viewing Volume (Sub 24 inch cube)
- 5.3.2 360° Table-Top (24 inch-40 inch cube)
- 5.3.3 Large-Format (Above 40 inch cube)
- 5.4 By Application
- 5.4.1 Medical Imaging and Surgical Planning
- 5.4.2 Telepresence and Videoconferencing
- 5.4.3 Education and Training Simulations
- 5.4.4 Advertising and Digital Signage
- 5.4.5 Entertainment and Gaming
- 5.4.6 Engineering and Design Visualization
- 5.4.7 Defence and Security Command Centers
- 5.4.8 Other Applications
- 5.5 By End-user Industry
- 5.5.1 Healthcare Providers
- 5.5.2 Automotive and Transportation
- 5.5.3 Media, Sports and Entertainment Venues
- 5.5.4 Industrial and Manufacturing
- 5.5.5 Aerospace and Defence
- 5.5.6 Academic and Research Institutes
- 5.5.7 Others
- 5.6 By Geography
- 5.6.1 North America
- 5.6.1.1 United States
- 5.6.1.2 Canada
- 5.6.1.3 Mexico
- 5.6.2 Europe
- 5.6.2.1 Germany
- 5.6.2.2 United Kingdom
- 5.6.2.3 France
- 5.6.2.4 Nordics
- 5.6.2.5 Rest of Europe
- 5.6.3 South America
- 5.6.3.1 Brazil
- 5.6.3.2 Rest of South America
- 5.6.4 Asia-Pacific
- 5.6.4.1 China
- 5.6.4.2 Japan
- 5.6.4.3 India
- 5.6.4.4 South-East Asia
- 5.6.4.5 Rest of Asia-Pacific
- 5.6.5 Middle East and Africa
- 5.6.5.1 Middle East
- 5.6.5.1.1 Gulf Cooperation Council Countries
- 5.6.5.1.2 Turkey
- 5.6.5.1.3 Rest of Middle East
- 5.6.5.2 Africa
- 5.6.5.2.1 South Africa
- 5.6.5.2.2 Rest of Africa
- 5.6.1 North America
6 COMPETITIVE LANDSCAPE
- 6.1 Strategic Moves
- 6.2 Market Share Analysis
- 6.3 Company Profiles {(includes Global level Overview, Market level overview, Core Segments, Financials as available, Strategic Information, Market Rank/Share for key companies, Products and Services, and Recent Developments)}
- 6.3.1 Voxon Photonics
- 6.3.2 Looking Glass Factory Inc.
- 6.3.3 Coretec Group Inc.
- 6.3.4 Seekway Technology Ltd.
- 6.3.5 Burton Inc.
- 6.3.6 Leia Inc.
- 6.3.7 LightSpace Technologies
- 6.3.8 HoloTech Studios
- 6.3.9 SeeReal Technologies
- 6.3.10 Sony Corporation
- 6.3.11 Magic Leap Inc.
- 6.3.12 Google LLC
- 6.3.13 Microsoft Corporation
- 6.3.14 RealView Imaging Ltd.
- 6.3.15 WayRay AG
- 6.3.16 zSpace Inc.
- 6.3.17 Deepsky Corporation
- 6.3.18 Alioscopy
- 6.3.19 Holoxica Ltd.
- 6.3.20 The 3rd Dimension Technologies
- 6.3.21 VividQ
- 6.3.22 ForwardX Robotics
- 6.3.23 Shenzhen Giant Real Technology
7 MARKET OPPORTUNITIES AND FUTURE OUTLOOK
- 7.1 White-space and Unmet-need Assessment
 3D顯示器市場:2026-2032年全球市場預測(依顯示技術、部署方式、最終用戶和應用程式分類)
 2026年全球體顯示市場報告
 2026-2034年全球體顯示市場規模、佔有率、趨勢和成長分析報告
 全球體顯示市場:依類型、技術、應用和地區劃分-市場規模、產業動態、機會分析及預測(2026-2035)
 體顯示市場 - 全球產業規模、佔有率、趨勢、機會、預測:按類型、技術、最終用戶、地區和競爭格局分類,2021-2031年
 體顯示器市場規模、佔有率及成長分析(依顯示器類型、最終用途及地區分類)-2026-2033年產業預測全球 3D 顯示器市場規模:依顯示器類型、技術、應用、地區、預測
 2032 年立體顯示器市場預測:按顯示器類型、組件、尺寸、技術、應用和地區進行的全球分析立體顯示器市場報告:2030 年趨勢、預測與競爭分析
 全球立體顯示器市場 2024-2031