


 |
市場調查報告書
商品編碼
1846240
雲端發現:市場佔有率分析、產業趨勢、統計數據和成長預測(2025-2030 年)Cloud Discovery - Market Share Analysis, Industry Trends & Statistics, Growth Forecasts (2025 - 2030) |
||||||
※ 本網頁內容可能與最新版本有所差異。詳細情況請與我們聯繫。
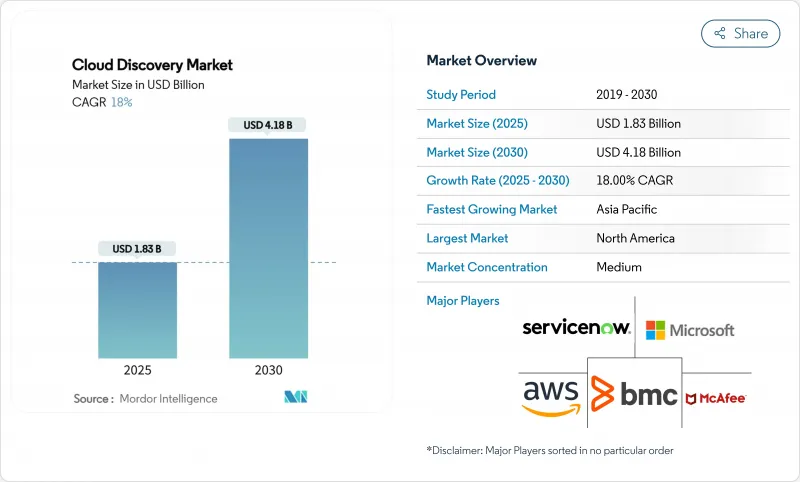
預計雲端發現市場在 2025 年將達到 18.3 億美元,在 2030 年將達到 41.8 億美元,在市場估計和預測期(2025-2030 年)內以 18% 的複合年成長率成長。
多重雲端的快速普及、日益嚴格的零信任要求以及永續性報告法規,使得持續的資產視覺性成為董事會層面的優先事項,並重塑了企業安全架構。隨著企業從一次性審核轉向即時監控,將無代理發現、自動分類和支援 FinOps 的分析功能融入其平台的供應商正在贏得市場佔有率。北美的需求繼續受到聯邦合規框架的驅動,而亞太地區的主權雲端舉措正在加速區域應用。小型組織的預算限制以及分段網路中持續存在的憑證存取障礙正在減緩整體成長,但人工智慧主導的自動化領域的持續創新將繼續擴大整體可尋址需求。
全球雲端發現市場趨勢與洞察
全球 2000 強企業多重雲端採用率不斷擴大
企業目前平均在 3.2 個公共雲端上運行生產工作負載。因此,發現引擎需要近乎即時地與多個提供者 API、容器編配層和服務網格進行互動。主權雲強制要求亞洲的早期採用者同時經營國內和國際雲,從而推動了對平台無關發現的需求。 ServiceNow 與主要超大規模雲端供應商的整合展示了工作流程自動化和發現如何整合,以縮短混合雲平台的回應時間。如果沒有這些功能,企業報告的發現延遲時間將長達 72 小時,暴露出監管機構日益嚴厲的安全和合規盲點。
對即時配置可見性的需求日益成長,以增強網路彈性
由於絕大多數雲端漏洞是由於配置錯誤造成的,監管機構正在強制要求持續監控。美國國防部的雲端條款已更新,要求承包商追蹤資料位置並立即修正任何偏差。面臨健康保險流通與責任法案 (HIPAA) 和勒索軟體威脅的醫療保健提供者正在主導即時發現和資料安全態勢管理的投資。整合了人工智慧主導的威脅分析和發現技術的供應商報告稱,平均偵測時間縮短了 30% 或更多。製造商報告稱,透過將持續資產發現技術融入工業IoT環境,整體設施效率實現了兩位數的提升。
高度分段的網路中持續存在的憑證存取障礙
零信任設計刻意限制了橫向移動,要求發現引擎分別對每個微分段進行身份驗證。醫療保健提供者在隔離受保護的健康資訊時也面臨類似的挑戰。雖然無代理方法可以減少一些摩擦,但它們在深度方面仍然舉步維艱,並且必須在廣度和粒度之間做出權衡。企業估計,光是憑證管理任務就消耗了其 40-60% 的發現預算。
細分分析
到2024年,專業服務將佔據雲端發現市場的68%,這凸顯了企業對專業架構師的依賴,他們將發現引擎與複雜的身份、網路和工作流程層整合在一起。專業服務通常涵蓋需要深厚供應商專業知識的任務,例如多重雲端API映射、策略調整和CMDB建置。然而,隨著企業意識到發現必須持續進行而非專案,預計到2030年,託管服務將以24%的複合年成長率加速成長。
託管服務的成長標誌著支出結構性轉變,從企劃為基礎的部署轉向由持續視覺性支援的訂閱模式。 ServiceNow 的託管發現訂閱服務將為其 2024 年第四季度 28.66 億美元的經常性收益做出重要貢獻,彰顯了基於運作的合約的吸引力。採用「始終在線發現」服務的製造業客戶報告稱,由於異常檢測速度加快,營運效率提高了 10-15%。這種轉變也使供應商受益,因為自動分類可以降低交付成本,並提高缺乏專職雲端安全人員的組織的採用率。
雲端發現市場按服務類型(專業、主機)、最終用戶垂直領域(IT 和通訊、BFSI、零售和消費品、工業製造、醫療保健和其他垂直領域)和地區進行細分。
區域分析
到2024年,北美將佔總收入的38%,這得益於企業雲的早期採用、成熟的超大規模生態系統以及聯邦政府要求在政府合約中加入發現條款的規定。金融機構、國防承包商和醫療保健網路構成了最大的買家叢集,而加拿大公司也擴大採用託管發現機制來應對跨境資料流動。由於現有的IT服務管理供應商將發現機制整合到更廣泛的工作流程套件中,競爭依然激烈,但財富1000強企業的市場飽和引發了人們對成長放緩的擔憂。
由於主權雲端政策和在地化法律迫使企業在區域層級盤點資產,預計亞太地區在2025年至2030年間的複合年成長率將達到22%,成為全球成長最快的地區。超過三分之一的亞太地區政府計劃在2026年前採用主權雲,要求企業詳細記錄其工作負荷的位置。到2024年,該地區的資料中心容量將超過12,000兆瓦,另有14,000兆瓦正在建置中,這將進一步提升對混合雲端可視性的需求。金融服務和國防等產業正在引領混合雲端的採用,而數位原民企業的崛起正在加速託管服務的採用。
歐洲是一個龐大的合規主導市場,GDPR 和企業永續性報告指令使資料發現對於資料保護和排放核算都至關重要。企業正在利用發現引擎來映射資料流並分配範圍 3 碳因子,從而實現透明的 ESG 揭露。德國、法國和北歐地區的採用最為普遍,這些地區的節能雲區域與嚴格的資料居住規則交叉。成長率低於亞太地區,但由於與監管認證相關的高轉換成本,供應商可受益於更長的合約期限。南美和中東及非洲仍處於起步階段,但前景光明。通訊業者主導的雲端部署和公共部門數位化計畫正在為未來的需求奠定基礎,前提是它們的定價能夠適應有限的 IT 預算。
其他福利:
- Excel 格式的市場預測 (ME) 表
- 3個月的分析師支持
目錄
第1章 引言
- 研究假設和市場定義
- 調查範圍
第2章調查方法
第3章執行摘要
第4章 市場狀況
- 市場概況
- 市場促進因素
- 全球 2000 強企業多重雲端採用率不斷擴大
- 增強網路彈性對即時配置可視性的需求日益成長
- FinOps 和 ITOM 的融合為成本管理堆疊添加了一個發現模組。
- 透過使用 GenAI* 進行自動分類來降低 CMDB 維護成本。
- 美國聯邦零信任合約中的強制性資產發現條款*。
- 永續性報告條例 (CSRD、SEC) 要求提供雲端資產清單*。
- 市場限制
- 高度隔離的網路中憑證存取的持續障礙
- 中小企業在發現許可和員工方面的預算緊張
- 主權雲限制限制了您所在區域以外的發現*。
- 儘管工具不斷升級,影子 IT 的成長速度仍然超過了發現覆蓋率*。
- 價值/供應鏈分析
- 監管狀況
- 技術展望
- 五力分析
- 新進入者的威脅
- 買方的議價能力
- 供應商的議價能力
- 替代品的威脅
- 競爭對手之間的競爭
- 市場促進因素
第5章市場規模及成長預測
- 按服務
- 專業的
- 託管
- 按最終用戶產業
- 資訊科技/通訊
- BFSI
- 零售和消費品
- 製造業
- 衛生保健
- 其他行業
- 按地區
- 北美洲
- 南美洲
- 歐洲
- APAC
- 中東和非洲
第6章 競爭態勢
- 市場集中度
- 策略舉措
- 市佔率分析
- 公司簡介
- ServiceNow Inc.
- BMC Software Inc.
- Microsoft Corp.
- Amazon Web Services Inc.
- Cisco Systems Inc.
- IBM Corp.
- Broadcom Inc.(Symantec)
- McAfee LLC
- Palo Alto Networks Inc.
- Fortinet Inc.
- Splunk Inc.
- Dynatrace Inc.
- New Relic Inc.
- vArmour Networks Inc.
- Tenable Inc.
- Qualys Inc.
- Rapid7 Inc.
- Wiz Inc.
- Lacework Inc.
- Orca Security Ltd.
第7章 市場機會與未來展望
The Cloud Discovery Market size is estimated at USD 1.83 billion in 2025, and is expected to reach USD 4.18 billion by 2030, at a CAGR of 18% during the forecast period (2025-2030).
Rapid multi-cloud adoption, stricter zero-trust mandates, and sustainability reporting rules are reshaping enterprise security architecture by making continuous asset visibility a board-level priority. Vendors that embed agentless discovery, automated classification, and FinOps-ready analytics into their platforms are gaining share as enterprises shift from one-time audits to real-time monitoring. North American demand remains anchored in federal compliance frameworks, while APAC's sovereign-cloud initiatives are accelerating regional uptake. Budget constraints at smaller organizations and persistent credential-access hurdles in segmented networks moderate overall growth, but sustained innovation in AI-driven automation continues to expand total addressable demand.
Global Cloud Discovery Market Trends and Insights
Growing Multi-Cloud Adoption Among Global 2000 Enterprises
Organizations now run production workloads across an average of 3.2 public clouds, a strategy that boosts resilience but fragments visibility. Discovery engines must therefore interface with multiple provider APIs, container orchestration layers, and service meshes in near real time. Early adopters in Asia are compelled to run parallel domestic and international cloud estates because of sovereign-cloud directives, reinforcing demand for platform-agnostic discovery. ServiceNow's integration with a leading hyperscaler illustrates how workflow automation and discovery are converging to shorten response times across hybrid estates.Without these capabilities, enterprises report discovery lags of up to 72 hours, exposing security and compliance blind spots that regulators increasingly penalize.
Rising Need for Real-Time Configuration Visibility to Harden Cyber-Resilience
Misconfigurations continue to account for the overwhelming majority of cloud breaches, prompting regulators to enforce continuous monitoring requirements. The U.S. Department of Defense's updated cloud clause obliges contractors to track data location and remediate drift instantly. Healthcare providers, subject to HIPAA and ransomware threats, are leading investments in real-time discovery tied to data-security-posture management. Vendors integrating discovery with AI-driven threat analytics claim mean-time-to-detect reductions of more than 30%. Manufacturing firms report double-digit improvements in overall equipment effectiveness after embedding continuous asset discovery within industrial IoT environments.
Persistent Credential-Access Hurdles in Highly Segmented Networks
Zero-trust designs intentionally restrict lateral movement, requiring discovery engines to authenticate separately in every micro-segment. Financial services institutions must also segregate business-unit data by jurisdiction, multiplying credential overhead.Healthcare providers face comparable challenges when isolating protected health information. Agentless approaches alleviate some friction yet still struggle with depth, forcing trade-offs between breadth and granularity. Enterprises estimate that 40-60% of discovery budgets are consumed by credential management tasks alone.
Other drivers and restraints analyzed in the detailed report include:
- Convergence of FinOps and ITOM Driving Discovery Modules Into Cost-Governance Stacks
- GenAI-Powered Auto-Classification Reducing CMDB Maintenance Cost
- SMB Budget Squeeze for Discovery Licences and Staff
For complete list of drivers and restraints, kindly check the Table Of Contents.
Segment Analysis
Professional services captured 68% of the cloud discovery market in 2024, underscoring enterprises' reliance on specialized architects to integrate discovery engines with complex identity, network, and workflow layers. Engagement scopes typically cover multi-cloud API mapping, policy tuning, and CMDB population-all tasks requiring deep vendor expertise. Managed services, however, are forecast to accelerate at a 24% CAGR through 2030 as enterprises recognize that discovery must run continuously rather than ad-hoc.
Growth in managed offerings signals a structural shift in spending from project-based deployments to subscription models anchored in ongoing visibility. ServiceNow's managed discovery subscriptions contributed materially to its USD 2,866 million Q4 2024 recurring revenue, illustrating the appeal of outcome-based contracts. Manufacturing clients adopting always-on discovery have reported 10-15% boosts in operational effectiveness through faster anomaly detection. The shift also benefits vendors, as automated classification reduces marginal delivery costs and widens adoption among organizations lacking full-time cloud-security staff.
The Cloud Discovery Market is Segmented by Service (Professional, Managed), End-User Industry (IT and Telecommunication, BFSI, Retail and Consumer Goods, Industrial Manufacturing, Healthcare and Other Industries), and Geography
Geography Analysis
North America held 38% of 2024 revenue thanks to early enterprise cloud adoption, a mature hyperscale ecosystem, and federal mandates that embed discovery clauses in government contracts. Financial institutions, defense contractors, and healthcare networks represent the largest buyer clusters, while Canadian firms increasingly adopt managed discovery to address cross-border data movement. Competition remains intense as established IT-service-management vendors integrate discovery into broader workflow suites, yet market saturation among Fortune 1000 firms tempers incremental growth.
APAC is projected to post a 22% CAGR from 2025-2030, the fastest worldwide, driven by sovereign-cloud policies and localization laws that force companies to inventory assets at the regional level. More than one-third of Asia-Pacific governments plan to deploy sovereign clouds by 2026, compelling enterprises to maintain granular records of workload residency. Data-center capacity in the region topped 12,000 MW in 2024, and a further 14,000 MW is under construction, magnifying the need for hybrid-cloud visibility. Industries such as financial services and sovereign defense lead adoption, while emerging digital-native enterprises accelerate managed-service uptake.
Europe represents a sizable, compliance-driven market where GDPR and the Corporate Sustainability Reporting Directive make discovery essential for both data protection and emissions accounting. Enterprises leverage discovery engines to map data flows and assign Scope 3 carbon factors, enabling transparent ESG disclosures. Uptake is most pronounced in Germany, France, and the Nordics, where energy-efficient cloud zones intersect stringent data-residency rules. While growth rates are lower than in APAC, vendors benefit from long contract tenures due to high switching costs tied to regulatory certification. South America and the Middle East & Africa remain nascent but promising; telco-led cloud rollouts and public-sector digitization programs are laying the groundwork for future demand, provided pricing aligns with constrained IT budgets.
- ServiceNow Inc.
- BMC Software Inc.
- Microsoft Corp.
- Amazon Web Services Inc.
- Cisco Systems Inc.
- IBM Corp.
- Broadcom Inc. (Symantec)
- McAfee LLC
- Palo Alto Networks Inc.
- Fortinet Inc.
- Splunk Inc.
- Dynatrace Inc.
- New Relic Inc.
- vArmour Networks Inc.
- Tenable Inc.
- Qualys Inc.
- Rapid7 Inc.
- Wiz Inc.
- Lacework Inc.
- Orca Security Ltd.
Additional Benefits:
- The market estimate (ME) sheet in Excel format
- 3 months of analyst support
TABLE OF CONTENTS
1 INTRODUCTION
- 1.1 Study Assumptions and Market Definition
- 1.2 Scope of the Study
2 RESEARCH METHODOLOGY
3 EXECUTIVE SUMMARY
4 MARKET LANDSCAPE
- 4.1 Market Overview
- 4.1.1 Market Drivers
- 4.1.1.1 Growing multi-cloud adoption among Global 2000 enterprises
- 4.1.1.2 Rising need for real-time configuration visibility to harden cyber-resilience
- 4.1.1.3 Convergence of FinOps and ITOM driving discovery modules into cost-governance stacks
- 4.1.1.4 GenAI-powered auto-classification reducing CMDB maintenance cost*
- 4.1.1.5 Mandatory asset-discovery clauses in new U.S. Federal Zero-Trust contracts*
- 4.1.1.6 Sustainability reporting rules (CSRD, SEC) demanding cloud-asset inventories*
- 4.1.2 Market Restraints
- 4.1.2.1 Persistent credential-access hurdles in highly segmented networks
- 4.1.2.2 SMB budget squeeze for discovery licences and staff
- 4.1.2.3 Sovereign-cloud restrictions limiting discovery scope outside region*
- 4.1.2.4 Shadow-IT growth outpacing discovery coverage despite tool upgrades*
- 4.1.3 Value/Supply-Chain Analysis
- 4.1.4 Regulatory Landscape
- 4.1.5 Technological Outlook
- 4.1.6 Porter's Five Forces
- 4.1.6.1 Threat of New Entrants
- 4.1.6.2 Bargaining Power of Buyers
- 4.1.6.3 Bargaining Power of Suppliers
- 4.1.6.4 Threat of Substitutes
- 4.1.6.5 Competitive Rivalry
- 4.1.1 Market Drivers
5 MARKET SIZE AND GROWTH FORECASTS (VALUE)
- 5.1 By Service
- 5.1.1 Professional
- 5.1.2 Managed
- 5.2 By End-user Industry
- 5.2.1 IT and Telecommunication
- 5.2.2 BFSI
- 5.2.3 Retail and Consumer Goods
- 5.2.4 Industrial Manufacturing
- 5.2.5 Healthcare
- 5.2.6 Other Industries
- 5.3 By Geography
- 5.3.1 North America
- 5.3.2 South America
- 5.3.3 Europe
- 5.3.4 APAC
- 5.3.5 Middle East and Africa
6 COMPETITIVE LANDSCAPE
- 6.1 Market Concentration
- 6.2 Strategic Moves
- 6.3 Market Share Analysis
- 6.4 Company Profiles (includes Global level Overview, Market level overview, Core Segments, Financials as available, Strategic Information, Market Rank/Share for key companies, Products and Services, and Recent Developments)
- 6.4.1 ServiceNow Inc.
- 6.4.2 BMC Software Inc.
- 6.4.3 Microsoft Corp.
- 6.4.4 Amazon Web Services Inc.
- 6.4.5 Cisco Systems Inc.
- 6.4.6 IBM Corp.
- 6.4.7 Broadcom Inc. (Symantec)
- 6.4.8 McAfee LLC
- 6.4.9 Palo Alto Networks Inc.
- 6.4.10 Fortinet Inc.
- 6.4.11 Splunk Inc.
- 6.4.12 Dynatrace Inc.
- 6.4.13 New Relic Inc.
- 6.4.14 vArmour Networks Inc.
- 6.4.15 Tenable Inc.
- 6.4.16 Qualys Inc.
- 6.4.17 Rapid7 Inc.
- 6.4.18 Wiz Inc.
- 6.4.19 Lacework Inc.
- 6.4.20 Orca Security Ltd.
7 MARKET OPPORTUNITIES AND FUTURE OUTLOOK
- 7.1 White-space and Unmet-need Assessment
 雲端發現市場:2025-2032 年全球預測(按服務模式、產業垂直領域、組織規模和部署模式分類)
 雲端發現市場分析與至2034年的預測:類型、產品、服務、技術、組件、應用程式、部署、最終用戶、解決方案和階段
 雲端發現市場 - 全球產業規模、佔有率、趨勢、機會和預測(按組件、按組織規模、按最終用途、按地區和競爭,2020-2030 年)
 全球雲端發現市場規模研究,按解決方案、服務、組織規模、垂直和區域預測 2022-2032雲端發現市場規模、佔有率、趨勢分析報告:按組件、公司規模、最終用途、地區、細分預測,2025-2030 年
 雲端發現市場規模、佔有率、成長分析,按組件、按組織規模、按行業、按地區 - 行業預測,2024-2031 年
 全球雲端發現市場,2024-2028全球多雲端發現市場 2024-2031