


 |
市場調查報告書
商品編碼
1844692
燃料電池商用車:市場佔有率分析、行業趨勢、統計數據和成長預測(2025-2030 年)Fuel Cell Commercial Vehicle - Market Share Analysis, Industry Trends & Statistics, Growth Forecasts (2025 - 2030) |
||||||
※ 本網頁內容可能與最新版本有所差異。詳細情況請與我們聯繫。
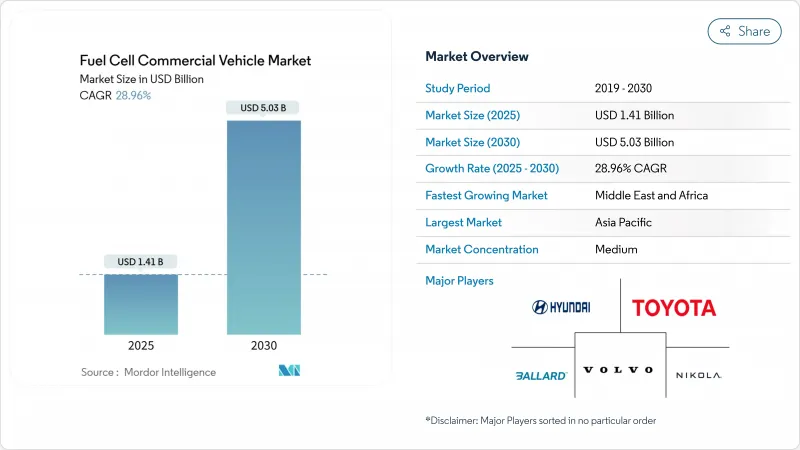
預計2025年燃料電池商用車市場規模將達14.1億美元,2030年將達50.3億美元,複合年成長率為28.96%。
嚴格的法規環境、快速下降的可再生氫氣成本以及不斷成長的企業淨零貨運承諾,正在推動銷售量逐年成長。技術進步推動燃料電池系統成本目標在2025年達到80美元/千瓦,幫助大型車隊突破400公里以上路線的總擁有成本門檻。以鹿特丹和洛杉磯為中心的區域氫能走廊正在消除早期的基礎設施問題,而港務局也正在設定零排放貨運的堅定目標。這些因素正在激勵原始設備製造商擴大生產規模,降低單位成本,並推出用於遠距物流和城市公車的商業模式。
全球燃料電池商用車市場趨勢與洞察
商用車排放法規嚴格
歐盟的「Fit-for-55」方案要求重型車輛的排放氣體到2040年減少90%,中期目標是到2030年減少45%,到2035年減少65%。為了控制交通運輸業的排放,修訂後的二氧化碳標準現在涵蓋了更廣泛的重型車輛(HDV)。修訂後的法規還將巴士、長途客車、拖車和商用卡車納入其中,這些車輛佔重型車輛銷售的90%以上。原始設備製造商正在加速其燃料電池項目,以滿足嚴格的標準,尤其是在電池容量和充電停止時間仍然具有挑戰性的遠距營運中。
北美城市公車零排放規定
加州創新的清潔交通法規要求交通業者到2040年過渡到100%零排放車隊。購買的車輛必須已達到25%的零排放水平,到2026年達到50%。 15億美元的聯邦補貼將在2024年增加約600輛公車,這意味著全尺寸燃料電池電動公車的部署量將比前一年增加55%。純電動車需要雙電池組,這會犧牲座位容量。業者也報告稱,不受溫度影響的加油方式簡化了寒冷北方地區的調度計畫。
燃料電池在重載循環中的耐久性問題
儘管近年來技術取得了進步,但重型應用的燃料電池系統仍存在嚴重的耐久性問題。重型卡車需要至少能運作25,000小時的系統。百萬英里燃料電池卡車聯盟的目標是到2030年將系統壽命提高到30,000小時。加州大學洛杉磯分校(UCLA)在2025年宣布的實驗室測試中,燃料電池系統將達到超過200,000小時的突破性水平,這緩解了人們對其壽命的擔憂,但商業規模的檢驗仍在進行中。這些技術尚未實現大規模商業化並整合到量產車中。
細分分析
2024年,公車佔據了燃料電池商用車市場佔有率的45.76%,因為交通運輸機構利用專門的資金框架來替換老化的柴油車隊。 Solaris佔據了歐洲燃料電池公車註冊量的65%,這反映了該OEM廠商對基於停車場營運的重視。橘郡交通管理局訂購的40輛FCEB等訂單證實了該細分市場的強勁成長勢頭。這一成長動能得益於可預測的路線和回車段加油、350巴壓縮氣體系統的適配以及簡化維修團隊日常工作的功能。將車輛和加油合約捆綁在一起的採購框架進一步提高了公共機構買家的預算確定性。
預計2025年至2030年,卡車的複合年成長率將達31.10%,超過公車,推動燃料電池商用車市場向貨運物流方向發展。尼古拉500英里TRE FCEV和現代XCIENT Class 8平台定位於樞紐到樞紐物流,充分利用20分鐘加氫時間和比純電動車更高的有效載荷餘量。企業貨運夥伴關係提供接管擔保,幫助銀行承保新的加氫站。穩定的綠色氫能供應預計將使400-600公里線路的總成本持平,從而實現北歐和中歐貨運走廊的全國性部署。
質子交換膜燃料電池 (PEMFC) 技術以其快速啟動和承受頻繁負載變化的能力而聞名,到 2024 年,將佔據燃料電池商用車市場的 81.25%。每堆鉑金負載持續下降,在滿足城市公車工作週期的同時縮小了成本差距。在加州進行的車隊測試表明,PEMFC 公車的使用壽命超過 20,000 小時,性能劣化低於 10%,增強了操作員對多班次運作的信心。
預計到2030年,固體氧化物燃料電池 (SOFC) 的複合年成長率將達到31.25%。其電效率接近60%,並且能夠承受低純度氫氣,支援遠距運輸和輔助電力整合場景。材料科學的進步已將工作溫度降低至700°C,從而實現更快的加熱速度和更小的溫度控管組件。減少對鉑族金屬的依賴預計將大幅降低電堆成本,一旦使用壽命達到3萬小時,SOFC有望廣泛應用。
區域分析
2024年,亞太地區將以41.62%的市場佔有率引領燃料電池商用車市場,這得益於中國每年12.5萬噸的綠色氫能產能和大規模的零件製造。電解槽生產的成本優勢和國產化,打造了涵蓋電堆、電力電子設備和儲槽的區域化價值鏈。日本和韓國憑藉長期的研發項目和早期的OEM生產線,鞏固了其區域主導地位。
歐洲正採取具有約束力的二氧化碳減排措施,力爭2030年將重型車輛排放減少45%,到2040年減少90%。截至2024年5月,加氫站數量已達187座,註冊的燃料電池公車數量同期增加了82%。像H2Accelerate這樣的跨國計劃旨在2030年建成150座加氫站,連接斯堪地那維亞半島和義大利北部。
北美正受益於聯邦獎勵和各州強制要求:加州的 ARCHES 中心獲得了 12 億美元的支持,目標是到 2045 年每天供應 45,000 噸氫氣。美國能源局希望在 2030 年 30% 的新中型和重型汽車銷售實現零排放,推動太平洋西北部、墨西哥灣沿岸和五大湖地區的卡車 OEM 試點車隊。
預計到2030年,中東和非洲地區的複合年成長率將達到29.05%,這得益於豐富的太陽能和風能資源以及現有的天然氣管道網路。沙烏地阿拉伯和阿拉伯聯合大公國正在建造連接港口和內陸物流中心的試點卡車走廊,旨在實現貨運業的脫碳,該產業的排放的四分之一。
其他福利:
- Excel 格式的市場預測 (ME) 表
- 3個月的分析師支持
目錄
第1章 引言
- 研究假設和市場定義
- 調查範圍
第2章調查方法
第3章執行摘要
第4章 市場狀況
- 市場概況
- 市場促進因素
- 商用車排放法規嚴格
- 北美城市公車零排放規定
- 中國利用可再生電解降低氫氣生產成本
- 淨零貨運企業聯盟加速OEM採購承諾
- 北歐400公里以上遠距卡車的TCO持平
- 以港口為中心的氫能走廊促進早期採用
- 市場限制
- 加氫站基礎建設成本高
- 新興市場綠氫能供應採用緩慢
- 對燃料電池在重度循環中的耐久性的擔憂
- 在短途運輸中與電動卡車競爭
- 價值/供應鏈分析
- 監管和技術展望
- 五力分析
- 供應商的議價能力
- 買家/消費者的議價能力
- 新進入者的威脅
- 替代品的威脅
- 競爭對手之間的競爭強度
第5章市場規模及成長預測
- 按車輛類型
- 公車
- 追蹤
- 貨車
- 其他車輛類型(皮卡車等)
- 依燃料電池類型
- 固體電解質燃料電池(PEMFC)
- 磷酸燃料電池(PAFC)
- 固體氧化物燃料電池(SOFC)
- 其他
- 按輸出範圍
- 小於100千瓦
- 100 kW-200 kW
- 200度或以上
- 按里程
- 少於400公里
- 400 km-600 km
- 超過600公里
- 按最終用戶
- 公共運輸
- 遠距貨運和物流
- 最後一哩配送
- 市政當局和公共產業
- 其他用途
- 按地區
- 北美洲
- 美國
- 加拿大
- 北美其他地區
- 歐洲
- 德國
- 英國
- 法國
- 義大利
- 其他歐洲國家
- 亞太地區
- 中國
- 印度
- 日本
- 韓國
- 其他亞太地區
- 南美洲
- 巴西
- 阿根廷
- 其他南美
- 中東和非洲
- 阿拉伯聯合大公國
- 南非
- 沙烏地阿拉伯
- 其他中東和非洲地區
- 北美洲
第6章 競爭態勢
- 市場集中度
- 策略舉措
- 市佔率分析
- 公司簡介
- Hyundai Motor Company
- Toyota Motor Corporation
- Ballard Power Systems
- Volvo Group(cellcentric JV)
- Nikola Corporation
- PACCAR Inc.
- Mercedes-Benz Group AG
- Honda Motor Co.
- SAIC Motor Corporation
- Foton Motor Group
- Tata Motors Limited
- Solaris Bus & Coach sp. z oo
- Plug Power Inc.
- Hyzon Motors Inc.
- Cummins Inc.
- Wrightbus Ltd.
- Zhejiang Geely Holding Group
- Dongfeng Motor Corporation
- Xiamen King Long Motor Group
- Gaussin SA
第7章 市場機會與未來展望
The hydrogen fuel cell commercial vehicle market is valued at USD 1.41 billion in 2025 and is projected to reach USD 5.03 billion by 2030, translating into a 28.96% CAGR.
A tight regulatory climate, the rapid fall in renewable-based hydrogen costs, and a widening corporate net-zero freight commitments push sales volumes higher yearly. Technology gains notably a fuel-cell system cost target of USD 80/kW by 2025, helping large fleets cross total-cost-of-ownership thresholds on routes over 400 km. Regional hydrogen corridors anchored around Rotterdam and Los Angeles remove early-stage infrastructure anxiety while port authorities set firm zero-emission freight targets. These forces encourage OEMs to scale production, lower per-unit costs, and launch commercial models for long-haul logistics, not just urban buses.
Global Fuel Cell Commercial Vehicle Market Trends and Insights
Stringent Emission Regulations for Commercial Vehicles
The EU "Fit-for-55" package requires a 90% emissions cut from heavy-duty vehicles by 2040, with interim targets of 45% by 2030 and 65% by 2035. To curb emissions from the transportation sector, revised CO2 standards now encompass a broader spectrum of heavy-duty vehicles (HDVs). The updated regulations now include buses, coaches, trailers, and vocational trucks, collectively accounting for over 90% of HDV sales. OEMs are accelerating fuel-cell programs to meet the tougher standards, particularly for long-haul operations where battery mass and charging downtime remain challenging.
Zero-Emission Mandates for Urban Bus Fleets in North America
California's Innovative Clean Transit Regulation compels transit operators to transition to 100% zero-emission fleets by 2040. Purchases must already be 25% zero-emission, reaching 50% by 2026. Federal grants of USD 1.5 billion in 2024 funded roughly 600 additional buses, and full-size fuel-cell electric bus deployments grew 55% year-over-year. Agencies prefer fuel-cell platforms for blocks above 250 km, requiring dual battery packs if executed with pure BEVs, compromising seating capacity. Operators also report that ambient-temperature-insensitive refuelling simplifies service planning in cold northern climates.
Fuel-Cell Durability Concerns in Heavy-Duty Cycles
Despite recent technological advances, fuel cell systems for heavy-duty applications still grapple with significant durability concerns. Heavy trucks require systems capable of at least 25,000 operating hours. The Million Mile Fuel Cell Truck Consortium targets 30,000 hours by 2030. UCLA's 2025 breakthrough of more than 200,000 hours in lab tests addresses lifetime anxiety but is still moving toward scaled commercial validation. These technologies have yet to be widely commercialized and integrated into production vehicles.
Other drivers and restraints analyzed in the detailed report include:
- Corporate Net-Zero Freight Alliances Accelerating OEM Purchase Commitments
- Port-Centric Hydrogen Corridors Spurring Early Adoption
- Competition from Battery-Electric Trucks in Short-Haul
For complete list of drivers and restraints, kindly check the Table Of Contents.
Segment Analysis
Buses held 45.76% of the hydrogen fuel cell commercial vehicle market share in 2024 as transit agencies tapped dedicated funding lines to replace aging diesel fleets. Solaris captured 65% of European fuel-cell bus registrations, reflecting OEM specialization in depot-based operations. Orders such as Orange County Transportation Authority's 40 FCEBs underscore the segment's traction. Momentum benefits from predictable routes and return-to-depot refueling, traits that fit 350-bar compressed-gas systems and simplify daily operations for maintenance teams. Procurement frameworks that bundle vehicles with fueling contracts further improve budget certainty for public-sector buyers.
Trucks are forecast to outpace buses with a 31.10% CAGR from 2025 to 2030, moving the hydrogen fuel cell commercial vehicle market toward freight logistics. Nikola's 500-mile TRE FCEV and Hyundai's XCIENT class-8 platform are positioned for hub-to-hub logistics, exploiting 20-minute refueling and higher payload headroom over BEVs. Corporate freight alliances provide offtake guarantees that help banks underwrite new refueling stations. As green hydrogen supply stabilizes, total-cost parity on 400-600 km lanes is expected to unlock nationwide rollouts across Nordic and Central European freight corridors.
PEMFC technology commanded 81.25% of the hydrogen fuel cell commercial vehicle market in 2024, valued for its rapid start-up and tolerance to frequent load changes. Platinum loading per stack continues to fall, closing cost gaps while meeting city-bus duty cycles. Fleet trials in California show PEMFC buses exceeding 20,000 hours with degradation under 10%, reinforcing operator confidence in multi-shift service.
Solid Oxide Fuel Cell (SOFC) is expected to grow at a 31.25% CAGR through 2030. Electrical efficiency up to 60%, combined with tolerance for lower-purity hydrogen, supports long-haul and auxiliary-power integration scenarios. Material science progress has trimmed operating temperatures to 700 °C, allowing quicker heat-up and smaller thermal-management components. Reduced reliance on platinum-group metals promises lower stack costs at scale, setting the stage for expanded adoption once durability reaches 30,000 hours.
The Fuel Cell Commercial Vehicle Market Report is Segmented by Vehicle Type(Buses and More), Fuel Cell (Proton Exchange Membrane Fuel Cell and More), Power Range (Below 100 KW and More), Driving Range (Below 400km and More), End-Use (Public Transit Fleets and More), and Geography. The Market Forecasts are Provided in Terms of Value (USD).
Geography Analysis
Asia-Pacific region led the hydrogen fuel cell commercial vehicle market with a 41.62% share in 2024, underpinned by China's 125,000 tpa green-hydrogen capacity and large-scale component manufacturing. Cost advantages in electrolyser production and domestic procurement quotas have built a localised value chain spanning stacks, power electronics, and tanks. Japan and South Korea reinforce the region's edge with long-running R&D programs and early OEM production lines.
Europe follows closely, driven by binding CO2 cuts that require 45% lower heavy-duty emissions by 2030 and 90% by 2040. Refueling coverage reached 187 stations by May 2024, and fuel-cell bus registrations rose 82% during the same period. Cross-border projects, such as the H2Accelerate collaboration, aim to link Scandinavia to Northern Italy with 150 stations by 2030.
North America benefits from a blend of federal incentives and state mandates. California's ARCHES hub, backed by USD 1.2 billion, targets 45,000 tons/day of hydrogen by 2045. The U.S. Department of Energy wants 30% of new medium- and heavy-duty sales to be zero-emission by 2030, propelling truck OEM pilot fleets across the Pacific Northwest, the Gulf Coast, and the Great Lakes.
The Middle East and Africa region is expected to be the forecast to grow at 29.05% CAGR to 2030, is building on abundant solar and wind resources plus existing gas pipeline networks. Saudi Arabia and the UAE are constructing pilot truck corridors linking ports with inland distribution centers, aiming to decarbonize a freight sector that accounts for a quarter of regional emissions.
- Hyundai Motor Company
- Toyota Motor Corporation
- Ballard Power Systems
- Volvo Group (cellcentric JV)
- Nikola Corporation
- PACCAR Inc.
- Mercedes-Benz Group AG
- Honda Motor Co.
- SAIC Motor Corporation
- Foton Motor Group
- Tata Motors Limited
- Solaris Bus & Coach sp. z o.o.
- Plug Power Inc.
- Hyzon Motors Inc.
- Cummins Inc.
- Wrightbus Ltd.
- Zhejiang Geely Holding Group
- Dongfeng Motor Corporation
- Xiamen King Long Motor Group
- Gaussin S.A.
Additional Benefits:
- The market estimate (ME) sheet in Excel format
- 3 months of analyst support
TABLE OF CONTENTS
1 Introduction
- 1.1 Study Assumptions & Market Definition
- 1.2 Scope of the Study
2 Research Methodology
3 Executive Summary
4 Market Landscape
- 4.1 Market Overview
- 4.2 Market Drivers
- 4.2.1 Stringent Emission Regulations for Commercial Vehicles
- 4.2.2 Zero-Emission Mandates for Urban Bus Fleets in North America
- 4.2.3 Hydrogen Production Cost Declines from Renewable Electrolysis in China
- 4.2.4 Corporate Net-Zero Freight Alliances Accelerating OEM Purchase Commitments
- 4.2.5 TCO Parity for Long-Haul Trucks Above 400 km in Nordics
- 4.2.6 Port-Centric Hydrogen Corridors Spurring Early Adoption
- 4.3 Market Restraints
- 4.3.1 High Infrastructure Costs for Hydrogen Refuelling Stations
- 4.3.2 Slow Roll-out of Green Hydrogen Supply in Emerging Markets
- 4.3.3 Fuel-Cell Durability Concerns in Heavy-Duty Cycles
- 4.3.4 Competition from Battery-Electric Trucks in Short-Haul
- 4.4 Value / Supply-Chain Analysis
- 4.5 Regulatory & Technological Outlook
- 4.6 Porter's Five Forces
- 4.6.1 Bargaining Power of Suppliers
- 4.6.2 Bargaining Power of Buyers / Consumers
- 4.6.3 Threat of New Entrants
- 4.6.4 Threat of Substitute Products
- 4.6.5 Intensity of Competitive Rivalry
5 Market Size & Growth Forecasts (Value (USD))
- 5.1 By Vehicle Type
- 5.1.1 Buses
- 5.1.2 Trucks
- 5.1.3 Vans
- 5.1.4 Other Vehicle Types (Pickup Trucks, etc.)
- 5.2 By Fuel Cell Type
- 5.2.1 Proton Exchange Membrane Fuel Cell (PEMFC)
- 5.2.2 Phosphoric Acid Fuel Cell (PAFC)
- 5.2.3 Solid Oxide Fuel Cell (SOFC)
- 5.2.4 Others
- 5.3 By Power Range
- 5.3.1 Below 100 kW
- 5.3.2 100 kW - 200 kW
- 5.3.3 Above 200 kW
- 5.4 By Driving Range
- 5.4.1 Below 400 km
- 5.4.2 400 km - 600 km
- 5.4.3 Above 600 km
- 5.5 By End-User
- 5.5.1 Public Transit Fleets
- 5.5.2 Long-Haul Freight & Logistics
- 5.5.3 Last-Mile Delivery
- 5.5.4 Municipal & Utility Services
- 5.5.5 Other Applications
- 5.6 By Geography
- 5.6.1 North America
- 5.6.1.1 United States
- 5.6.1.2 Canada
- 5.6.1.3 Rest of North America
- 5.6.2 Europe
- 5.6.2.1 Germany
- 5.6.2.2 United Kingdom
- 5.6.2.3 France
- 5.6.2.4 Italy
- 5.6.2.5 Rest of Europe
- 5.6.3 Asia-Pacific
- 5.6.3.1 China
- 5.6.3.2 India
- 5.6.3.3 Japan
- 5.6.3.4 South Korea
- 5.6.3.5 Rest of Asia-Pacific
- 5.6.4 South America
- 5.6.4.1 Brazil
- 5.6.4.2 Argentina
- 5.6.4.3 Rest of South America
- 5.6.5 Middle East and Africa
- 5.6.5.1 United Arab Emirates
- 5.6.5.2 South Africa
- 5.6.5.3 Saudi Arabia
- 5.6.5.4 Rest of Middle East and Africa
- 5.6.1 North America
6 Competitive Landscape
- 6.1 Market Concentration
- 6.2 Strategic Moves
- 6.3 Market Share Analysis
- 6.4 Company Profiles (includes Global-level Overview, Market-level Overview, Core Segments, Financials as available, Strategic Information, Market Rank/Share, Products & Services, Recent Developments)
- 6.4.1 Hyundai Motor Company
- 6.4.2 Toyota Motor Corporation
- 6.4.3 Ballard Power Systems
- 6.4.4 Volvo Group (cellcentric JV)
- 6.4.5 Nikola Corporation
- 6.4.6 PACCAR Inc.
- 6.4.7 Mercedes-Benz Group AG
- 6.4.8 Honda Motor Co.
- 6.4.9 SAIC Motor Corporation
- 6.4.10 Foton Motor Group
- 6.4.11 Tata Motors Limited
- 6.4.12 Solaris Bus & Coach sp. z o.o.
- 6.4.13 Plug Power Inc.
- 6.4.14 Hyzon Motors Inc.
- 6.4.15 Cummins Inc.
- 6.4.16 Wrightbus Ltd.
- 6.4.17 Zhejiang Geely Holding Group
- 6.4.18 Dongfeng Motor Corporation
- 6.4.19 Xiamen King Long Motor Group
- 6.4.20 Gaussin S.A.
7 Market Opportunities & Future Outlook
 汽車燃料電池市場(按燃料電池類型、功率輸出、應用、最終用途和銷售管道)——2025-2032 年全球預測
 氫動力卡車市場 - 全球及區域分析:按氫氣槽類型、車輛類型、燃料電池技術、應用和區域 - 分析與預測(2025-2034年)
 2025年全球氫動力卡車市場
 全球氫內燃機市場氫動力卡車的全球市場
 2025年氫燃料電池汽車全球市場報告2025年燃料電池汽車全球市場報告2025年燃料電池電動汽車全球市場報告
 2032 年氫燃料電池汽車市場預測:按車型、零件、續航里程、動力、技術、應用和地區分類的全球分析
 全球氫動力內燃機 (ICE) 市場研究報告 - 產業分析、規模、佔有率、成長、趨勢及 2025 年至 2033 年預測