


 |
市場調查報告書
商品編碼
1842581
機器人廢棄物分類系統:市場佔有率分析、行業趨勢、統計數據和成長預測(2025-2030 年)Robotic Waste Sorting System - Market Share Analysis, Industry Trends & Statistics, Growth Forecasts (2025 - 2030) |
||||||
※ 本網頁內容可能與最新版本有所差異。詳細情況請與我們聯繫。
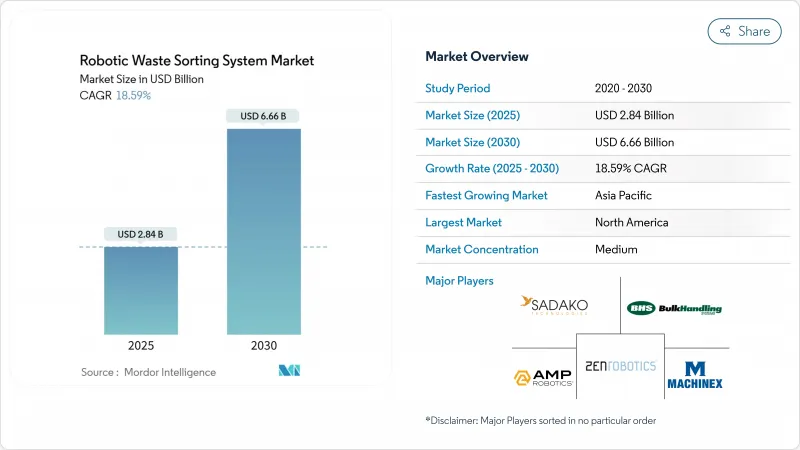
預計 2025 年機器人廢棄物分類系統市場規模將達到 28.4 億美元,到 2030 年將達到 66.6 億美元,預測期內複合年成長率為 18.59%。
機器人廢棄物分類系統市場的成長動力源自於日益嚴格的掩埋轉移法規、生產者責任要求以及對人工智慧硬體的持續投資。自動化分類已成為應對材料回收設施(MRF)勞動力短缺和中國低品位進口限制的戰略舉措,而這兩項措施正在提升高純度可回收物的價值。多感測器融合技術的快速發展使機器人能夠識別超過500種廢棄物類別,準確率高達99%,從而提高了回收率並降低了殘餘廢棄物費。基於服務的租賃模式的普及緩解了資本限制,同時,由於互聯互通的車隊使設施面臨工業控制威脅,網路安全支出也在增加。因此,在已開發經濟體中,機器人廢棄物分類系統市場正持續從先導計畫轉型為核心基礎設施投資策略。
全球機器人廢棄物分類系統市場趨勢與洞察
掩埋轉移和加強的EPR法規
生產者延伸責任 (EPR) 法規將成本從市政當局轉移到品牌所有者,而歐盟 2024 年包裝措施則加速了自動化的採用,該措施要求所有包裝必須可回收,並在 2030 年和 2040 年達到一定的回收內容閾值。市政當局和生產商目前正在部署機器人,以確保更高的材料純度並避免 EPR 處罰。經合組織指出,設計可回收產品的公司將獲得不同程度的 EPR 獎勵,這進一步刺激了對精確分類的需求。部署機器人系統的設施報告稱,在試運行後的 12 個月內,回收率提高了 20 個百分點。隨著新的區域授權複製歐盟模式,這種回報將加強機器人廢棄物分類系統的市場。
中國等國禁止進口低品位廢棄物
中國的國家利劍政策規定了0.5%的污染物限值,迫使西方塑膠回收廠升級設備以恢復出口收入。機器人提供了滿足新品質標準所需的精度,將大批量工廠的投資回收期縮短至24個月以內。馬來西亞、泰國和越南也實施了類似的禁令,進一步加劇了影響。因此,機器人廢棄物分類系統市場正在重新定位,轉向國內產能投資,例如北美營運商自2018年以來就在混合塑膠生產線上添加人工智慧分類機,以彌補商品利潤的損失。
資本投入高,投資報酬率不確定性
一條完整的機器人生產線成本在200萬至500萬美元之間,相當於10萬噸MRF 8至12個月的收益。大宗商品價格波動延長了投資回收期,減緩了新興市場的投資。租賃和機器人即服務 (RaaS) 透過將支出從資本支出轉向營運支出,緩解了這項限制因素,但在新興經濟體以外的地區,以美元計價的租賃管道仍然有限。因此,不同地區由於資本管道條件不同,機器人廢棄物分類系統產業發展不均衡。
細分分析
到2024年,市政垃圾處理廠(MRF)將佔據機器人廢棄物分類系統市場的38.5%。由於這些工廠的目標是將污染閾值控制在1%以下,管理人員正在殘渣線上部署人工智慧機器人,以提高純度並減少掩埋附加稅。預計到2030年,市政MRF機器人廢棄物分類系統的市場規模將以15%的複合年成長率穩步成長,這得益於美國州級資助項目和加拿大省級補貼。
塑膠再加工商雖然絕對規模較小,但以21.4%的複合年成長率加速成長。這個細分市場抓住了追求閉合迴路策略的消費品品牌的需求。機器人專門從事聚合物分離,提取按顏色分類的PET和HDPE。因此,預計到2030年,塑膠再加工商將佔據機器人廢棄物分類系統市場佔有率的22%,縮小與市政MRF的差距。
塑膠將繼續成為應用速度最快的產業,到2024年將佔銷售額的39%。人工智慧系統目前能夠以接近實驗室層級的精度識別多層薄膜和彩色PET。從價值鏈的角度來看,塑膠包裝的污染物每減少1%,轉售價格就會上漲25美元/噸,進而支持投資。紙張和紙板是穩定的類別,因為光學掃描器可以根據油墨和殘留物進行調整。金屬具有強大的渦流捕獲能力,而機器人則透過分離高級鋁合金來增加價值。玻璃分選正受益於人工智慧顏色檢測模型,該模型正在將斯堪地那維亞工廠的回收率從70%提高到85%。
預計到2030年,光是塑膠廢棄物分類機器人系統市場規模就將超過26億美元,佔全球整體的39%。機器人對複雜樹脂進行分類的能力將推動該領域持續保持兩位數的成長。
機器人廢棄物分類系統市場按終端設施(市政垃圾回收站、工業/商業回收廠等)、分類廢棄物類型(塑膠、紙張/紙板等)、組件(硬體、軟體、服務)、分類技術(僅人工智慧視覺、近紅外線/高光譜遙測光學等)和地區細分。市場預測以美元計算。
區域分析
到2024年,北美將佔全球銷售額的33%。早期採用機器人技術的公司將在加州、奧勒岡州和科羅拉多擴大機器人隊伍規模,以彌補勞動力短缺並滿足回收要求。光是廢棄物管理公司就將在2024年至2025年初期間投資14億美元用於人工智慧設施。由於該地區擁有超過400台AMP Robotics機器人,預計到2030年,美國機器人廢棄物分類系統市場規模將超過20億美元。
亞太地區是成長最快的地區,複合年成長率高達18.7%。中國國內政策從進口國向回收國的轉變,帶動了產能擴張,包括上海的ZenRobotics建築廢棄物線。一家日本市政工廠引進了一台人工智慧玻璃分類機,以提高琥珀和燧石玻璃屑的回收率,支持日本實現「瓶到瓶」的目標。韓國的ATron機器人的準確率高達99.3%,預示在東協地區具有出口潛力。因此,亞太地區在機器人廢棄物分類系統市場的佔有率預計將從2025年的27%上升到2030年的33%。
歐洲受益於成熟的EPR法規,這些法規為資本投資提供了資金。丹麥一家自主建築廢棄物廠實現了98%的再生骨材純度,樹立了循環經濟的新標竿。 Urbaser在西班牙推出的首個人工智慧分類舉措,標誌著伊比利亞半島的人工智慧應用日益普及。雖然該地區的成長率比亞太地區更穩定,但該地區仍然是技術的試驗田,先導計畫和專利高度集中,為機器人廢棄物分類系統市場樹立了全球標準。
其他福利:
- Excel 格式的市場預測 (ME) 表
- 3個月的分析師支持
目錄
第1章 引言
- 研究假設和市場定義
- 調查範圍
第2章調查方法
第3章執行摘要
第4章 市場狀況
- 市場概況
- 市場促進因素
- 掩埋轉移和加強的EPR法規
- 中國等國禁止進口低品位廢棄物
- 勞動力短缺和MRF營運成本上升
- 再生材料包裝要求激增
- 人工智慧閉合迴路數據的需求
- 基於OEM服務的機器人租賃模式
- 市場限制
- 資本投入高,投資報酬率不確定性
- OandM的技術人才有限
- 二級商品價格波動
- 工業物聯網機器人暴露網路安全問題
- 價值/供應鏈分析
- 監管狀況
- 技術展望
- 波特五力分析
- 新進入者的威脅
- 買方的議價能力
- 供應商的議價能力
- 替代品的威脅
- 競爭對手之間的競爭強度
第5章市場規模及成長預測
- 按最終用途設施
- 市政 MRF
- 工業和商業回收工廠
- 建築和拆除設施
- 塑膠再處理器
- 電子垃圾回收商
- 按類型分類廢棄物
- 塑膠
- 紙和紙板
- 金屬
- 玻璃
- 有機垃圾和廚餘垃圾
- 混合廢棄物
- 按組件
- 硬體
- 軟體
- 服務(安裝、維運、租賃)
- 依排序技術
- 人工智慧視覺
- 近紅外線/高光譜遙測光學
- 3D雷射和X光
- 混合多感測器
- 按地區
- 北美洲
- 美國
- 加拿大
- 墨西哥
- 南美洲
- 巴西
- 阿根廷
- 智利
- 其他南美
- 歐洲
- 德國
- 英國
- 法國
- 義大利
- 西班牙
- 俄羅斯
- 其他歐洲國家
- APAC
- 中國
- 印度
- 日本
- 韓國
- 澳洲和紐西蘭
- ASEAN-6
- 亞太地區其他國家
- 中東和非洲
- 中東
- 海灣合作理事會(沙烏地阿拉伯、阿拉伯聯合大公國、卡達)
- 土耳其
- 其他中東地區
- 非洲
- 南非
- 埃及
- 奈及利亞
- 其他非洲國家
- 北美洲
第6章 競爭態勢
- 市場集中度
- 策略舉措
- 市佔率分析
- 公司簡介
- AMP Robotics Corporation
- ZenRobotics Ltd
- TOMRA Systems ASA
- Bulk Handling Systems(BHS)
- Machinex Industries Inc
- Waste Robotics Inc
- Sadako Technologies
- General Kinematics
- Pellenc ST
- Green Machine LLC
- STADLER Anlagenbau
- Bollegraaf Group
- Everest Labs
- Glacier AI
- Greyparrot
- JONO Environmental
- FANUC Corp.
- ABB Ltd.
- KUKA AG
- SUEZ Group(AI sorting JV)
- Veolia Environnement(robotic pilots)
第7章 市場機會與未來展望
The robotic waste sorting system market size stood at USD 2.84 billion in 2025 and is projected to reach USD 6.66 billion by 2030, reflecting an 18.59% CAGR during the forecast period.
Growth momentum in the robotic waste sorting system market is driven by tightening landfill-diversion rules, producer responsibility mandates, and sustained investment in artificial-intelligence hardware. Automated sorting has become a strategic response to labor scarcity at Material Recovery Facilities (MRFs) and to China's restrictions on low-grade imports, both of which have raised the value of high-purity recyclables. Rapid improvements in multi-sensor fusion now allow robots to recognize more than 500 waste categories with 99% accuracy, lifting recovery rates and lowering residual disposal fees. Service-based leasing is gaining traction, easing capital constraints, while cybersecurity spending is rising as interconnected fleets expose facilities to industrial control threats. As a result, the robotic waste sorting system market continues to shift from pilot projects to core infrastructure investment strategies across advanced economies.
Global Robotic Waste Sorting System Market Trends and Insights
Stricter Landfill Diversion and EPR Regulations
Extended Producer Responsibility rules shift cost burdens from municipalities to brand owners, and the EU's 2024 packaging measure requires all packaging to be recyclable and to hit specific recycled-content thresholds by 2030 and 2040, accelerating automation adoption. Municipalities and producers now deploy robots to secure higher material purity and avoid EPR penalties. The OECD notes that variable EPR fees reward companies that design recyclable products, which further sharpens demand for precision sortation. Facilities deploying robotic systems report recovery-rate jumps of 20 percentage points within 12 months of commissioning. These returns strengthen the robotic waste sorting system market as new regional mandates replicate the EU model.
Ban on Low-Grade Waste Imports by China and Others
China's National Sword policy requires sub-0.5% contamination, forcing Western MRFs to upgrade equipment to regain export revenue. Robots provide the accuracy needed to meet the new quality bar, and payback periods have fallen to under 24 months in high-volume plants. Similar bans in Malaysia, Thailand, and Vietnam magnify the driver. Consequently, the robotic waste sorting system market has realigned toward domestic capacity investment, with North American operators adding AI sorters at mixed-plastic lines to recapture commodity margins lost after 2018.
High Capex and Payback Uncertainty
Complete robotic lines cost USD 2-5 million, equal to 8-12 months of revenue for a 100,000-tonne MRF. Commodity-price swings elongate payback, delaying investment in emerging markets. Leasing and Robotics-as-a-Service (RaaS) are mitigating this restraint by shifting spending from capex to opex, yet access to dollar-denominated leases remains limited outside developed economies. The robotic waste sorting system industry therefore advances unevenly across regions with different capital-access profiles.
Other drivers and restraints analyzed in the detailed report include:
- Labor Shortages and Rising MRF Operating Costs
- Surge in Recycled-Content Packaging Mandates
- Cyber-Security Exposure of IIoT Robots
For complete list of drivers and restraints, kindly check the Table Of Contents.
Segment Analysis
Municipal MRFs managed 38.5% of the robotic waste sorting system market in 2024, reflecting the largest installed base and the highest mix-waste volumes. As these plants target contamination thresholds below 1%, managers install AI robots on residual lines to boost purity and reduce landfill levies. The robotic waste sorting system market size for Municipal MRFs is projected to grow at a steady 15% CAGR through 2030, supported by state-level funding programs in the United States and provincial grants in Canada.
Plastic Re-processors, while smaller in absolute terms, are accelerating at 21.4% CAGR. The segment captures demand from consumer-packaged-goods brands pursuing closed-loop strategies. Robots specialize in polymer separation, extracting color-sorted PET and HDPE that command price premiums of up to 30% over mixed-bale equivalents. As a result, Plastic Re-processors are expected to hold a 22% robotic waste sorting system market share by 2030, narrowing the gap with Municipal MRFs.
Plastics accounted for 39% of revenue in 2024 and continue to exhibit the fastest uptake. AI systems now identify multilayer films and colored PET with near-laboratory precision. In value-chain terms, each percentage-point reduction in plastic bale contamination lifts resale prices by USD 25 per tonne, supporting investment cases. Paper and cardboard remain a stable category as optical scanners adjust for ink and residue. Metals enjoy robust capture using eddy currents, yet robots add value by isolating high-grade aluminum alloys. Glass sorting gains from AI color-detection models that lift recovery from 70% to 85% in Scandinavian plants.
The robotic waste sorting system market size for plastics alone is projected to exceed USD 2.6 billion by 2030, equal to 39% of global value. Robots' ability to sort complex resins positions the segment for sustained double-digit expansion.
Robotic Waste Sorting System Market is Segmented by End-Use Facility (Municipal MRFs, Industrial and Commercial Recycling Plants, and More), Waste Type Sorted (Plastics, Paper and Cardboard, and More), Component (Hardware, Software, Services), Sorting Technology (AI Vision-Only, NIR / Hyperspectral Optical, and More), Geography. The Market Forecasts are Provided in Terms of Value (USD).
Geography Analysis
North America accounted for 33% of global revenue in 2024, with early robot adopters scaling fleets to offset labor churn and to hit recycling-rate mandates in California, Oregon, and Colorado. Waste Management alone invested USD 1.4 billion in AI-enabled facilities between 2024 and early 2025. The region hosts over 400 AMP Robotics units, and robotic waste sorting system market size in the United States is projected to exceed USD 2 billion by 2030.
Asia-Pacific is the fastest-growing region at 18.7% CAGR. China's domestic policy pivot from importer to recycler triggered a surge in capacity adds, including ZenRobotics construction-waste lines in Shanghai. Japan's municipal plants deploy AI glass sorters that lift recovery rates for amber and flint cullet, supporting the country's bottle-to-bottle targets. South Korea's ATron robots demonstrate 99.3% precision and showcase export potential across ASEAN. Consequently, Asia-Pacific's share of the robotic waste sorting system market is forecast to rise from 27% in 2025 to 33% in 2030.
Europe benefits from mature EPR regulations that fund capital investment. Denmark's autonomous construction-waste plant achieves 98% purity for recycled aggregates, setting new circular-economy benchmarks. Spain's first AI sorting initiative under Urbaser signals wider Iberian adoption. Although growth is steadier than in Asia-Pacific, the region remains a technology test bed, sustaining a high concentration of pilot projects and patents that inform global standards for the robotic waste sorting system market.
- AMP Robotics Corporation
- ZenRobotics Ltd
- TOMRA Systems ASA
- Bulk Handling Systems (BHS)
- Machinex Industries Inc
- Waste Robotics Inc
- Sadako Technologies
- General Kinematics
- Pellenc ST
- Green Machine LLC
- STADLER Anlagenbau
- Bollegraaf Group
- Everest Labs
- Glacier AI
- Greyparrot
- JONO Environmental
- FANUC Corp.
- ABB Ltd.
- KUKA AG
- SUEZ Group (AI sorting JV)
- Veolia Environnement (robotic pilots)
Additional Benefits:
- The market estimate (ME) sheet in Excel format
- 3 months of analyst support
TABLE OF CONTENTS
1 INTRODUCTION
- 1.1 Study Assumptions and Market Definition
- 1.2 Scope of the Study
2 RESEARCH METHODOLOGY
3 EXECUTIVE SUMMARY
4 MARKET LANDSCAPE
- 4.1 Market Overview
- 4.2 Market Drivers
- 4.2.1 Stricter landfill diversion and EPR regulations
- 4.2.2 Ban on low-grade waste imports by China and others
- 4.2.3 Labour shortages and rising MRF operating costs
- 4.2.4 Surge in recycled-content packaging mandates
- 4.2.5 Demand for AI-enabled closed-loop data (under-reported)
- 4.2.6 OEM service-based robot leasing models (under-reported)
- 4.3 Market Restraints
- 4.3.1 High capex and payback uncertainty
- 4.3.2 Limited technical talent for OandM
- 4.3.3 Volatile secondary-commodity prices
- 4.3.4 Cyber-security exposure of IIoT robots (under-reported)
- 4.4 Value / Supply-Chain Analysis
- 4.5 Regulatory Landscape
- 4.6 Technological Outlook
- 4.7 Porter's Five Forces Analysis
- 4.7.1 Threat of New Entrants
- 4.7.2 Bargaining Power of Buyers
- 4.7.3 Bargaining Power of Suppliers
- 4.7.4 Threat of Substitutes
- 4.7.5 Intensity of Competitive Rivalry
5 MARKET SIZE AND GROWTH FORECASTS (VALUE)
- 5.1 By End-use Facility
- 5.1.1 Municipal MRFs
- 5.1.2 Industrial and Commercial Recycling Plants
- 5.1.3 Construction and Demolition Facilities
- 5.1.4 Plastic Re-processors
- 5.1.5 E-waste Recyclers
- 5.2 By Waste Type Sorted
- 5.2.1 Plastics
- 5.2.2 Paper and Cardboard
- 5.2.3 Metals
- 5.2.4 Glass
- 5.2.5 Organic and Food Waste
- 5.2.6 Mixed CandD Debris
- 5.3 By Component
- 5.3.1 Hardware
- 5.3.2 Software
- 5.3.3 Services (Installation, OandM, Leasing)
- 5.4 By Sorting Technology
- 5.4.1 AI Vision-only
- 5.4.2 NIR / Hyperspectral Optical
- 5.4.3 3-D Laser and X-ray
- 5.4.4 Hybrid Multi-Sensor
- 5.5 By Geography
- 5.5.1 North America
- 5.5.1.1 United States
- 5.5.1.2 Canada
- 5.5.1.3 Mexico
- 5.5.2 South America
- 5.5.2.1 Brazil
- 5.5.2.2 Argentina
- 5.5.2.3 Chile
- 5.5.2.4 Rest of South America
- 5.5.3 Europe
- 5.5.3.1 Germany
- 5.5.3.2 United Kingdom
- 5.5.3.3 France
- 5.5.3.4 Italy
- 5.5.3.5 Spain
- 5.5.3.6 Russia
- 5.5.3.7 Rest of Europe
- 5.5.4 APAC
- 5.5.4.1 China
- 5.5.4.2 India
- 5.5.4.3 Japan
- 5.5.4.4 South Korea
- 5.5.4.5 Australia and New Zealand
- 5.5.4.6 ASEAN-6
- 5.5.4.7 Rest of APAC
- 5.5.5 Middle East and Africa
- 5.5.5.1 Middle East
- 5.5.5.1.1 GCC (Saudi Arabia, UAE, Qatar)
- 5.5.5.1.2 Turkey
- 5.5.5.1.3 Rest of Middle East
- 5.5.5.2 Africa
- 5.5.5.2.1 South Africa
- 5.5.5.2.2 Egypt
- 5.5.5.2.3 Nigeria
- 5.5.5.2.4 Rest of Africa
- 5.5.1 North America
6 COMPETITIVE LANDSCAPE
- 6.1 Market Concentration
- 6.2 Strategic Moves
- 6.3 Market Share Analysis
- 6.4 Company Profiles (includes Global level Overview, Market level overview, Core Segments, Financials as available, Strategic Information, Market Rank/Share for key companies, Products and Services, and Recent Developments)
- 6.4.1 AMP Robotics Corporation
- 6.4.2 ZenRobotics Ltd
- 6.4.3 TOMRA Systems ASA
- 6.4.4 Bulk Handling Systems (BHS)
- 6.4.5 Machinex Industries Inc
- 6.4.6 Waste Robotics Inc
- 6.4.7 Sadako Technologies
- 6.4.8 General Kinematics
- 6.4.9 Pellenc ST
- 6.4.10 Green Machine LLC
- 6.4.11 STADLER Anlagenbau
- 6.4.12 Bollegraaf Group
- 6.4.13 Everest Labs
- 6.4.14 Glacier AI
- 6.4.15 Greyparrot
- 6.4.16 JONO Environmental
- 6.4.17 FANUC Corp.
- 6.4.18 ABB Ltd.
- 6.4.19 KUKA AG
- 6.4.20 SUEZ Group (AI sorting JV)
- 6.4.21 Veolia Environnement (robotic pilots)
7 MARKET OPPORTUNITIES AND FUTURE OUTLOOK
- 7.1 White-space and Unmet-Need Assessment
 機器人垃圾分類市場,按產品、按分類材料、按應用、按最終用戶、按國家和地區 - 2025 年至 2032 年全球行業分析、市場規模、市場佔有率和預測
 廢棄物分類機器人市場規模、佔有率、成長分析、按廢棄物類型、按機器人類型、按應用、按最終用途、按地區 - 行業預測,2024-2031 年
 全球廢棄物分類機器人市場,2024-2028
 機器人垃圾分類市場(提供:硬體、軟體和解決方案;以及分類材料:塑膠垃圾、紙張垃圾、金屬垃圾、食物垃圾和電子垃圾)-全球產業分析、規模、佔有率、成長、趨勢和預測, 2024- 2034
 到 2030 年機器人廢棄物分類系統的全球市場預測:按類型、廢棄物分類類型、回收設施中安裝的機器人、應用和區域進行全球分析到 2030 年廢棄物分類機器人的市場預測:按類型、廢棄物分類類型、應用和區域進行全球分析