


 |
市場調查報告書
商品編碼
1842510
IT營運分析(ITOA):市場佔有率分析、產業趨勢、統計數據、成長預測(2025-2030)IT Operation Analytics (ITOA) - Market Share Analysis, Industry Trends & Statistics, Growth Forecasts (2025 - 2030) |
||||||
※ 本網頁內容可能與最新版本有所差異。詳細情況請與我們聯繫。
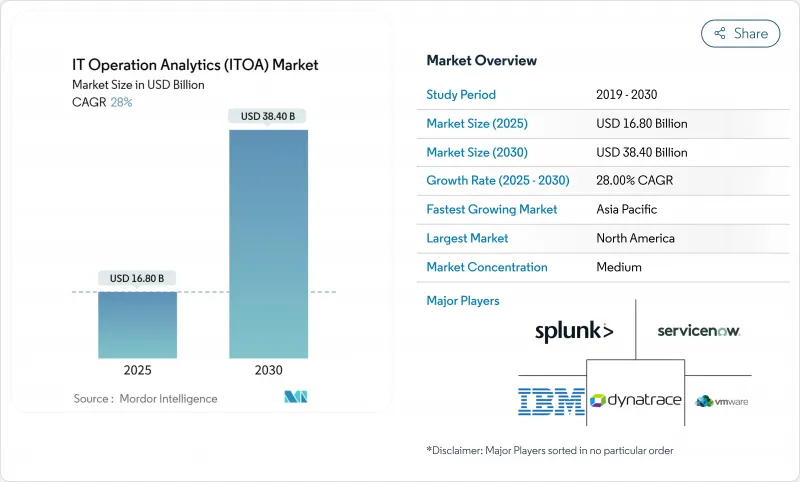
IT 營運分析 (ITOA) 市場預計在 2025 年達到 168 億美元,在 2030 年達到 384 億美元。
隨著混合雲端和多重雲端應用的日益普及,企業正從被動監控轉向人工智慧驅動的營運智慧,以防止代價高昂的宕機。雲端部署是預設架構,因為它們可以消除硬體開銷並實現彈性擴展;而預測分析則透過將原始遠端檢測轉換為預警訊號,從而降低關鍵業務工作負載的風險。金融服務領域監管審查的加強以及關鍵基礎設施網路風險的上升,進一步加速了雲端技術的採用。策略性併購也進一步增強了市場勢頭,尤其是思科以280億美元收購了Splunk,該公司將深度資料包視覺性與高階分析技術相結合,打造了一個端到端的洞察平台。
全球 IT 營運分析 (ITOA) 市場趨勢與洞察
雲端原生可觀察性的採用推動了對即時 ITOA 的需求
隨著雲端優先架構將工作負載分散到容器、無伺服器功能和邊緣節點,統一遠端檢測至關重要。採用現代可觀測性平台的組織比使用傳統工具的組織平均解決時間縮短了 45%。統一的管道將日誌、指標和追蹤資料串流傳輸到單一資料平面,機器學習模型會在此標記異常並啟動自動修復。與 DevOps 工作流程的緊密整合使工程師能夠在運作之前檢測到效能下降。這些功能結合,提高了服務可靠性,同時減少了事件噪音,從而推動了 IT 營運分析 (ITOA) 市場的發展。
從孤立的 ITOM 工具快速轉變為整合的 AIOps 套件
企業傳統上會同時使用 15-20 種獨立的監控產品,造成警報疲勞和盲點。整合的 AIOps 套件打破了孤島,並將 AI 應用於事件關聯,將手動操作減少 90%,並將事件解決時間縮短 21%。隨著混合架構增加資料來源數量,整合基礎架構、應用程式和業務指標的一站式套件變得至關重要,這將擠壓單點供應商的市場佔有率,並增強主導 IT 營運分析 (ITOA) 市場的平台能力。
資料工程和許可的初始成本高昂
啟動一個全面的分析流程可能耗資超過 1000 萬美元,其中包括資料湖、收費處理器和 AI 工具。每節點或每 GB 的收費系統會隨著基礎設施的成長而線性成長,這限制了預算的可預測性。中小企業進入 IT 營運分析市場的速度一直很慢,因為整體擁有成本佔年度 IT 支出的 15-20%。雖然雲端運算的 SaaS 模式可以降低資本支出,但長期訂閱總合仍可與本地部署成本相提並論。
報告中分析的其他促進因素和限制因素
- 混合雲端環境中預測性故障預防的需求
- FinOps 授權推動成本感知分析的採用
- 站點可靠性/DevSecOps 技能短缺
細分分析
預計到2024年,雲端交付將佔據IT營運分析 (ITOA) 市場佔有率的71.3%,到2030年,複合年成長率將達到22.8%,這凸顯了買家對無需硬體維護的託管服務的偏好。此模式可將部署交付前置作業時間縮短高達60%,並可根據波動的遠端檢測負載調整容量,從而在預測期內直接推動IT營運分析 (ITOA) 市場規模成長151億美元。相較之下,在受嚴格監管且必須將資料鎖定在特定管轄範圍內的行業中,本地部署選項仍然佔據主導地位。
由於主權要求,金融機構和公共部門組織維護本地堆疊,但即使是這些用戶也擴大採用混合架構,將不太敏感的工作負載遷移到 SaaS AIOps 平台。超大規模企業正在透過將觀察鉤子直接整合到其基礎設施即程式碼模板中來增強其優勢,從而進一步匯總買家支出。在邊緣,輕量級收集器將摘要推送到雲端核心,從而實現低延遲,同時保持集中式分析管治。
由於網路攻擊在基於簽章的工具啟動之前利用了操作漏洞,安全性和網路監控將在 2024 年佔據 IT 營運分析市場的 29.0%。融合的 SecOps 儀表板將資料包流和應用程式追蹤關聯起來,檢測異常的速度比孤立模型快 50%,從而增強了與風險緩解相關的 IT 營運分析 (ITOA) 市場規模的優勢。
以AIOps為中心的根本原因分析成長最快,複合年成長率達24.6%,這得益於AI主導的叢集能夠丟棄重複警報並精準定位潛在故障。基礎設施監控正朝著預測性容量規劃的方向發展,業務服務監控將SLO違規與收益影響聯繫起來,成為數位零售商在閃購高峰期備受追捧的功能。通訊業者正在利用5G網路數據分析功能將整體擁有成本降低45%,凸顯了IT營運分析市場用例的廣泛性。
IT營運分析 (ITOA) 市場配置(雲端和本地)、應用(應用程式監控、業務和IT服務監控等)、最終用戶產業(BFSI、醫療保健等)、分析類型(預測分析、根本原因分析等)和地區細分。市場預測以美元計算。
區域分析
到2024年,北美將引領IT營運分析 (ITOA) 市場,收入成長率將達到37.4%,這得益於成熟的DevOps文化、資金雄厚的風險投資生態系統以及聯邦政府對雲端遷移的津貼計畫。隨著Splunk、IBM和ServiceNow等領先供應商擁有密集的企業裝置量,該地區的成長正從待開發區部署轉向增值的AI擴展和跨領域整合。在零信任架構法規的推動下,分析預算將進一步成長,但隨著第一批計劃進入最佳化階段,整體擴張速度正在放緩。
預計亞太地區將成長最快,到2030年複合年成長率將達到19.8%。世界各國政府都將人工智慧的應用定位為提升工業競爭力的槓桿,並鼓勵製造商將現場營運技術 (OT) 流與IT遙測技術結合,以部署預測性維護。 43%的公司的AI投資意向預算成長超過20%,滿足了龐大的分析需求。邊緣原生架構、豐富的工程人才以及充滿活力的新興企業生態系統正在填補高級SRE領域的技能短缺,鞏固該地區作為IT營運分析市場關鍵引擎的地位。
歐洲正在平衡創新與嚴格的資料主權法規,要求平台在實現在地化處理的同時,支援跨國協作分析。 《數位營運彈性法案》等立法正在推動採購標準向審核和管治發展,鼓勵供應商添加策略感知資料路由功能。永續性指令正在推動用例的增加,企業利用分析技術來追蹤資料中心內的能源消費量和碳足跡。儘管宏觀經濟成長放緩,但合規主導的支出正在推動全球IT營運分析市場的蓬勃發展。
其他福利:
- Excel 格式的市場預測 (ME) 表
- 3個月的分析師支持
目錄
第1章 引言
- 研究假設和市場定義
- 調查範圍
第2章調查方法
第3章執行摘要
第4章 市場狀況
- 市場概況
- 市場促進因素
- 雲端原生可觀察性的採用推動了對即時 ITOA 的需求
- 從孤立的 ITOM 工具快速遷移到統一的 AIOps 套件
- 混合雲端環境中預測性故障預防的需求
- FinOps 授權推動成本感知分析的採用
- 主權雲監管刺激區域ITOA
- 市場限制
- 資料工程和許可的初始成本高昂
- 站點可靠性/DevSecOps 技能短缺
- 日誌出口的資料居住限制阻礙了人工智慧訓練
- 監管狀況
- 技術展望
- 波特五力分析
- 新進入者的威脅
- 買方的議價能力
- 供應商的議價能力
- 替代品的威脅
- 競爭對手之間的競爭強度
第5章市場規模及成長預測
- 按部署
- 雲端基礎
- 本地部署
- 按用途
- 應用程式監控
- 業務和 IT 服務監控
- 基礎設施監控
- 網路安全監控
- 按最終用戶產業
- BFSI
- 衛生保健
- 通訊
- 零售與電子商務
- 工業和製造業
- 政府及公共機構
- 按分析類型
- 預測分析
- 根本原因分析
- 視覺/儀表板分析
- 行為分析
- 按地區(跨細分)
- 北美洲
- 美國
- 加拿大
- 墨西哥
- 歐洲
- 英國
- 德國
- 法國
- 義大利
- 其他歐洲國家
- 亞太地區
- 中國
- 日本
- 印度
- 韓國
- 亞洲其他地區
- 中東
- 以色列
- 沙烏地阿拉伯
- 阿拉伯聯合大公國
- 土耳其
- 其他中東地區
- 非洲
- 南非
- 埃及
- 其他非洲國家
- 南美洲
- 巴西
- 阿根廷
- 其他南美
- 北美洲
第6章 競爭態勢
- 市場集中度
- 策略舉措
- 市佔率分析
- 公司簡介
- Splunk Inc.
- IBM Corporation
- ServiceNow Inc.
- VMware Inc.(Broadcom)
- Dynatrace Inc.
- Oracle Corporation
- BMC Software Inc.
- Micro Focus Intl. plc
- Cisco Systems Inc.
- AppDynamics LLC
- Elastic NV
- SAS Institute Inc.
- New Relic Inc.
- PagerDuty Inc.
- Datadog Inc.
- SolarWinds Corp.
- ManageEngine(Zoho)
- OpsRamp Inc.
- Evolven Software
- XpoLog Ltd.
第7章 市場機會與未來展望
The IT operations analytics market reached USD 16.8 billion in 2025 and is on course to hit USD 38.4 billion by 2030, reflecting a solid 17.9% CAGR.
Expansion is powered by enterprises re-tooling from reactive monitoring to AI-enabled operational intelligence that prevents costly outages in increasingly hybrid and multi-cloud estates. Cloud deployment is the default architecture because it eliminates hardware overhead and permits elastic scaling, while predictive analytics de-risks business-critical workloads by turning raw telemetry into early-warning signals. Intensifying regulatory scrutiny in financial services and heightened cyber-risk across critical infrastructure further amplify adoption. Market momentum is reinforced by strategic M&A, notably Cisco's USD 28 billion purchase of Splunk, which marries deep-packet visibility with advanced analytics to create end-to-end insight platforms.
Global IT Operation Analytics (ITOA) Market Trends and Insights
Cloud-Native Observability Adoption Accelerates Real-Time ITOA Demand
Cloud-first architectures fragment workloads across containers, serverless functions and edge nodes, making unified telemetry indispensable. Organizations that implement modern observability platforms record 45% faster mean-time-to-resolution than users of legacy tools. Integrated pipelines stream logs, metrics and traces into a single data plane, where machine-learning models flag anomalies and launch auto-remediation. Tight coupling with DevOps workflows lets engineers catch performance regressions before production cut-overs. Together these capabilities lift service reliability while shrinking incident noise, propelling the IT operations analytics market forward.
Rapid Shift from Siloed ITOM Tools to Unified AIOps Suites
Enterprises historically juggled 15-20 standalone monitoring products, breeding alert fatigue and blind spots. Consolidated AIOps suites collapse those silos and apply AI for event correlation, cutting manual operational effort by 90% and shrinking incident resolution time 21%.Centralized insight also trims vendor overhead and licensing complexity. As hybrid architectures multiply data sources, one-stop suites that fuse infrastructure, application and business metrics become essential, squeezing single-function vendors and reinforcing platform plays that dominate the IT operations analytics market.
High Initial Data-Engineering & Licensing Costs
Standing up full-scale analytics pipelines can top USD 10 million once data lakes, stream processors and AI tooling are counted. Fee structures that charge per node or per GB scale linearly with infrastructure growth, constraining budget predictability. Smaller enterprises see total cost of ownership absorb 15-20% of annual IT spend, delaying entry into the IT operations analytics market. Cloud SaaS models soften capex, but long-term subscription totals can still rival on-premise expense.
Other drivers and restraints analyzed in the detailed report include:
- Need for Predictive Outage Prevention in Hybrid-Cloud Estates
- FinOps Mandates Push Cost-Aware Analytics Adoption
- Shortage of Site-Reliability / DevSecOps Skillsets
For complete list of drivers and restraints, kindly check the Table Of Contents.
Segment Analysis
Cloud deliveries secured 71.3% of the IT operations analytics market share in 2024 and are forecast to rise at 22.8% CAGR through 2030, underscoring buyer preference for managed services that eliminate hardware upkeep. This model slashes deployment lead-times by up to 60% and aligns capacity with volatile telemetry loads, directly enlarging the IT operations analytics market size by USD 15.1 billion over the forecast window. In contrast, on-premise options persist in heavily regulated verticals that must anchor data within jurisdictional borders.
Financial institutions and public agencies retain local stacks for sovereignty mandates, yet even these users increasingly adopt hybrid blends that shuttle non-sensitive workloads to SaaS AIOps platforms. Hyperscalers strengthen their advantage by embedding observability hooks directly into infrastructure-as-code templates, further consolidating buyer spend. At the edge, lightweight collectors push summaries to cloud cores, preserving low latency while retaining centralized analytics governance.
Security and network monitoring constituted 29.0% of the IT operations analytics market in 2024 as cyberattacks exploit operational weak points before signature-based tools trigger. Converged SecOps dashboards that correlate packet flows with application traces detect anomalies 50% faster than siloed models, reinforcing the IT operations analytics market size premium attached to risk mitigation.
AIOps-centric root-cause analytics is the fastest riser, clocking 24.6% CAGR, as AI-driven clustering collapses duplicate alerts and pinpoints origin faults. Infrastructure monitoring matures toward predictive capacity planning, while business service monitoring links SLO breaches to revenue impact, a feature prized by digital retailers during flash-sale peaks. Telecom operators harness 5G network data-analytics functions to lower total cost of ownership 45%, illuminating the breadth of use cases spanning the IT operations analytics market.
IT Operation Analytics (ITOA) Market is Segmented by Deployment (Cloud and On-Premise), Application (Application Monitoring, Business and IT Services Monitoring, and More), End-User Industry (BFSI, Healthcare, and More), Analytics Type (Predictive Analytics, Root-Cause Analytics, and More), and Geography. The Market Forecasts are Provided in Terms of Value (USD).
Geography Analysis
North America led the IT operations analytics market with 37.4% revenue in 2024, buoyed by mature DevOps cultures, well-funded venture ecosystems and federal programs that subsidize cloud migration. Flagship vendors such as Splunk, IBM and ServiceNow enjoy dense enterprise install bases, so regional growth pivots from greenfield deployments toward value-added AI extensions and cross-domain integrations. Regulatory pushes for zero-trust architectures further elevate analytics budgets, though overall expansion moderates as first-wave projects reach optimization stage.
Asia-Pacific is the fastest-growing geography, projected at 19.8% CAGR to 2030. Governments position AI adoption as a lever for industrial competitiveness, prompting manufacturers to integrate shop-floor OT streams with IT telemetry for predictive maintenance rollouts. AI investment intentions exceed 20% budget growth among 43% of enterprises, feeding a sizeable pipeline of analytics demand. Edge-native architectures, abundant engineering talent and vibrant start-up ecosystems offset skills shortages in advanced SRE disciplines, cementing the region as a primary engine of the IT operations analytics market.
Europe balances innovation with strict data-sovereignty rules, requiring platforms to localize processing while enabling federated analysis across borders. Legislation such as the Digital Operational Resilience Act shapes procurement criteria toward auditability and governance, prompting vendors to add policy-aware data-routing features. Sustainability directives create incremental use cases as enterprises leverage analytics to track energy consumption and carbon footprints within data centers. Despite slower macro-economic growth, compliance-driven spending keeps the IT operations analytics market vibrant across the continent.
- Splunk Inc.
- IBM Corporation
- ServiceNow Inc.
- VMware Inc. (Broadcom)
- Dynatrace Inc.
- Oracle Corporation
- BMC Software Inc.
- Micro Focus Intl. plc
- Cisco Systems Inc.
- AppDynamics LLC
- Elastic N.V.
- SAS Institute Inc.
- New Relic Inc.
- PagerDuty Inc.
- Datadog Inc.
- SolarWinds Corp.
- ManageEngine (Zoho)
- OpsRamp Inc.
- Evolven Software
- XpoLog Ltd.
Additional Benefits:
- The market estimate (ME) sheet in Excel format
- 3 months of analyst support
TABLE OF CONTENTS
1 INTRODUCTION
- 1.1 Study Assumptions and Market Definition
- 1.2 Scope of the Study
2 RESEARCH METHODOLOGY
3 EXECUTIVE SUMMARY
4 MARKET LANDSCAPE
- 4.1 Market Overview
- 4.2 Market Drivers
- 4.2.1 Cloud-native observability adoption accelerates real-time ITOA demand
- 4.2.2 Rapid shift from siloed ITOM tools to unified AIOps suites
- 4.2.3 Need for predictive outage prevention in hybrid-cloud estates
- 4.2.4 FinOps mandates push cost-aware analytics adoption
- 4.2.5 Sovereign-cloud regulations spur regional ITOA variants
- 4.3 Market Restraints
- 4.3.1 High initial data-engineering and licensing costs
- 4.3.2 Shortage of site-reliability / DevSecOps skillsets
- 4.3.3 Data-residency limits on log export hamper AI training
- 4.4 Regulatory Landscape
- 4.5 Technological Outlook
- 4.6 Porter's Five Forces Analysis
- 4.6.1 Threat of New Entrants
- 4.6.2 Bargaining Power of Buyers
- 4.6.3 Bargaining Power of Suppliers
- 4.6.4 Threat of Substitutes
- 4.6.5 Intensity of Competitive Rivalry
5 MARKET SIZE AND GROWTH FORECASTS
- 5.1 By Deployment
- 5.1.1 Cloud-based
- 5.1.2 On-premise
- 5.2 By Application
- 5.2.1 Application Monitoring
- 5.2.2 Business and IT-Service Monitoring
- 5.2.3 Infrastructure Monitoring
- 5.2.4 Network and Security Monitoring
- 5.3 By End-user Industry
- 5.3.1 BFSI
- 5.3.2 Healthcare
- 5.3.3 Telecommunication
- 5.3.4 Retail and E-commerce
- 5.3.5 Industrial / Manufacturing
- 5.3.6 Government and Public Sector
- 5.4 By Analytics Type
- 5.4.1 Predictive Analytics
- 5.4.2 Root-Cause Analytics
- 5.4.3 Visual / Dashboard Analytics
- 5.4.4 Behavior Analytics
- 5.5 By Geography (Cross-segmentation)
- 5.5.1 North America
- 5.5.1.1 United States
- 5.5.1.2 Canada
- 5.5.1.3 Mexico
- 5.5.2 Europe
- 5.5.2.1 United Kingdom
- 5.5.2.2 Germany
- 5.5.2.3 France
- 5.5.2.4 Italy
- 5.5.2.5 Rest of Europe
- 5.5.3 Asia-Pacific
- 5.5.3.1 China
- 5.5.3.2 Japan
- 5.5.3.3 India
- 5.5.3.4 South Korea
- 5.5.3.5 Rest of Asia
- 5.5.4 Middle East
- 5.5.4.1 Israel
- 5.5.4.2 Saudi Arabia
- 5.5.4.3 United Arab Emirates
- 5.5.4.4 Turkey
- 5.5.4.5 Rest of Middle East
- 5.5.5 Africa
- 5.5.5.1 South Africa
- 5.5.5.2 Egypt
- 5.5.5.3 Rest of Africa
- 5.5.6 South America
- 5.5.6.1 Brazil
- 5.5.6.2 Argentina
- 5.5.6.3 Rest of South America
- 5.5.1 North America
6 COMPETITIVE LANDSCAPE
- 6.1 Market Concentration
- 6.2 Strategic Moves
- 6.3 Market Share Analysis
- 6.4 Company Profiles (includes Global level Overview, Market level overview, Core Segments, Financials as available, Strategic Information, Market Rank/Share for key companies, Products and Services, and Recent Developments)
- 6.4.1 Splunk Inc.
- 6.4.2 IBM Corporation
- 6.4.3 ServiceNow Inc.
- 6.4.4 VMware Inc. (Broadcom)
- 6.4.5 Dynatrace Inc.
- 6.4.6 Oracle Corporation
- 6.4.7 BMC Software Inc.
- 6.4.8 Micro Focus Intl. plc
- 6.4.9 Cisco Systems Inc.
- 6.4.10 AppDynamics LLC
- 6.4.11 Elastic N.V.
- 6.4.12 SAS Institute Inc.
- 6.4.13 New Relic Inc.
- 6.4.14 PagerDuty Inc.
- 6.4.15 Datadog Inc.
- 6.4.16 SolarWinds Corp.
- 6.4.17 ManageEngine (Zoho)
- 6.4.18 OpsRamp Inc.
- 6.4.19 Evolven Software
- 6.4.20 XpoLog Ltd.
7 MARKET OPPORTUNITIES AND FUTURE OUTLOOK
- 7.1 White-space and Unmet-need Assessment
 IT 營運分析市場 - 全球產業規模、佔有率、趨勢、機會和預測(按組件、按應用、按最終用戶、按地區和競爭細分,2020-2030 年預測)視覺化分析市場-全球產業規模、佔有率、趨勢、機會和預測,按視覺化類型、資料來源、最終用戶、地區和競爭情況細分,2020-2030 年預測
 IT 營運分析市場:2025-2030 年全球預測(按解決方案類型、分析類型、資料來源、部署類型、組織規模、應用程式和產業)
 IT 營運分析市場規模及預測 2021 - 2031、全球及地區佔有率、趨勢及成長機會分析報告涵蓋範圍:依產品、部署、應用、垂直產業及地區
 全球 IT 營運分析市場研究報告 - 產業分析、規模、佔有率、成長、趨勢及 2025 年至 2033 年預測
 2025年全球IT營運分析市場報告
 全球視覺化分析市場規模、佔有率、趨勢分析報告 - 按部署模式、類型、業務功能、組織規模、行業垂直和地區分類的展望和預測,2024 年至 2031 年
 2025-2033 年按組件、服務、部署模式、企業規模、業務功能、垂直行業和地區分類的可視化分析市場報告
 IT 營運分析市場規模、佔有率、按產品、資料來源、技術和地區分類的成長分析 - 產業預測,2024-2031 年
 全球 IT 營運分析市場規模、佔有率和趨勢分析:按公司規模、技術、部署類型、應用、最終用途、區域、前景和預測,2024-2031 年