


 |
市場調查報告書
商品編碼
1842503
車載連接:市場佔有率分析、行業趨勢、統計數據和成長預測(2025-2030 年)Onboard Connectivity - Market Share Analysis, Industry Trends & Statistics, Growth Forecasts (2025 - 2030) |
||||||
※ 本網頁內容可能與最新版本有所差異。詳細情況請與我們聯繫。
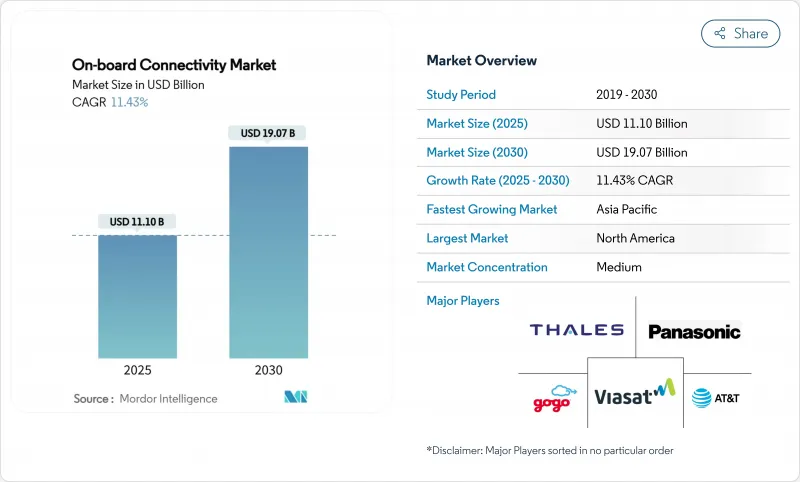
據估計,2025 年車載連接市場規模預計將達到 111 億美元,預計到 2030 年將達到 190.7 億美元,複合年成長率為 11.43%。
持續成長反映了從單純依賴地球靜止衛星的架構到整合低地球軌道 (LEO)、中地球軌道 (MEO) 和地球靜止軌道 (GEO) 容量的混合架構的決定性轉變,從而增強了低延遲和網路彈性。由聯邦通訊委員會 (FCC) 的「太空補充覆蓋」規則引領的監管勢頭,如今已實現衛星與地面融合,並開啟了直接面向設備的經營模式。航空公司、鐵路營運商和航運公司將利用廣告支援的 Wi-Fi、整合 5G回程傳輸和預測性維護分析,將這些規則變化轉化為新的收益源。設備供應商正在透過整合軟體定義網路和多衛星群終端釋放變化,其自適應路由可延長運作並降低單軌道故障的風險。
全球車載連接市場趨勢與洞察
高速乘客Wi-Fi需求快速成長
87% 的乘客願意觀看廣告以換取免費 Wi-Fi,收益模式正轉向廣告支援型存取。到 2035 年,寬頻服務每年可為航空公司帶來 300 億美元的輔助收入。 ViaAsert 目前與 60 多家航空公司簽訂了廣告協議,彰顯了其規模。乘客調查顯示,83% 的乘客表示願意重新預訂提供更優質 Wi-Fi 的航空公司的航班,鞏固了連接性作為差異化優勢的地位。嘉年華航空集團 (Carnival Corporation) 在整個機隊部署了 Starlink 衛星網路,提高了乘客滿意度和機組人員的社會福利。航空公司也將椅背顯示器與個人裝置結合,以提供有針對性的內容,從而提高品牌忠誠度和廣告產量。
低地球衛星群的快速部署
Starlink 首批 12 顆直接存取基地台的衛星計畫於 2024 年推出文字服務,並於 2025 年推出語音/資料功能,從而減少許多用例對星載天線的依賴。 Viasat 正在整合 Telesat Lightspeed 的容量,而 Hughes 的 Fusion 方案則為Delta航空融合了低地球軌道 (LEO) 和地球靜止軌道 (GEO)頻寬。通訊業者與行動通訊業者之間的直接接取設備協定消除了鐵路和海事部門對專用終端的需求。 Eutelsat OneWeb 和國際通訊衛星組織 (Intelsat) 的北極演示改善了北極地區的覆蓋範圍。透過 3D 列印和垂直整合降低衛星製造成本,使其能夠以低於傳統地球靜止軌道 (GEO) 經濟的價格獲得具有競爭力的價格。 FCC 頻譜分配進一步簡化了衛星群部署並加快了服務投入時間。
維修和認證成本高
根據美國聯邦航空管理局(FAA)20-168號諮詢通告,連接性維修需要進行測試,每架飛機耗時12至18個月,耗資數百萬美元。歐洲航空安全局(EASA)的歐洲空中交通管制系統辦公室(ETSO)框架也對跨境飛機設置了類似的障礙。電子導航太線引入了缺乏歷史基準的新核准類別,並延長了審核流程。惡劣的海洋環境需要堅固的硬體和漫長的海上試驗,從而提升單位經濟效益。固定認證成本對小型航空公司負擔最重,而大型業者則能提升規模經濟效益。
報告中分析的其他促進因素和限制因素
- 全球客運量成長
- 提高網路可靠性
- 嚴格的航空和海事法規
細分分析
2024年,硬體將佔機上連接市場收入的45.98%,涵蓋支撐機上連接市場實體鏈路的產品,例如天線、數據機和路由器。另一方面,服務預計將以12.60%的複合年成長率成長,這反映出營運商更傾向於基於結果的契約,將履約風險轉移給供應商。隨著多軌道複雜性超越內部技能水平,與託管服務相關的機載連接市場規模預計將擴大。
服務的成長與安裝專業知識、端到端監控和運作保證的需求的不斷成長同步。供應商正在將軟體維護、網路安全和法規遵循捆綁在一起,從而實現可預測的總體擁有成本。航空公司和鐵路公司擴大簽訂多年期服務契約,並根據乘客使用情況收取費用,而航運公司則正在尋求將機組人員社會福利和營運數據回程傳輸整合在一起的套餐。硬體供應商正在透過整合支援遠距離診斷的軟體功能來應對這項挑戰,以確保設備在售出後持續的服務收入。
到2024年,衛星解決方案將占到總收入的75.65%,凸顯了機上連接市場的歷史根基。然而,混合軌道和多軌道架構正以16.54%的複合年成長率擴張,改變了競爭重心。由於營運商優先考慮彈性,單軌道模型的機載連接市場佔有率預計將有所下降。
混合網路的採用正在加速,因為低軌衛星段可以降低即時服務的延遲,而地球同步軌道(GEO)仍然是批量串流媒體的理想選擇。軟體定義無線電可以在幾毫秒內切換衛星群,以支援不間斷的會話。密集的鐵路走廊正在部署地對車5G網路,以實現經濟高效的容量,而衛星則是偏遠地區的預設選擇。供應商正在透過編配演算法實現差異化,這些演算法無需用戶干預即可將流量分配到成本最低的路徑。
區域分析
2024年,北美地區佔比41.78%,顯示該地區早期採用低地球軌道(LEO)服務、政策清晰,且航空公司升級預算雄厚。 Gogo的伽利略商務航空解決方案凸顯了對全球漫遊多軌功能的需求。美國鐵路公司(Amtrak)為東北走廊計畫提供的82億美元聯邦資金加速了車站到列車的Wi-Fi計劃。墨西哥灣的能源資產正在利用Tamnet的海底光纖與AT&T的5G技術結合,實現海上覆蓋。
預計亞太地區將以13.20%的複合年成長率成長,到2035年需要43兆美元的基礎設施投資。東協的經濟整合計畫將數位互聯互通置於基礎之上,從而提升了乘客的期望。中國、日本和印度的高鐵從設計階段就已融入數Gigabit鏈路,以避免維修延誤。新加坡航運公司正在部署可在低地球軌道(LEO)和地球靜止軌道(GEO)之間自動切換的混合終端。該地區的年輕一代正在加速在旅行中使用連網娛樂和電子商務。
歐洲繼續透過擴展跨歐洲鐵路網和需要強大海上連接的北海可再生能源計劃實現穩步成長。 Starline 的歐洲大陸鐵路網藍圖凸顯了歐盟委員會對無縫漫遊的承諾。英國已同意一項公私協議,旨在消除主要鐵路線上的移動盲點。郵輪和貨運業者正在將Ka波段容量與傳統的L波段安全頻道結合,以平衡冗餘和成本。日益嚴格的資料保護法將要求供應商預設採用高級加密技術。
其他福利:
- Excel 格式的市場預測 (ME) 表
- 3個月的分析師支持
目錄
第1章 引言
- 研究假設和市場定義
- 調查範圍
第2章調查方法
第3章執行摘要
第4章 市場狀況
- 市場概況
- 市場促進因素
- 高速乘客Wi-Fi需求快速成長
- 低地球衛星群的快速部署
- 全球旅客數量增加
- 廣告支援的連結模型
- 提高多軌鐵路網的可靠性
- 直接到設備的衛星服務
- 市場限制
- 維修和認證成本高
- 嚴格的航空和海事法規
- RF頻譜擁塞 (Ku/Ka)
- 網路安全漏洞
- 價值鏈分析
- 監管狀況
- 技術展望
- 波特五力分析
- 新進入者的威脅
- 買方的議價能力
- 供應商的議價能力
- 替代品的威脅
- 競爭對手之間的競爭
第5章市場規模及成長預測
- 按組件
- 硬體
- 天線系統
- 數據機和路由器
- 無線網路基地台
- 解決方案
- 網路管理平台
- 內容管理系統
- 服務
- 安裝和整合
- 託管連線
- 支援和維護
- 硬體
- 依連接技術
- 衛星
- 空對地(ATG)
- 混合/多軌跡
- 透過交通平台
- 航空
- 商業航空
- 公務機
- 無人系統
- 海上運輸
- 商船
- 遊輪和渡輪
- 海上能源
- 鐵路
- 高速鐵路
- 通勤/地鐵
- 航空
- 按用途
- 娛樂
- 通訊
- 安全與營運
- 其他
- 按地區
- 北美洲
- 美國
- 加拿大
- 墨西哥
- 歐洲
- 德國
- 英國
- 法國
- 俄羅斯
- 其他歐洲國家
- 亞太地區
- 中國
- 日本
- 印度
- 澳洲
- 其他亞太地區
- 南美洲
- 巴西
- 其他南美
- 中東和非洲
- 中東
- 阿拉伯聯合大公國
- 沙烏地阿拉伯
- 其他中東地區
- 非洲
- 南非
- 其他非洲國家
- 北美洲
第6章 競爭態勢
- 市場集中度
- 策略舉措
- 市佔率分析
- 公司簡介
- Panasonic Corporation
- Viasat, Inc.
- Intelsat
- Gogo Inc.
- Thales Group
- Honeywell International Inc.
- RTX Corporation
- ALE International
- Huawei Technologies Co., Ltd.
- AT&T Inc.
- Space Exploration Technologies Corp.
- Eutelsat OneWeb(Eutelsat Group)
- SES SA
- Cobham Limited
- Anuvu Operations LLC
- Iridium Communications Inc.
第7章 市場機會與未來展望
The onboard connectivity market size is estimated at USD 11.10 billion in 2025 and is forecast to reach USD 19.07 billion by 2030, representing an 11.43% CAGR.
Sustained growth reflects a decisive migration from sole reliance on geostationary satellites to hybrid architectures that merge LEO, MEO, and GEO capacity, delivering lower latency and stronger network resilience. Regulatory momentum-most notably the Federal Communications Commission's Supplemental Coverage-From-Space rules-now permits satellite-terrestrial convergence that unlocks direct-to-device business models. Airlines, rail operators, and shipping lines translate these rule changes into new revenue streams via advertising-supported Wi-Fi, integrated 5G backhaul, and predictive-maintenance analytics. Equipment vendors respond by embedding software-defined networking and multi-constellation terminals whose adaptive routing improves uptime and mitigates single-orbit failure risks.
Global Onboard Connectivity Market Trends and Insights
Surge in Demand for High-Speed Passenger Wi-Fi
Eighty-seven percent of passengers are willing to view adverts in exchange for free Wi-Fi, shifting revenue models toward advertising-supported access. Broadband-enabled services could generate USD 30 billion in ancillary airline revenue annually by 2035. Viasat now supports more than 60 airlines under advert-funded contracts, demonstrating scale. Passenger surveys indicate that 83% would rebook with carriers offering superior Wi-Fi, cementing connectivity as a differentiator. Maritime lines echo this trajectory; Carnival Corporation's fleet-wide Starlink rollout lifted guest satisfaction and crew welfare. Airlines also merge seatback displays with personal devices, delivering targeted content that boosts brand loyalty and advertising yield.
Rapid Deployment of LEO Constellations
Starlink's initial 12 Direct-to-Cell satellites began text services in 2024, aiming for voice/data capability in 2025, reducing reliance on cabin antennas for many use cases. Viasat integrates Telesat Lightspeed capacity, while Hughes' Fusion package blends LEO and GEO bandwidth for Delta Air Lines. Direct-to-device agreements between satellite and mobile operators eliminate specialized terminals for the rail and maritime sectors. Arctic-region coverage has improved following Eutelsat OneWeb and Intelsat demonstrations above the Arctic Circle. Falling satellite manufacturing costs from 3D printing and vertical integration support competitive pricing that undercuts traditional GEO economics. FCC spectrum allocations further streamline constellation rollouts, shortening time-to-service.
High Retrofit and Certification Costs
Connectivity retrofits can extend 12-18 months and cost millions per aircraft, driven by FAA Advisory Circular 20-168 test requirements. EASA's ETSO framework imposes parallel hurdles for cross-border fleets. Electronically steered antennas introduce new approval categories that lack historical benchmarks, prolonging reviews. Harsh maritime environments demand ruggedized hardware and prolonged sea trials, inflating unit economics. Fixed certification expenses weigh hardest on smaller carriers, reinforcing scale advantages for larger operators.
Other drivers and restraints analyzed in the detailed report include:
- Rising Global Passenger Volumes
- Multi-Orbit Network Reliability Gains
- Stringent Aviation and Maritime Regulation
For complete list of drivers and restraints, kindly check the Table Of Contents.
Segment Analysis
Hardware retained 45.98% of 2024 revenue, covering antennas, modems, and routers that anchor physical links within the onboard connectivity market. Services, however, are forecasted to grow at 12.60% CAGR, reflecting operator preference for outcome-based contracts that shift performance risk to vendors. The onboard connectivity market size attached to managed services is projected to widen as multi-orbit complexity outpaces in-house skill sets.
Service growth parallels rising demand for installation expertise, end-to-end monitoring, and guaranteed uptime. Providers bundle software maintenance, cybersecurity, and regulatory compliance, fostering predictable total cost of ownership. Airlines and rail operators increasingly sign multi-year service agreements that align fees with passenger usage, while maritime firms seek packages that merge crew welfare and operational data backhaul. Hardware vendors respond by embedding software functions that enable remote diagnostics, ensuring continual service revenue even after equipment sale.
Satellite solutions delivered 75.65% of 2024 revenue, underscoring the historical foundation of the onboard connectivity market. Yet, hybrid multi-orbit architectures are expanding at 16.54% CAGR, shifting the competitive center of gravity. The onboard connectivity market share commanded by single-orbit models is expected to narrow as operators prioritize resilience.
Hybrid adoption accelerates because LEO segments cut latency for real-time services, while GEO remains ideal for bulk streaming. Software-defined radios switch between constellations in milliseconds, supporting uninterrupted sessions. Rail corridors in dense geographies deploy ground-to-train 5G for cost-effective capacity, defaulting to satellite over remote stretches. Vendors differentiate via orchestration algorithms that allocate traffic to the lowest-cost path without user intervention.
The Onboard Connectivity Market is Segmented by Component (Hardware, Solution, and Services), Connectivity Technology (Satellite, Air-To-Ground, and Hybrid/Multi-Orbit), Transportation Platform (Aviation, Maritime, and Rail), Application (Entertainment, Communication, Safety and Operations, and Others), and Geography (North America, Europe, Asia-Pacific, and More). The Market Forecasts are Provided in Terms of Value (USD).
Geography Analysis
North America's 41.78% share in 2024 demonstrates the region's early embrace of LEO services, policy clarity, and significant airline upgrade budgets. Gogo's Galileo solution for business aviation highlights demand for globally roaming multi-orbit capability. Federal funding of USD 8.2 billion toward Amtrak's Northeast Corridor accelerates station-to-train Wi-Fi projects. Gulf of Mexico energy assets rely on Tampnet subsea fiber combined with AT&T 5G for offshore coverage.
Asia-Pacific is growing at 13.20% CAGR, powered by USD 43 trillion of infrastructure investment demands through 2035. ASEAN economic-integration plans position digital connectivity as foundational, fostering uniform passenger expectations. High-speed rail in China, Japan, and India embeds multi-gigabit links from design, avoiding retrofit delays. Shipping lines in Singapore retrofit fleets with hybrid terminals that auto-switch between LEO and GEO. The region's young demographic accelerates the adoption of connected entertainment and e-commerce during travel.
Europe maintains steady growth through Trans-European Rail Network expansions and North Sea renewable projects that require robust offshore links. The Starline blueprint for continent-wide rail coverage underlines the European Commission's commitment to seamless roaming. The UK has agreed a public-private deal to eradicate mobile dead zones on main rail routes. Cruise and cargo operators integrate Ka-band capacity with legacy L-band safety channels, balancing redundancy with cost. Stricter data-protection laws oblige suppliers to embed advanced encryption as a default.
- Panasonic Corporation
- Viasat, Inc.
- Intelsat
- Gogo Inc.
- Thales Group
- Honeywell International Inc.
- RTX Corporation
- ALE International
- Huawei Technologies Co., Ltd.
- AT&T Inc.
- Space Exploration Technologies Corp.
- Eutelsat OneWeb (Eutelsat Group)
- SES S.A.
- Cobham Limited
- Anuvu Operations LLC
- Iridium Communications Inc.
Additional Benefits:
- The market estimate (ME) sheet in Excel format
- 3 months of analyst support
TABLE OF CONTENTS
1 INTRODUCTION
- 1.1 Study Assumptions and Market Definition
- 1.2 Scope of the Study
2 RESEARCH METHODOLOGY
3 EXECUTIVE SUMMARY
4 MARKET LANDSCAPE
- 4.1 Market Overview
- 4.2 Market Drivers
- 4.2.1 Surge in demand for high-speed passenger Wi-Fi
- 4.2.2 Rapid deployment of LEO constellations
- 4.2.3 Rising global passenger volumes
- 4.2.4 Advertising-supported connectivity models
- 4.2.5 Multi-orbit network reliability gains
- 4.2.6 Direct-to-device satellite services
- 4.3 Market Restraints
- 4.3.1 High retrofit and certification costs
- 4.3.2 Stringent aviation and maritime regulation
- 4.3.3 RF spectrum congestion (Ku/Ka)
- 4.3.4 Cyber-security vulnerabilities
- 4.4 Value Chain Analysis
- 4.5 Regulatory Landscape
- 4.6 Technological Outlook
- 4.7 Porter's Five Forces Analysis
- 4.7.1 Threat of New Entrants
- 4.7.2 Bargaining Power of Buyers
- 4.7.3 Bargaining Power of Suppliers
- 4.7.4 Threat of Substitutes
- 4.7.5 Competitive Rivalry
5 MARKET SIZE AND GROWTH FORECASTS (VALUE)
- 5.1 By Component
- 5.1.1 Hardware
- 5.1.1.1 Antenna Systems
- 5.1.1.2 Modems and Routers
- 5.1.1.3 Wireless Access Points
- 5.1.2 Solution
- 5.1.2.1 Network-Management Platforms
- 5.1.2.2 Content Management Systems
- 5.1.3 Services
- 5.1.3.1 Installation and Integration
- 5.1.3.2 Managed Connectivity
- 5.1.3.3 Support and Maintenance
- 5.1.1 Hardware
- 5.2 By Connectivity Technology
- 5.2.1 Satellite
- 5.2.2 Air-to-Ground (ATG)
- 5.2.3 Hybrid/Multi-Orbit
- 5.3 By Transportation Platform
- 5.3.1 Aviation
- 5.3.1.1 Commercial Airlines
- 5.3.1.2 Business Jets
- 5.3.1.3 Unmanned Systems
- 5.3.2 Maritime
- 5.3.2.1 Commercial Shipping
- 5.3.2.2 Cruise and Ferry
- 5.3.2.3 Offshore Energy
- 5.3.3 Rail
- 5.3.3.1 High-Speed
- 5.3.3.2 Commuter and Metro
- 5.3.1 Aviation
- 5.4 By Application
- 5.4.1 Entertainment
- 5.4.2 Communication
- 5.4.3 Safety and Operations
- 5.4.4 Others
- 5.5 By Geography
- 5.5.1 North America
- 5.5.1.1 United States
- 5.5.1.2 Canada
- 5.5.1.3 Mexico
- 5.5.2 Europe
- 5.5.2.1 Germany
- 5.5.2.2 United Kingdom
- 5.5.2.3 France
- 5.5.2.4 Russia
- 5.5.2.5 Rest of Europe
- 5.5.3 Asia-Pacific
- 5.5.3.1 China
- 5.5.3.2 Japan
- 5.5.3.3 India
- 5.5.3.4 Australia
- 5.5.3.5 Rest of Asia-Pacific
- 5.5.4 South America
- 5.5.4.1 Brazil
- 5.5.4.2 Rest of South America
- 5.5.5 Middle East and Africa
- 5.5.5.1 Middle East
- 5.5.5.1.1 United Arab Emirates
- 5.5.5.1.2 Saudi Arabia
- 5.5.5.1.3 Rest of Middle East
- 5.5.5.2 Africa
- 5.5.5.2.1 South Africa
- 5.5.5.2.2 Rest of Africa
- 5.5.1 North America
6 COMPETITIVE LANDSCAPE
- 6.1 Market Concentration
- 6.2 Strategic Moves
- 6.3 Market Share Analysis
- 6.4 Company Profiles (includes Global level Overview, Market level overview, Core Segments, Financials as available, Strategic Information, Market Rank/Share, Products and Services, Recent Developments)
- 6.4.1 Panasonic Corporation
- 6.4.2 Viasat, Inc.
- 6.4.3 Intelsat
- 6.4.4 Gogo Inc.
- 6.4.5 Thales Group
- 6.4.6 Honeywell International Inc.
- 6.4.7 RTX Corporation
- 6.4.8 ALE International
- 6.4.9 Huawei Technologies Co., Ltd.
- 6.4.10 AT&T Inc.
- 6.4.11 Space Exploration Technologies Corp.
- 6.4.12 Eutelsat OneWeb (Eutelsat Group)
- 6.4.13 SES S.A.
- 6.4.14 Cobham Limited
- 6.4.15 Anuvu Operations LLC
- 6.4.16 Iridium Communications Inc.
7 MARKET OPPORTUNITIES AND FUTURE OUTLOOK
- 7.1 White-space and Unmet-Need Assessment


