


 |
市場調查報告書
商品編碼
1842427
液位感測器:市場佔有率分析、行業趨勢、統計數據和成長預測(2025-2030 年)Level Sensor - Market Share Analysis, Industry Trends & Statistics, Growth Forecasts (2025 - 2030) |
||||||
※ 本網頁內容可能與最新版本有所差異。詳細情況請與我們聯繫。
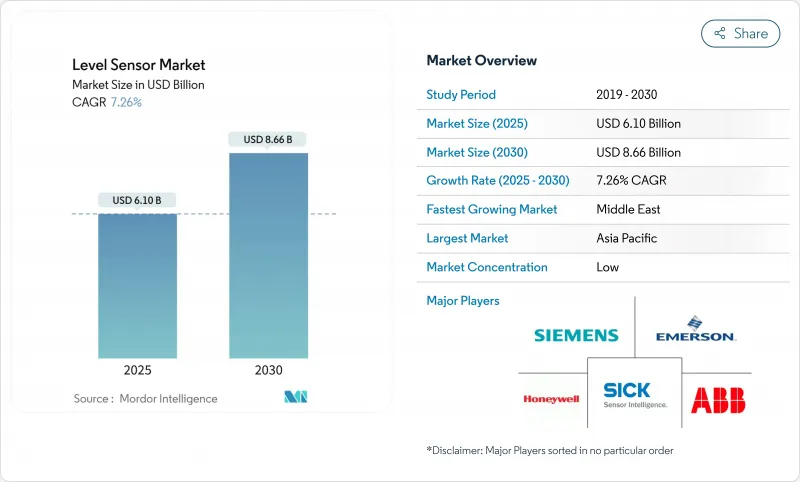
預計 2025 年液位感測器市場規模將達到 61 億美元,到 2030 年將達到 86.6 億美元,複合年成長率為 7.26%。
工業數位化專案、嚴格的全球安全法規以及高要求應用領域向高頻 80 GHz 雷達平台的快速轉變,正在推動雷達市場的成長。亞太地區公共部門在海水淡化和污水大型企劃上的強勁投入,正在加速對雷達的需求,而北美地區貿易交接升級則進一步鞏固了超高精度雷達設計的溢價。製造商也不斷拓展其產品組合,將支援物聯網的變送器和自我診斷功能融入其中,以支援預測性維護策略。隨著全球領導者透過收購和合作,將互補的感測、通訊和分析能力結合,以增強其產品組合,競爭也日益激烈。
全球液位感測器市場趨勢與洞察
數位化主導海灣合作理事會油庫自動化浪潮
沙烏地阿拉伯和阿拉伯聯合大公國在數位經濟領域的積極投入,推動了對聯網液位傳送器的需求,這些變送器可為即時庫存儀錶板和預測性維護模型提供數據,從而實現碼頭營運的現代化。 「願景2030」計畫正在將人工智慧和5G預算投入工業IoT,以實現液位數據與ERP和排放監測系統的無縫整合。隨著營運商從傳統浮式計過渡到SIL認證的雷達平台,擁有區域服務中心的供應商的訂單量高於平均水平。
海水淡化和污水大型企劃的快速擴張
亞太地區的膜法海水淡化生產線和先進的生物污水處理專案需要精確、耐腐蝕的液位感測技術來管理化學品注入和污泥處理過程。目前,各工廠正在採用人工智慧模組,利用連續液位數據進行能源最佳化,並擴大採用適用於高鹽度介質的雷達和超音波儀表。中東地區佔全球海水淡化產能的46%,該地區的同步投資將提振長期設備需求。
EMI 引起的鋼廠精度漂移
感應爐附近的高電磁場會扭曲電子液位訊號,導致昂貴的重新校準週期,並限制了雷達感測器在印度快速成長的鋼鐵業的應用。雖然供應商正在測試多層屏蔽和數位濾波技術,但價格敏感的營運商正在推遲升級,直到出現可靠且經濟實惠的解決方案。
報告中分析的其他促進因素和限制因素
- 歐洲化工園區液化天然氣強制進行SIL-3安全審核
- FSRU訂單燃料點需求
- 導波雷達在衛生應用的接受度較低
細分分析
到2024年,點式設備將佔據液位感測器市場佔有率的58%,尤其適用於溢流控制和空運轉保護措施。連續測量產品雖然出貨量較低,但隨著營運商追求即時庫存追蹤以降低營運成本和能耗,其年成長率達到8%。隨著支援分析的變送器的普及,預計到2030年,連續平台的液位感測器市場規模將超過30億美元。將開關功能和連續功能整合在一個機殼中的混合設備正在贏得空間受限的滑軌的青睞,並擴大了供應商的差異化。
80GHz雷達的普及正在推動水處理、化學和食品工廠持續採用該技術,以對抗泡沫、蒸汽和灰塵。整合診斷功能現在可以標記積聚物並提供預測性清潔提示,從而延長運作。隨著機器製造商逐步採用智慧感測器架構,將IO-Link和無線通訊協定整合到連續儀表中的供應商將獲得OEM設計的青睞。
2024年,接觸式技術將佔液位感測器總收入的64%,其中以靜水壓和磁致伸縮探頭為主導,因其機械結構簡單而備受青睞。然而,受食品、藥品和腐蝕性液體無污染測量需求的推動,非接觸式技術正以每年8.2%的速度成長。雷達和超音波技術可避免因零件接觸液體而導致的停機,而支援藍牙的設備則可透過行動應用程式試運行。非接觸式平台目前佔液位感測器市場規模的近三分之一,預計到2029年,其在高價值化工和能源計劃中的出貨量將超過接觸式平台。
雷達領域的進步最為顯著:FMCW 架構利用高達 80 GHz 的頻率,使窄波束能夠導航內部結構。供應商也在推動韌體改進,以消除攪拌槽中的虛假回波。超音波仍保持著發展勢頭,尤其是在成本敏感性高於性能的領域,例如市政水利計劃,但隨著雷達價格下降,其市場佔有率正在下降。
區域分析
受中國工業自動化普及以及印度和東南亞資本投資加速的推動,亞太地區將在2024年引領液位感測器市場,佔據45%的收益。僅純電動車價值鏈就需要數千個用於電解、漿料和溶劑罐的耐化學腐蝕雷達液位計。在日益都市化的地區,污水基礎設施對與主導控制迴路相關的連續感測器的訂單日益增多。投資本地生產和售後服務網路的供應商將在二線和三線城市獲得更大的市場佔有率。
中東是2025年至2030年複合年成長率最快的地區,將達9%。與「2030願景」和阿布達比國家石油公司下游計劃相關的油庫自動化項目,以及創紀錄的海水淡化產能成長,將維持對SIL級雷達和智慧點開關的多年需求。由於新的終端和管道需要庫存監控,印度-中歐經濟走廊等物流走廊的感測器訂單將增加。
在北美,儲罐和轉運罐的現代化升級仍在繼續,80GHz雷達技術的應用使其能夠進行對收益至關重要的體積計算。同時,頁岩相關的水處理作業正在採用能夠抵禦沉積物和碳氫化合物侵蝕的超音波設備和雷達設備。歐洲化工工業正在優先考慮SIL-3升級和永續性指標,這推動了對認證雷達設備和雲端診斷的需求。南美洲的採礦和紙漿業務將逐步擴張,但當地原始設備製造商在滿足國際SIL標準方面面臨成本障礙,導致目前採用速度緩慢。
其他福利
- Excel 格式的市場預測 (ME) 表
- 3個月的分析師支持
目錄
第1章 引言
- 調查結果
- 研究假設和市場定義
- 調查範圍
第2章調查方法
第3章執行摘要
第4章 市場狀況
- 市場概況
- 市場促進因素
- 數位化主導波灣合作理事會(GCC)油庫自動化浪潮
- 亞太地區海水淡化和污水大型企劃激增
- 歐洲化工工業強制實施SIL-3安全審核,推動雷達安裝
- 北美保管和轉運系統向 80GHz FMCW 雷達過渡
- 中國純電動車(BEV)電解產能投資
- LNG浮體式儲存和再氣化裝置 (FSRU)訂單加速點級需求
- 市場限制
- 鋼鐵廠電磁干擾引起的精度漂移限制了印度的採用
- 導波雷達在衛生製藥生產線的接受度較低(美國和歐盟 GMP)
- 80GHz 前端應用的 8 吋 GaAs MMIC 代工產能短缺。
- 南美小型原始設備製造商的SIL認證成本複雜
- 價值/供應鏈分析
- 監理展望
- ATEX 和 IECEx 危險區域更新
- 技術展望
- 支援人工智慧的自校準水平感測器
- 波特五力分析
- 新進入者的威脅
- 替代品的威脅
- 供應商的議價能力
- 買方的議價能力
- 競爭對手之間的競爭
第5章市場規模及成長預測(金額)
- 按監控類型
- 點液位感測器
- 機械/磁性浮子
- 電容
- 震動探頭
- 電導率
- 其他點感測器
- 連續液位感測器
- 雷射
- 超音波
- 磁致伸縮
- 雷達
- 其他連續感測器
- 點液位感測器
- 按技術(設備類型)
- 接觸式感應器
- 靜水壓型
- 磁致伸縮
- 導波雷達
- 非接觸式感測器
- 超音波
- 24 GHz雷達
- 80 GHz雷達
- 光學/紅外線
- 接觸式感應器
- 透過感測器技術
- 電容式
- 電導率
- 光學/光電
- 微波/雷達
- 超音波
- 振動叉
- 按組件
- 感測元件和探頭
- 發射器/轉換器
- 顯示和控制器
- 按檢測介質
- 液體
- 固體(散裝)
- 界面(油水等)
- 按最終用戶產業
- 石油和天然氣
- 上游
- 中下游
- 發電
- 火力
- 核能
- 採礦和金屬加工
- 化學
- 基礎化學品
- 特殊/精密化學
- 飲食
- 酪農
- 釀造
- 海水淡化
- 水和污水管理
- 製藥和生物過程
- 水泥、紙漿和造紙
- 石油和天然氣
- 按地區
- 北美洲
- 美國
- 加拿大
- 墨西哥
- 歐洲
- 德國
- 英國
- 法國
- 其他歐洲國家
- 亞太地區
- 中國
- 印度
- 日本
- 其他亞太地區
- 南美洲
- 巴西
- 阿根廷
- 其他南美
- 中東
- 海灣合作理事會國家
- 土耳其
- 其他中東地區
- 非洲
- 南非
- 奈及利亞
- 其他非洲國家
- 北美洲
第6章 競爭態勢
- 市場集中度
- 策略趨勢
- 市佔率分析
- 公司簡介
- ABB Ltd
- Emerson Electric Co.
- Honeywell International Inc.
- Siemens AG
- Endress+Hauser AG
- Sick AG
- VEGA Grieshaber KG
- KROHNE Group
- Baumer Group
- TE Connectivity Ltd
- First Sensor AG
- BinMaster Inc.
- AMETEK Inc.
- Pepperl+Fuchs SE
- Anton Paar GmbH
- Omega Engineering Inc.
- ifm electronic GmbH
- Yokogawa Electric Corp.
- Omron Corporation
- Rockwell Automation Inc.
- KOBOLD Messring GmbH
第7章 市場機會與未來展望
The level sensors market size is valued at USD 6.1 billion in 2025 and is forecast to reach USD 8.66 billion by 2030, advancing at a 7.26% CAGR.
Growth is propelled by industrial digitization programs, stringent global safety mandates, and the rapid shift to high-frequency 80 GHz radar platforms in demanding applications. Strong public-sector spending on desalination and wastewater megaprojects across Asia-Pacific is accelerating unit demand, while custody-transfer upgrades in North America reinforce premium pricing for ultra-high-accuracy radar designs. Manufacturers are also widening their product mix with IoT-ready transmitters and embedded self-diagnostics to align with predictive-maintenance strategies. Competitive intensity is rising as global leaders strengthen portfolios through acquisitions and alliances that combine complementary sensing, communications, and analytics capabilities.
Global Level Sensor Market Trends and Insights
Digitization-driven tank-farm automation surge in GCC
Aggressive digital-economy spending in Saudi Arabia and the UAE is modernizing terminal operations, elevating demand for networked level transmitters that feed real-time inventory dashboards and predictive-maintenance models. Vision 2030 programs funnel AI and 5G budgets toward industrial IoT, allowing level data to integrate seamlessly with ERP and emissions-monitoring systems. Suppliers with localized service hubs are seeing above-average order volumes as operators migrate from legacy float gauges to SIL-certified radar platforms.
Rapid build-out of desalination & wastewater megaprojects
Asia-Pacific capital plans for membrane desalination lines and advanced biological wastewater treatment require precise, corrosion-resistant level sensing to manage chemical dosing and sludge processes. Plants now embed AI modules that leverage continuous level data for energy optimization, lifting adoption of radar and ultrasonic instruments rated for high-salinity media. Parallel investments in the Middle East's 46% share of global desalination capacity reinforce long-term unit demand.
EMI-induced accuracy drift in steel mills
High electromagnetic fields near induction furnaces distort electronic level signals, driving costly recalibration cycles and limiting uptake of radar sensors in India's rapidly growing steel sector. Vendors are testing multilayer shielding and digital filtering, yet price-sensitive operators defer upgrades until robust, affordable solutions emerge.
Other drivers and restraints analyzed in the detailed report include:
- Mandatory SIL-3 safety audits in European chemical parks
- LNG FSRU orders accelerating point-level demand
- Low acceptance of guided-wave radar in hygienic applications
For complete list of drivers and restraints, kindly check the Table Of Contents.
Segment Analysis
Point devices dominated 2024 with a 58% level sensors market share, favored for binary control in overfill and dry-run safeguards. Continuous measurement products, though smaller in shipment volume, are growing 8% annually as operators pursue real-time inventory tracking to cut working capital and energy use. The level sensors market size for continuous platforms is projected to exceed USD 3 billion by 2030, alongside the adoption of analytics-ready transmitters. Hybrid instruments that fuse switching and continuous functions in a single housing are winning conversions in space-constrained skids, widening supplier differentiation.
The migration to 80 GHz radar is powering continuous segment uptake in water, chemical, and food plants that battle foam, vapor, and dust. Integrated diagnostics now flag buildup, offering predictive-cleaning prompts and elevating uptime. Suppliers that combine IO-Link or wireless protocols into continuous gauges capture OEM design wins as machine builders standardize on smart-sensor architectures.
Contact technologies retained 64% of 2024 revenue, anchored by hydrostatic and magnetostrictive probes valued for mechanical simplicity. Yet non-contact devices are expanding 8.2% each year, riding demand for contamination-free measurement in foods, pharmaceuticals, and corrosive liquids. Radar and ultrasonic models avoid downtime tied to wetted parts, and Bluetooth-enabled units ease commissioning via mobile apps. Non-contact platforms now represent nearly one-third of level sensors market size and are forecast to surpass contact shipments in high-value chemical and energy projects by 2029.
Radar progress is most visible: FMCW architectures leverage 80 GHz frequencies for narrow beams that navigate internal structures. Suppliers also push firmware advances that remove false echoes in agitator-equipped tanks. Ultrasonic retains traction where cost sensitivity tops performance, especially in municipal water projects, but its share edges lower as radar pricing falls.
Level Sensor Market is Segmented by Monitoring Type (Point Level Sensors and Continuous Level Sensors), Technology (Contant Sensors and Non-Contact Sensors), Sensor Technology (Capacitive, Conductive, Optical/Photoelectric and More), Component, Detection Medium, End-User Industry (Oil & Gas, Power Generation and More), Geography. The Market Forecasts are Provided in Terms of Value (USD).
Geography Analysis
Asia-Pacific led the level sensors market with 45% revenue in 2024, underpinned by extensive industrial automation in China and accelerating capital investment in India and Southeast Asia. Battery-electric vehicle value-chains alone require thousands of chemically resistant radar gauges for electrolyte, slurry, and solvent tanks. Regional wastewater infrastructure, buoyed by urbanization, fuels orders for continuous sensors tied to AI-driven control loops. Suppliers investing in localized manufacturing and aftersales networks deepen share across tier-2 and tier-3 cities.
The Middle East registers the fastest regional CAGR at 9% from 2025-2030. Tank-farm automation programs linked to Vision 2030 and ADNOC downstream projects, plus record desalination capacity additions, sustain multi-year demand for SIL-rated radar and smart point switches. Logistics corridors such as the India-Middle East-Europe Economic Corridor amplify sensor orders as new terminals and pipelines require inventory monitoring.
North America continues to modernize custody-transfer tanks with 80 GHz radar for revenue-critical volume calculations, while shale-related water-handling operations adopt ultrasonic and radar devices resistant to sediment and hydrocarbons. European chemical parks prioritize SIL-3 upgrades and sustainability metrics, boosting demand for certified radar units and cloud-enabled diagnostics. South American mining and pulp operations expand gradually, though local OEMs face cost hurdles meeting international SIL standards, moderating near-term penetration.
- ABB Ltd
- Emerson Electric Co.
- Honeywell International Inc.
- Siemens AG
- Endress + Hauser AG
- Sick AG
- VEGA Grieshaber KG
- KROHNE Group
- Baumer Group
- TE Connectivity Ltd
- First Sensor AG
- BinMaster Inc.
- AMETEK Inc.
- Pepperl + Fuchs SE
- Anton Paar GmbH
- Omega Engineering Inc.
- ifm electronic GmbH
- Yokogawa Electric Corp.
- Omron Corporation
- Rockwell Automation Inc.
- KOBOLD Messring GmbH
Additional Benefits:
- The market estimate (ME) sheet in Excel format
- 3 months of analyst support
TABLE OF CONTENTS
1 INTRODUCTION
- 1.1 Study Deliverables
- 1.2 Study Assumptions and Market Definition
- 1.3 Scope of the Study
2 RESEARCH METHODOLOGY
3 EXECUTIVE SUMMARY
4 MARKET LANDSCAPE
- 4.1 Market Overview
- 4.2 Market Drivers
- 4.2.1 Digitisation-driven Tank-Farm Automation Surge in Gulf Cooperation Council (GCC)
- 4.2.2 Rapid Build-out of Desalination and Waste-water Megaprojects Across Asia-Pacific
- 4.2.3 Mandatory SIL-3 Safety Audits in European Chemical Parks Boosting Radar Installations
- 4.2.4 Transition to 80 GHz FMCW Radar in North-American Custody-Transfer Systems
- 4.2.5 Battery-Electric Vehicle (BEV) Electrolyte Production Capacity Investments in China
- 4.2.6 LNG Floating Storage and Regasification (FSRU) Orders Accelerating Point-Level Demand
- 4.3 Market Restraints
- 4.3.1 EMI-Induced Accuracy Drift in Steel Mills Limiting Adoption in India
- 4.3.2 Low Acceptance of Guided-Wave Radar in Hygienic Pharma Lines (US and EU GMP)
- 4.3.3 Shortage of 8-inch GaAs MMIC Foundry Capacity for 80 GHz Front-ends
- 4.3.4 Complex SIL Certification Cost for Small OEMs in South America
- 4.4 Value / Supply-Chain Analysis
- 4.5 Regulatory Outlook
- 4.5.1 ATEX and IECEx Hazard-Zone Updates
- 4.6 Technological Outlook
- 4.6.1 AI-Enabled Self-Calibrating Level Sensors
- 4.7 Porter's Five Forces Analysis
- 4.7.1 Threat of New Entrants
- 4.7.2 Threat of Substitutes
- 4.7.3 Bargaining Power of Suppliers
- 4.7.4 Bargaining Power of Buyers
- 4.7.5 Competitive Rivalry
5 MARKET SIZE AND GROWTH FORECASTS (VALUE)
- 5.1 By Monitoring Type
- 5.1.1 Point Level Sensors
- 5.1.1.1 Mechanical and Magnetic Float
- 5.1.1.2 Capacitance
- 5.1.1.3 Vibratory Probe
- 5.1.1.4 Conductivity
- 5.1.1.5 Other Point Sensors
- 5.1.2 Continuous Level Sensors
- 5.1.2.1 Laser
- 5.1.2.2 Ultrasonic
- 5.1.2.3 Magnetostrictive
- 5.1.2.4 Radar
- 5.1.2.5 Other Continuous Sensors
- 5.1.1 Point Level Sensors
- 5.2 By Technology (Device Type)
- 5.2.1 Contact Sensors
- 5.2.1.1 Hydrostatic
- 5.2.1.2 Magnetostrictive
- 5.2.1.3 Guided-Wave Radar
- 5.2.2 Non-Contact Sensors
- 5.2.2.1 Ultrasonic
- 5.2.2.2 24 GHz Radar
- 5.2.2.3 80 GHz Radar
- 5.2.2.4 Optical/IR
- 5.2.1 Contact Sensors
- 5.3 By Sensor Technology
- 5.3.1 Capacitive
- 5.3.2 Conductive
- 5.3.3 Optical/Photoelectric
- 5.3.4 Microwave/Radar
- 5.3.5 Ultrasonic
- 5.3.6 Vibratory Fork
- 5.4 By Component
- 5.4.1 Sensing Element and Probe
- 5.4.2 Transmitter/Converter
- 5.4.3 Display and Controller
- 5.5 By Detection Medium
- 5.5.1 Liquids
- 5.5.2 Solids (Bulk)
- 5.5.3 Interface (Oil-Water, etc.)
- 5.6 By End-user Industry
- 5.6.1 Oil and Gas
- 5.6.1.1 Upstream
- 5.6.1.2 Mid/Downstream
- 5.6.2 Power Generation
- 5.6.2.1 Thermal
- 5.6.2.2 Nuclear
- 5.6.3 Mining and Metal Processing
- 5.6.4 Chemical
- 5.6.4.1 Basic Chemicals
- 5.6.4.2 Specialty and Fine Chemicals
- 5.6.5 Food and Beverage
- 5.6.5.1 Dairy
- 5.6.5.2 Brewery
- 5.6.5.3 Desalination
- 5.6.6 Water and Waste-water Management
- 5.6.7 Pharmaceuticals and Bioprocessing
- 5.6.8 Cement and Pulp and Paper
- 5.6.1 Oil and Gas
- 5.7 By Geography
- 5.7.1 North America
- 5.7.1.1 United States
- 5.7.1.2 Canada
- 5.7.1.3 Mexico
- 5.7.2 Europe
- 5.7.2.1 Germany
- 5.7.2.2 United Kingdom
- 5.7.2.3 France
- 5.7.2.4 Rest of Europe
- 5.7.3 Asia-Pacific
- 5.7.3.1 China
- 5.7.3.2 India
- 5.7.3.3 Japan
- 5.7.3.4 Rest of Asia-Pacific
- 5.7.4 South America
- 5.7.4.1 Brazil
- 5.7.4.2 Argentina
- 5.7.4.3 Rest of South America
- 5.7.5 Middle East
- 5.7.5.1 GCC Countries
- 5.7.5.2 Turkey
- 5.7.5.3 Rest of Middle East
- 5.7.6 Africa
- 5.7.6.1 South Africa
- 5.7.6.2 Nigeria
- 5.7.6.3 Rest of Africa
- 5.7.1 North America
6 COMPETITIVE LANDSCAPE
- 6.1 Market Concentration
- 6.2 Strategic Moves
- 6.3 Market Share Analysis
- 6.4 Company Profiles (includes Global level Overview, Market level overview, Core Segments, Financials as available, Strategic Information, Market Rank/Share, Products and Services, and Recent Developments)
- 6.4.1 ABB Ltd
- 6.4.2 Emerson Electric Co.
- 6.4.3 Honeywell International Inc.
- 6.4.4 Siemens AG
- 6.4.5 Endress + Hauser AG
- 6.4.6 Sick AG
- 6.4.7 VEGA Grieshaber KG
- 6.4.8 KROHNE Group
- 6.4.9 Baumer Group
- 6.4.10 TE Connectivity Ltd
- 6.4.11 First Sensor AG
- 6.4.12 BinMaster Inc.
- 6.4.13 AMETEK Inc.
- 6.4.14 Pepperl + Fuchs SE
- 6.4.15 Anton Paar GmbH
- 6.4.16 Omega Engineering Inc.
- 6.4.17 ifm electronic GmbH
- 6.4.18 Yokogawa Electric Corp.
- 6.4.19 Omron Corporation
- 6.4.20 Rockwell Automation Inc.
- 6.4.21 KOBOLD Messring GmbH
7 MARKET OPPORTUNITIES AND FUTURE OUTLOOK
- 7.1 White-Space and Unmet-Need Assessment
 污泥濃度感測器市場(按感測器類型、最終用戶產業、應用、安裝類型和銷售管道),全球預測,2026-2032年廢棄物容器液位感測器市場:按容器類型、通訊技術、感測器技術、安裝類型、產品/服務、部署類型、應用和最終用戶分類-全球預測,2026-2032年
 液位感測器市場分析及預測(至2035年):依類型、技術、應用、組件、產品、最終用戶、安裝類型、設備、製程及功能分類
 全球液位感測器市場:市場規模、佔有率、成長率、產業分析、依類型、應用和地區劃分的分析以及未來預測(2026-2034)光學燃油液位感測器市場:按感測器類型、安裝方式、感測器輸出、應用和最終用戶分類,全球預測(2026-2032年)噴射式液位感測器市場按產品類型、安裝類型、最終用途產業和銷售管道,全球預測(2026-2032年)按感測器類型、性別、輸出訊號、應用和最終用戶產業分類的稱重感測器市場—2026-2032年全球預測液位檢測感測器市場按技術、測量類型、安裝類型、通訊模式和最終用途分類,全球預測(2026-2032年)管道液位感測器市場按產品類型、通訊協定、安裝方式、電源、輸出類型、感測器配置和最終用戶分類-2026-2032年全球預測電磁液位感測器市場按類型、安裝方式、輸出功率、測量範圍和最終用戶產業分類,全球預測(2026-2032年)