


 |
市場調查報告書
商品編碼
1836676
交通感測器:市場佔有率分析、行業趨勢、統計數據和成長預測(2025-2030 年)Traffic Sensors - Market Share Analysis, Industry Trends & Statistics, Growth Forecasts (2025 - 2030) |
||||||
※ 本網頁內容可能與最新版本有所差異。詳細情況請與我們聯繫。
預計2025年交通感測器市場規模將達7.2億美元,2030年將擴大至10.8億美元。
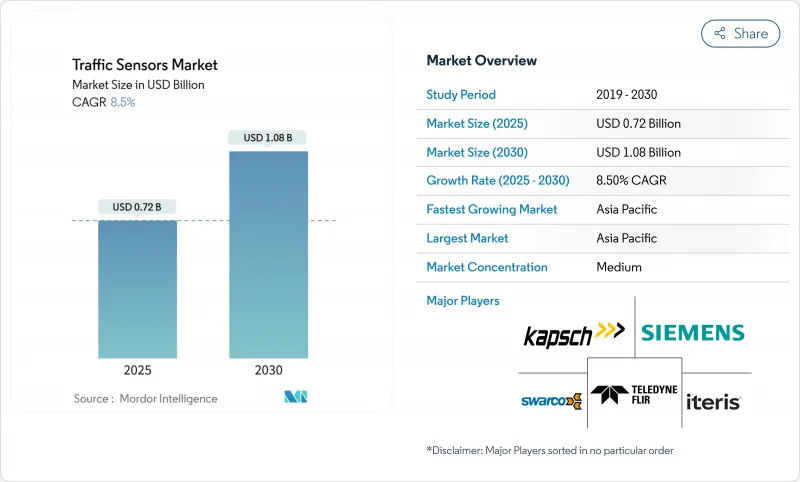
隨著城市擴展智慧交通系統以緩解交通堵塞並減少排放,以及國家機構獲得多年期資金用於支援感測器的基礎設施建設,需求將持續成長。邊緣人工智慧和5G連線也正在將競爭焦點從獨立硬體轉移到資料豐富、可升級的平台。受中國和日本大規模智慧城市試點的推動,亞太地區在應用方面處於領先地位,而北美則優先考慮可最大程度減少車道封閉的維修。能夠整合非侵入式偵測、預測分析和開放標準通訊的供應商擁有最廣泛的可尋址客戶群,尤其是在政府尋求將行人和微型行動裝置納入多模態覆蓋範圍的情況下。
全球交通感測器市場趨勢與洞察
都市化與交通擁擠的壓力
紐約大都會區交通堵塞每年對該市造成200億美元的損失,促使其廣泛部署感測器,以減少高達25%的旅行時間和高達20%的二氧化碳排放。 34億美元的聯邦公路安全改進基金正在將感測器納入道路改善中,以減少死亡。中國約800個智慧城市試點計畫將進一步加速在車輛、行人和微出行工具上的部署,從而將交通感測器市場擴展到道路車輛以外的領域。
智慧城市和ITS資金激增
到2024年,USD SMART Grants計畫將向34個計劃撥款5,000萬美元,為感測器密集型交叉路口和邊緣伺服器的建設開創先例。 「地平線歐洲」計畫累計2.54億歐元(約2.76億美元),用於強制要求互通感測的數位交通基礎建設。亞歷山大市耗資500萬美元的智慧運輸計畫等城市級舉措表明,資金籌措正迅速流向市政採購。
前期投資高
ITS America 估計,在美國為 25 萬個交叉路口配備 V2X 技術將需要 65 億美元,此外,鋪設道路、人工和維護成本也增加了負擔。新興經濟體面臨資金缺口,導致低成本無線節點(例如奧克拉荷馬州40 美元的原型)的部署速度放緩。羅德島州 275.9 萬美元的橋樑監控合約等合約凸顯了巨大的資本投入,即使是單一資產也需要如此龐大的資本投入。
報告中分析的其他促進因素和限制因素
- 強制收費和堵塞收費提供即時數據
- 邊緣 AI 低功耗、非侵入式感測器
- 資料隱私和網路安全合規成本
細分分析
雖然感應線圈在2024年仍將維持38%的交通感測器市場佔有率,但雷射雷達12.2%的複合年成長率顯示市場正向非侵入式高解析度測繪轉變。隨著越來越多的營運商尋求整合車輛分類和行人安全,預計與LiDAR解決方案配套的交通感測器市場規模將超過感應線圈。 Seyond的系統擁有99%的車輛辨識準確率和92%的行人辨識率,超越了基於感應線圈的替代方案。雷達和熱感成像技術在惡劣天氣條件下可作為LiDAR的補充,而壓電陣列對於運動測量至關重要。具有組合模式的邊緣就緒感測器能夠以更低的生命週期成本收集更豐富的數據,這是聯邦政府SMART指南的重點。
組件價格下降、尺寸縮小以及車規級可靠性支撐了雷射雷達的上升曲線。傳統的環形感測器難以應對路面磨損和車道增設,而且無法探測自行車,因此不適用於多模態電網。由於成本和空間限制,紅外線和地磁感測器的應用空間有限。一個多元化的供應商生態系統正在興起,但整合能力是關鍵因素,因為各機構更傾向於提供承包分析服務,而非提供原始數據。
由於傳統環形交叉路口號誌燈占主導地位,到2024年,侵入式安裝將占到總收入的54%,攜帶式感測器的複合年成長率將達到12.0%。交通感測器市場越來越青睞太陽能裝置,因為它們可以快速安裝,避免車道關閉和瀝青路面割裂。奧克拉荷馬州州40美元的無線節點即使在資金緊張的地區也具有成本競爭力。可攜式LiDAR套件現在支援施工區域的情境察覺,使承包商更容易履行安全義務。
交通管理人員優先考慮靈活地調整感測器,以適應施工階段、事件和臨時公車道。非侵入式過載裝置可覆蓋並診斷多條車道,且不會干擾路面的完整性。長期環路維修則轉向使用雷達和攝影機組合,以提高資料保真度並縮短使用壽命。
區域分析
2024年,亞太地區將貢獻35%的收入,到2030年,複合年成長率將達到12.1%。中國製造2025計畫下的智慧城市試點計畫將繼續推動城市基礎設施預算朝向人工智慧感測方向發展。日本先進交通系統部門的目標是到2033年,為交通部批准的交通流量預測和可視化整合計劃投入72.39億美元。印度耗資1.4兆美元的國家基礎設施管道項目表明,對多模態物流監控的需求日益成長。
儘管已擁有成熟的安裝基礎,北美仍在持續投資於改造升級。在紐約,每年1億美元的SMART撥款和堵塞收費正在刺激邊緣運算技術的替換。為了最大程度地減少車道關閉,採購工作傾向於選擇適合改造的非侵入式感測器。加拿大正在透過聯邦和省級政府分攤成本的方式實現走廊管理的現代化,而墨西哥則專注於與USMCA貿易流量相關的貨運走廊。
歐洲正在將感測器計劃與脫碳目標結合。 「地平線歐洲」和耗資10億歐元的「互聯、合作與自動化出行」計畫正在資助多模態感測互通性。德國和英國正在投資鐵路和公路基礎設施,其中融入適用於未來自動駕駛的下一代感測器。中東和非洲正在與旗艦智慧城市計劃相結合,進行選擇性部署;而石油出口國則正在資助收費和動態稱重網路,以保護重載走廊。
其他福利:
- Excel 格式的市場預測 (ME) 表
- 3個月的分析師支持
目錄
第1章 引言
- 研究假設和市場定義
- 調查範圍
第2章調查方法
第3章執行摘要
第4章 市場狀況
- 市場概況
- 市場促進因素
- 都市化與交通壅塞壓力
- 智慧城市和智慧交通系統(ITS)資金激增
- 強制使用即時數據來收取通行費並緩解交通堵塞
- 與電氣化相關的電網感知交通管理
- 邊緣 AI 低功耗、非侵入式感測器
- 多模態微移動感測標準
- 市場限制
- 前期投資成本高
- 資料隱私和網路安全合規的成本
- 氣候(高溫和鹽度)導致的感測器劣化
- 通訊協定碎片化阻礙互通性
- 價值/供應鏈分析
- 監管狀況
- 技術展望
- 波特五力模型
- 新進入者的威脅
- 買方的議價能力
- 供應商的議價能力
- 替代品的威脅
- 競爭對手之間的競爭
第5章 市場規模及成長預測(金額)
- 依感測器類型
- 感應迴路
- 壓電
- 彎板
- 磁力儀
- 圖片/影片
- 基於雷達
- 紅外線的
- LiDAR
- 依安裝方式
- 侵入型(道路內)
- 非侵入式(道路上/路邊)
- 可攜式/臨時
- 按用途
- 交通監控與交通流最佳化
- 體重測量
- 車輛分類與分析
- 自動動態收費
- 事件偵測與安全分析
- 按安裝位置
- 城市交叉口
- 高速公路
- 橋樑和隧道
- 停車設施
- 按最終用戶部門
- 政府和道路機構
- 收費公路業者/PPP特許經營
- 智慧城市解決方案整合商
- 物流和車隊營運商
- 依連接技術
- 有線(CAN、乙太網路)
- 無線(DSRC/C-V2X)
- 蜂巢式物聯網(NB-IoT/LTE-M/5G)
- 低功耗廣域網路 (LoRa/Sigfox)
- 按地區
- 北美洲
- 美國
- 加拿大
- 墨西哥
- 南美洲
- 巴西
- 阿根廷
- 其他南美
- 歐洲
- 德國
- 英國
- 法國
- 西班牙
- 義大利
- 其他歐洲國家
- APAC
- 中國
- 日本
- 印度
- 澳洲
- 亞太地區其他國家
- 中東和非洲
- GCC
- 南非
- 其他中東和非洲地區
- 北美洲
第6章 競爭態勢
- 策略趨勢
- 市佔率分析
- 公司簡介
- Kapsch TrafficCom AG
- Siemens AG
- FLIR(Teledyne)
- Iteris Inc.
- Q-Free ASA
- SWARCO AG
- International Road Dynamics
- Sensys Networks Inc.
- Kistler Group
- Bosch Security & Safety Systems
- Axis Communications
- Smartmicro GmbH
- SICK AG
- EFKON GmbH
- Citilog(Swarco)
- Raytheon Technologies
- Sensata Technologies
- LeddarTech Inc.
- IHI Corporation
- Acyclica(FLIR)
第7章 市場機會與未來展望
The traffic sensors market size reached USD 0.72 billion in 2025 and is on course to expand to USD 1.08 billion by 2030, reflecting an 8.50% CAGR.
Demand rises as cities scale intelligent transportation systems to relieve congestion and cut emissions, and as national agencies lock in multi-year funding for sensor-enabled infrastructure. Statutory real-time data requirements for congestion pricing, dynamic tolling and safety programs anchor new procurement cycles, while edge-AI and 5G connectivity shift the competitive focus from stand-alone hardware to data-rich, upgrade-ready platforms. Asia-Pacific leads adoption on the back of China's and Japan's large-scale smart-city pilots, whereas North America prioritizes retrofits that minimize lane closures. Vendors able to bundle non-intrusive detection, predictive analytics and open-standards communications secure the widest addressable base, especially as governments press for multi-modal coverage that includes pedestrians and micromobility devices.
Global Traffic Sensors Market Trends and Insights
Urbanisation & Congestion Pressure
Metropolitan congestion costs New York USD 20 billion each year, prompting large-scale sensor roll-outs that shorten travel times by as much as 25% and trim CO2 output up to 20% trafficmobilityreviewboard. Federal Highway Safety Improvement funds of USD 3.4 billion embed detection into roadway upgrades to cut fatalities. China's nearly 800 smart-city pilots further accelerate deployments that span vehicles, pedestrians and micromobility users, broadening the traffic sensors market beyond road vehicles alone
Smart-City & ITS Funding Surge
The USD SMART Grants program disbursed USD 50 million across 34 projects in 2024, setting precedents for sensor-rich intersections and edge servers .Horizon Europe earmarked EUR 254 million (USD 276 million) to digital transport infrastructure that mandates interoperable detection. City-level initiatives, such as Alexandria's USD 5 million smart-mobility plan, confirm that funding is cascading rapidly to municipal procurement
High Up-Front Deployment CAPEX
ITS America estimates USD 6.5 billion is needed to equip 250,000 U.S. intersections with V2X technology, a burden intensified by paving, labor and maintenance costs . Developing economies face financing gaps that delay roll-outs, although low-cost wireless nodes such as Oklahoma's USD 40 prototype ease entry barriers Contracts like Rhode Island's USD 2.759 million bridge monitoring deal highlight the sizable capital commitment even for individual assets
Other drivers and restraints analyzed in the detailed report include:
- Mandated Real-Time Data for Tolling & Congestion Pricing
- Edge-AI Low-Power Non-Intrusive Sensors
- Data-Privacy & Cyber-Security Compliance Costs
For complete list of drivers and restraints, kindly check the Table Of Contents.
Segment Analysis
Inductive loops retained 38% traffic sensors market share in 2024, yet LiDAR's 12.2% CAGR signals a pivot to non-intrusive, high-resolution mapping. The traffic sensors market size attached to LiDAR solutions is projected to outpace loops as operators seek vehicle classification and pedestrian safety in one package. Seyond's system posts 99% vehicle accuracy and 92% pedestrian recognition, outperforming loop-based alternatives simpl.. Radar and thermal imaging complement LiDAR in adverse weather, while piezoelectric arrays remain vital for weigh-in-motion. Edge-ready sensors that combine modalities collect richer data with lower lifecycle cost, a priority under federal SMART guidance
LiDAR's upward curve is reinforced by falling component prices, smaller form factors and automotive-grade reliability. Traditional loops struggle with pavement wear and lane additions, and their inability to detect cyclists limits suitability for multimodal grids. Infrared and magnetometer solutions hold niche roles where cost or site constraints dictate. A diverse supplier ecosystem is emerging, yet integration skill remains a differentiator as agencies favor turnkey analytics over raw feed delivery.
Intrusive installs made up 54% revenue in 2024 as legacy loops dominate signalized junctions, but portable sensors are forecast for 12.0% CAGR. The traffic sensors market increasingly rewards quick-deploy, solar-powered units that avoid lane closures and asphalt cutting. Oklahoma's USD 40 wireless node underscores cost competitiveness even for cash-constrained districts. Portable LiDAR kits now underpin work-zone situational awareness, easing contractor compliance with safety mandates.
Traffic managers prioritize flexibility to realign sensors with construction phases, events or pop-up bus lanes. Non-intrusive over-road gear delivers multi-lane coverage and diagnostics without disturbing pavement integrity. Long-term, loop retrofits shift toward radar-camera combos delivering higher data fidelity and lower lifetime spend.
The Traffic Sensor Market is Segmented by Sensor Type (Inductive Loop, and More), Application ( Weigh in Motion and More), Installation Method (Intrusive (In-Road) and More), Deployment Location (Urban Intersections and More), End-Use Sector (Government and Road Agencies and More), Connectivity Technology (Wired and More) and by Geography. The Market Forecasts are Provided in Terms of Value (USD).
Geography Analysis
Asia-Pacific generated 35% 2024 revenue and posts a 12.1% CAGR through 2030. China's smart-city pilots, anchored in the Made in China 2025 program, keep urban infrastructure budgets flowing toward AI-enabled detection. Japan's advanced traffic systems sector targets USD 7.239 billion by 2033 as Ministry-approved projects integrate flow prediction and visualization. India's USD 1.4 trillion National Infrastructure Pipeline underlines rising demand for multimodal logistics monitoring .
North America commands mature install bases yet continues to invest in retrofit upgrades. USD 100 million annual SMART allocations and congestion pricing in New York spur edge-ready replacements. Retrofit-friendly, non-intrusive sensors dominate procurements that must minimize lane closures. Canada modernizes corridor management through federal-provincial cost sharing, whereas Mexico focuses on freight corridors linked to USMCA trade flows.
Europe links sensor projects to decarbonization targets. Horizon Europe and the EUR 1 billion Connected, Cooperative and Automated Mobility program fund multi-modal detection interoperability. Germany and the UK channel funds into rail and high-speed roadways that embed next-gen sensors suitable for future autonomous deployment. Middle East and Africa exhibit selective adoption tied to flagship smart-city schemes, though oil-exporting states fund toll and weigh-in-motion networks to safeguard heavy-load corridors.
- Kapsch TrafficCom AG
- Siemens AG
- FLIR (Teledyne)
- Iteris Inc.
- Q-Free ASA
- SWARCO AG
- International Road Dynamics
- Sensys Networks Inc.
- Kistler Group
- Bosch Security & Safety Systems
- Axis Communications
- Smartmicro GmbH
- SICK AG
- EFKON GmbH
- Citilog (Swarco)
- Raytheon Technologies
- Sensata Technologies
- LeddarTech Inc.
- IHI Corporation
- Acyclica (FLIR)
Additional Benefits:
- The market estimate (ME) sheet in Excel format
- 3 months of analyst support
TABLE OF CONTENTS
1 INTRODUCTION
- 1.1 Study Assumptions and Market Definition
- 1.2 Scope of the Study
2 RESEARCH METHODOLOGY
3 EXECUTIVE SUMMARY
4 MARKET LANDSCAPE
- 4.1 Market Overview
- 4.2 Market Drivers
- 4.2.1 Urbanisation and Congestion Pressure
- 4.2.2 Smart-City and ITS Funding Surge
- 4.2.3 Mandated Real-Time Data for Tolling and Congestion Pricing
- 4.2.4 Electrification-Linked Grid-Aware Traffic Management
- 4.2.5 Edge-AI Low-Power Non-Intrusive Sensors
- 4.2.6 Multimodal Micromobility Detection Standards
- 4.3 Market Restraints
- 4.3.1 High Up-Front Deployment CAPEX
- 4.3.2 Data-Privacy & Cyber-Security Compliance Costs
- 4.3.3 Climate-Driven Sensor Degradation (Heat and Salinity)
- 4.3.4 Fragmented Protocols Hindering Interoperability
- 4.4 Value / Supply-Chain Analysis
- 4.5 Regulatory Landscape
- 4.6 Technological Outlook
- 4.7 Porters Five Forces
- 4.7.1 Threat of New Entrants
- 4.7.2 Bargaining Power of Buyers
- 4.7.3 Bargaining Power of Suppliers
- 4.7.4 Threat of Substitutes
- 4.7.5 Competitive Rivalry
5 MARKET SIZE & GROWTH FORECASTS (VALUE)
- 5.1 By Sensor Type
- 5.1.1 Inductive Loop
- 5.1.2 Piezoelectric
- 5.1.3 Bending Plate
- 5.1.4 Magnetometer
- 5.1.5 Image / Video
- 5.1.6 Radar-Based
- 5.1.7 Infrared
- 5.1.8 LiDAR
- 5.2 By Installation Method
- 5.2.1 Intrusive (In-Road)
- 5.2.2 Non-Intrusive (Over-Road / Roadside)
- 5.2.3 Portable / Temporary
- 5.3 By Application
- 5.3.1 Traffic Monitoring and Flow Optimisation
- 5.3.2 Weigh-In-Motion
- 5.3.3 Vehicle Classification and Profiling
- 5.3.4 Automated and Dynamic Tolling
- 5.3.5 Incident Detection and Safety Analytics
- 5.4 By Deployment Location
- 5.4.1 Urban Intersections
- 5.4.2 Highways and Expressways
- 5.4.3 Bridges and Tunnels
- 5.4.4 Parking Facilities
- 5.5 By End-Use Sector
- 5.5.1 Government and Road Agencies
- 5.5.2 Toll Operators / PPP Concessions
- 5.5.3 Smart-City Solution Integrators
- 5.5.4 Logistics and Fleet Operators
- 5.6 By Connectivity Technology
- 5.6.1 Wired (CAN, Ethernet)
- 5.6.2 Wireless (DSRC / C-V2X)
- 5.6.3 Cellular-IoT (NB-IoT / LTE-M / 5G)
- 5.6.4 LPWAN (LoRa / Sigfox)
- 5.7 By Geography
- 5.7.1 North America
- 5.7.1.1 United States
- 5.7.1.2 Canada
- 5.7.1.3 Mexico
- 5.7.2 South America
- 5.7.2.1 Brazil
- 5.7.2.2 Argentina
- 5.7.2.3 Rest of South America
- 5.7.3 Europe
- 5.7.3.1 Germany
- 5.7.3.2 United Kingdom
- 5.7.3.3 France
- 5.7.3.4 Spain
- 5.7.3.5 Italy
- 5.7.3.6 Rest of Europe
- 5.7.4 APAC
- 5.7.4.1 China
- 5.7.4.2 Japan
- 5.7.4.3 India
- 5.7.4.4 Australia
- 5.7.4.5 Rest of APAC
- 5.7.5 Middle East and Africa
- 5.7.5.1 GCC
- 5.7.5.2 South Africa
- 5.7.5.3 Rest of Middle East and Africa
- 5.7.1 North America
6 COMPETITIVE LANDSCAPE
- 6.1 Strategic Moves
- 6.2 Market Share Analysis
- 6.3 Company Profiles (includes Global level Overview, Market level overview, Core Segments, Financials as available, Strategic Information, Market Rank/Share for key companies, Products & Services, and Recent Developments)
- 6.3.1 Kapsch TrafficCom AG
- 6.3.2 Siemens AG
- 6.3.3 FLIR (Teledyne)
- 6.3.4 Iteris Inc.
- 6.3.5 Q-Free ASA
- 6.3.6 SWARCO AG
- 6.3.7 International Road Dynamics
- 6.3.8 Sensys Networks Inc.
- 6.3.9 Kistler Group
- 6.3.10 Bosch Security & Safety Systems
- 6.3.11 Axis Communications
- 6.3.12 Smartmicro GmbH
- 6.3.13 SICK AG
- 6.3.14 EFKON GmbH
- 6.3.15 Citilog (Swarco)
- 6.3.16 Raytheon Technologies
- 6.3.17 Sensata Technologies
- 6.3.18 LeddarTech Inc.
- 6.3.19 IHI Corporation
- 6.3.20 Acyclica (FLIR)
7 MARKET OPPORTUNITIES AND FUTURE OUTLOOK
- 7.1 White-Space and Unmet-Need Assessment


