


 |
市場調查報告書
商品編碼
1836642
綠色和生物基溶劑:市場佔有率分析、行業趨勢、統計數據和成長預測(2025-2030)Green And Bio-based Solvents - Market Share Analysis, Industry Trends & Statistics, Growth Forecasts (2025 - 2030) |
||||||
※ 本網頁內容可能與最新版本有所差異。詳細情況請與我們聯繫。
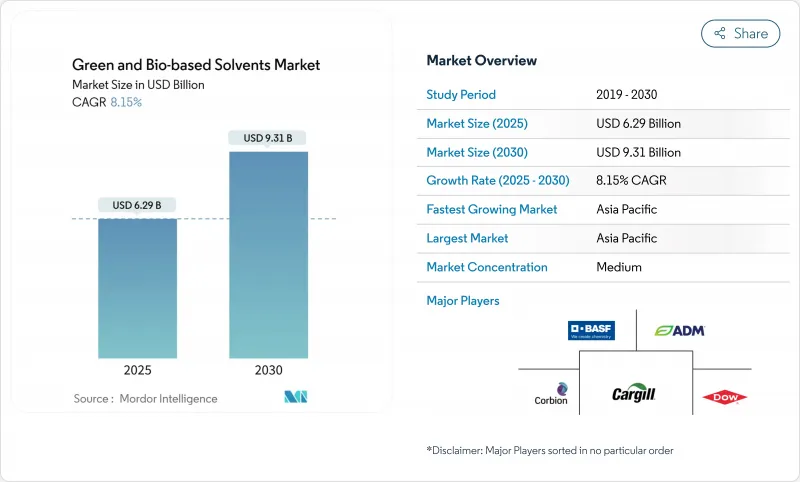
預計 2025 年綠色和生物基溶劑市場規模為 62.9 億美元,到 2030 年將達到 93.1 億美元,預測期內(2025-2030 年)的複合年成長率為 8.15%。
揮發性有機化合物(VOC)排放法規的收緊、原油價格的波動以及企業廣泛的永續性目標,正在促使用戶逐漸放棄石油基溶劑。可再生原料的不斷成長降低了長期供應風險,稅額扣抵也推動了需求的成長。由於中國和印度的工業快速成長和雄心勃勃的綠色化學政策的交匯,亞太地區對新增產能的影響力最大。
全球綠色和生物基溶劑市場趨勢和見解
嚴格的VOC排放法規
監管機構正在加強對被覆劑、黏合劑和消費品中溶劑的限制。加拿大2024年的法規涵蓋130個產品類別,加上歐盟限制持久性和危險物質的REACH更新,迫使配方設計師重新設計其產品線。替代方案有利於生物醇和酯類,它們符合相同的性能規格,且不違反新的VOC法規。歐盟的《化學品永續性戰略》正在擴大危險物質限制的範圍,進一步強化了這個政策趨勢。
原油價格波動刺激生物替代品的成長
2024年,原油價格多次以兩位數成長,縮小了生物溶劑與石油基溶劑之間的成本差距。許多買家對此作出回應,制定了雙重採購條款,當原油價格超過預設閾值時,自動切換到替代來源。美國廢油進口量加倍,證明即使在原油價格下跌的情況下,低碳廢棄物原料也能維持價格優勢。價格對沖策略降低了營運資金波動,使長期生物溶劑合約對採購經理更具吸引力。供應商從中得到的教訓顯而易見:成本競爭力如今不僅取決於絕對生產成本,也同樣取決於對原料價差風險的管理。
生產成本上升
發酵反應器、昂貴的淨化步驟以及較低的工廠運轉率,使得生物溶劑的成本曲線與傳統石油基溶劑相比處於不利地位。近期的製程現代化已將生物丙二醇的轉換成本降低了25%,但在獎勵機制較為寬鬆的地區之外,這一差距仍然很大。許多製造商正在尋求將生物溶劑與更高價值的產品結合,將固定成本分攤到多個收益來源中,從而實現經濟效益。還有一些製造商正在設計直接替代型分子,使客戶無需重新設計下游工藝,從而降低總轉換成本。在棕地石化資產轉化取得進展之前,綠色和生物基溶劑市場將面臨選擇性價格阻力,尤其是在商品化應用領域。
報告中分析的其他促進因素和限制因素
- 企業 ESG 承諾與綠色採購要求
- 增加政府激勵措施和稅額扣抵
- 原物料供應和農產品價格的波動;
細分分析
2024年,生物酒精將成為最大的收益來源,佔綠色和生物基溶劑市場的37.2%。成熟的乙醇發酵槽、廣泛的農業原料供應以及靈活的下游調配生產線支撐了這一地位。乳酸乙酯的複合年成長率為9.56%,凸顯了其向利基分子轉型的趨勢,該分子具有優異的溶解性和生物分解性,在藥物合成和電子級清潔領域備受推崇。
區域分析
亞太地區將引領綠色和生物基溶劑市場,2024 年的營收佔有率將達到 45.2%,到 2030 年的最高複合年成長率將達到 8.77%。中國的雙碳戰略迫使煉油廠和下游樹脂製造商抑制 VOC 排放,直接吸引人們使用可再生溶劑。
北美受益於聯邦和州嚴格的空氣品質法規以及成熟的生質燃料基礎設施。歐洲則以其雄心勃勃的政策脫穎而出: 《綠色新政》、《循環經濟行動計畫》和國家塑膠稅均支持可再生溶劑。
南美和非洲雖然收益仍然較小,但由於其原料供應廉價且環保意識日益增強,具有長期價值。然而,產能擴張依賴於監管的清晰度和基礎設施的升級,而這兩個地區都落後於領先地區。
其他福利:
- Excel 格式的市場預測 (ME) 表
- 3個月的分析師支持
目錄
第1章 引言
- 研究假設和市場定義
- 調查範圍
第2章調查方法
第3章執行摘要
第4章 市場狀況
- 市場概況
- 市場促進因素
- 嚴格的VOC排放法規
- 原油價格波動推動生質燃料
- 企業 ESG 承諾與綠色採購要求
- 增加政府對生化產品的誘因和稅額扣抵
- 可再生原料的全球擴張
- 市場限制
- 生產成本上升
- 原物料供應不穩定,農產品價格波動
- 與傳統溶劑回收設備的兼容性有限
- 價值鏈分析
- 技術展望
- 專利分析
- 五力分析
- 供應商的議價能力
- 買方的議價能力
- 新進入者的威脅
- 替代品的威脅
- 競爭程度
第5章 市場規模及成長預測(金額)
- 按類型
- 生物酒精
- 生質乙醇
- 生物甲醇
- 生物丙醇
- 生物丁醇
- 生物乙二醇
- 生物丙二醇
- 生物乙二醇
- 生物二醇
- 乳酸乙酯
- D-檸檬烯
- 大豆油甲酯
- 其他類型
- 生物酒精
- 按用途
- 油漆和塗料
- 工業和家庭清潔
- 印刷油墨
- 黏合劑和密封劑
- 製藥
- 化妝品和個人護理
- 農業
- 其他用途
- 按最終用戶產業
- 車
- 建造
- 製藥和醫療保健
- 飲食
- 消費品
- 農業
- 電子產品
- 其他
- 按地區
- 亞太地區
- 中國
- 印度
- 日本
- 韓國
- 亞太地區其他國家
- 北美洲
- 美國
- 加拿大
- 墨西哥
- 歐洲
- 德國
- 英國
- 法國
- 義大利
- 其他歐洲國家
- 南美洲
- 巴西
- 阿根廷
- 其他南美
- 中東和非洲
- 沙烏地阿拉伯
- 南非
- 其他中東和非洲地區
- 亞太地區
第6章 競爭態勢
- 市場集中度
- 策略趨勢
- 市佔率分析
- 公司簡介
- ADM
- BASF
- Bio Brands LLC
- Bioeutectics
- Braskem
- Cargill, Incorporated
- Corbion
- Covation Biomaterials
- Dow
- Elevance Renewable Sciences Inc.
- Florachem Corp.
- Florida Chemical Company
- Galactic
- Gevo
- GFBIOCHEMICALS
- LyondellBasell Industries Holdings BV
- Merck
- Peter Cremer Holding GmbH & Co. KG
- Sekab
- Solvay
- Vertec BioSolvents Inc.
第7章 市場機會與未來展望
The Green And Bio-based Solvents Market size is estimated at USD 6.29 billion in 2025, and is expected to reach USD 9.31 billion by 2030, at a CAGR of 8.15% during the forecast period (2025-2030).
Tightening VOC-emission rules, crude-oil price swings, and broad corporate sustainability targets are pushing users to switch away from petroleum-based solvents. Demand also gains from a widening pool of renewable feedstocks that lowers long-term supply risk and from expanding tax credits that offset part of the still-higher production costs. Asia Pacific supplies the strongest pull on new volumes because rapid industrial growth intersects with ambitious green-chemistry policies in China and India.
Global Green And Bio-based Solvents Market Trends and Insights
Stringent VOC-emission Regulations
Regulatory agencies are tightening solvent rules across coatings, adhesives, and consumer products. Canada's 2024 limits cover 130 product classes and pair with EU REACH updates that restrict persistent and toxic substances, forcing formulators to redesign product lines. Replacement programs favor bio-alcohols and esters that meet the same performance specs without breaching new VOC caps. The policy tilt is reinforced by the EU Chemicals Strategy for Sustainability, which is widening the scope of hazardous-substance restrictions.
Volatility in Crude-oil Prices Fueling Bio-alternatives
Crude benchmarks jumped by double-digit percentages several times in 2024, narrowing the cost gap between bio-solvents and petro-solvents. Many buyers responded by writing dual-sourcing clauses that trigger automatic substitution when oil surpasses pre-set thresholds. Waste-oil imports into the United States doubled, proving that low-carbon waste feedstocks can hold price advantages even when crude oil eases. Price-hedge strategies reduce working-capital swings, making long-term contracts for bio-solvents more attractive to purchasing managers. The lesson for suppliers is clear: cost competitiveness now depends as much on managing feedstock spread risk as on absolute production costs.
Higher Production Costs
Fermentation reactors, costly purification steps, and lower plant utilization rates still give bio-solvents an unfavorable cost curve versus entrenched petro-equivalents. Recent process modernization trimmed bio-propylene glycol conversion costs by 25%, but the gap remains material outside incentive-rich jurisdictions. Many producers solve for economy by pairing bio-solvents with higher-value co-products, spreading fixed costs across multiple revenue streams. Others design drop-in molecules that allow customers to avoid re-tooling downstream processes, thereby lowering total cost of change. Until more brownfield petro-chemical assets convert, the green and bio-based solvents market faces selective price resistance, particularly in commoditized applications.
Other drivers and restraints analyzed in the detailed report include:
- Corporate ESG Pledges and Green Procurement Mandates
- Increasing Government Incentives and Tax Credits
- Feedstock Supply Volatility and Agri-price Swings
For complete list of drivers and restraints, kindly check the Table Of Contents.
Segment Analysis
Bio-alcohols generated the largest revenue slice in 2024, taking a 37.2% share of the green and bio-based solvents market. Mature ethanol fermenters, widespread agricultural feedstock supply, and flexible downstream blending lines support this position. Ethyl lactate's 9.56% CAGR underscores the pivot into niche molecules with superior solvency power and biodegradability, attributes prized in pharmaceutical synthesis and electronic-grade cleaning.
The Green and Bio-Based Solvents Market Report Segments the Industry by Type (Bio-Alcohols, Bio-Glycols, Bio-Diols, and More), Application (Paints and Coatings, Industrial and Domestic Cleaning, Printing Inks, Adhesives and Sealants, and More), End-User Industry (Automotive, Construction, Agriculture, and More), and Geography (Asia-Pacific, North America, Europe, South America, and Middle-East and Africa).
Geography Analysis
Asia Pacific led the green and bio-based solvents market with a 45.2% revenue share in 2024 and posts the highest 8.77% CAGR through 2030. China's dual-carbon strategy forces refineries and downstream resin producers to curb VOC releases, creating immediate pull for renewable solvents.
North America benefits from the intersection of strict federal and state air-quality rules and a mature biofuel infrastructure. Europe stands out for policy ambition. The Green Deal, the Circular Economy Action Plan, and country-level plastic taxes all favor renewable solvents.
South America and Africa remain smaller in revenue but hold long-run value because they combine cheap feedstock availability with rising environmental awareness. Capacity build-outs, however, depend on regulatory clarity and infrastructure upgrades, both of which lag the front-runner regions.
- ADM
- BASF
- Bio Brands LLC
- Bioeutectics
- Braskem
- Cargill, Incorporated
- Corbion
- Covation Biomaterials
- Dow
- Elevance Renewable Sciences Inc.
- Florachem Corp.
- Florida Chemical Company
- Galactic
- Gevo
- GFBIOCHEMICALS
- LyondellBasell Industries Holdings B.V.
- Merck
- Peter Cremer Holding GmbH & Co. KG
- Sekab
- Solvay
- Vertec BioSolvents Inc.
Additional Benefits:
- The market estimate (ME) sheet in Excel format
- 3 months of analyst support
TABLE OF CONTENTS
1 Introduction
- 1.1 Study Assumptions and Market Definition
- 1.2 Scope of the Study
2 Research Methodology
3 Executive Summary
4 Market Landscape
- 4.1 Market Overview
- 4.2 Market Drivers
- 4.2.1 Stringent VOC-emission regulations
- 4.2.2 Volatility in crude-oil prices fuelling bio-alternatives
- 4.2.3 Corporate ESG pledges and green procurement mandates
- 4.2.4 Increasing Government incentives and tax credits for bio-chemicals
- 4.2.5 Global Expansion of Renewable Feedstock Availability
- 4.3 Market Restraints
- 4.3.1 Higher production costs
- 4.3.2 Feed-stock supply volatility and agri-price swings
- 4.3.3 Limited compatibility with legacy solvent-recovery units
- 4.4 Value Chain Analysis
- 4.5 Technological Outlook
- 4.6 Patent Analysis
- 4.7 Porter's Five Forces
- 4.7.1 Bargaining Power of Suppliers
- 4.7.2 Bargaining Power of Buyers
- 4.7.3 Threat of New Entrants
- 4.7.4 Threat of Substitutes
- 4.7.5 Degree of Competition
5 Market Size and Growth Forecasts (Value)
- 5.1 By Type
- 5.1.1 Bio-alcohols
- 5.1.1.1 Bio-ethanol
- 5.1.1.2 Bio-methanol
- 5.1.1.3 Bio-propanol
- 5.1.1.4 Bio-butanol
- 5.1.2 Bio-glycols
- 5.1.2.1 Bio-based Propylene Glycol
- 5.1.2.2 Bio-based Ethylene Glycol
- 5.1.3 Bio-diols
- 5.1.4 Ethyl Lactate
- 5.1.5 D-Limonene
- 5.1.6 Methyl Soyate
- 5.1.7 Other Types
- 5.1.1 Bio-alcohols
- 5.2 By Application
- 5.2.1 Paints and Coatings
- 5.2.2 Industrial and Domestic Cleaning
- 5.2.3 Printing Inks
- 5.2.4 Adhesives and Sealants
- 5.2.5 Pharmaceuticals
- 5.2.6 Cosmetics and Personal Care
- 5.2.7 Agriculture
- 5.2.8 Other Applications
- 5.3 By End-User Industry
- 5.3.1 Automotive
- 5.3.2 Construction
- 5.3.3 Pharmaceutical and Healthcare
- 5.3.4 Food and Beverages
- 5.3.5 Consumer Goods
- 5.3.6 Agriculture
- 5.3.7 Electronics
- 5.3.8 Others
- 5.4 By Geography
- 5.4.1 Asia Pacific
- 5.4.1.1 China
- 5.4.1.2 India
- 5.4.1.3 Japan
- 5.4.1.4 South Korea
- 5.4.1.5 Rest of APAC
- 5.4.2 North America
- 5.4.2.1 United States
- 5.4.2.2 Canada
- 5.4.2.3 Mexico
- 5.4.3 Europe
- 5.4.3.1 Germany
- 5.4.3.2 United Kingdom
- 5.4.3.3 France
- 5.4.3.4 Italy
- 5.4.3.5 Rest of Europe
- 5.4.4 South America
- 5.4.4.1 Brazil
- 5.4.4.2 Argentina
- 5.4.4.3 Rest of South America
- 5.4.5 Middle East and Africa
- 5.4.5.1 Saudi Arabia
- 5.4.5.2 South Africa
- 5.4.5.3 Rest of Middle East and Africa
- 5.4.1 Asia Pacific
6 Competitive Landscape
- 6.1 Market Concentration
- 6.2 Strategic Moves
- 6.3 Market Share Analysis
- 6.4 Company Profiles (includes Global level Overview, Market level overview, Core Segments, Financials as available, Strategic Information, Market Rank/Share for key companies, Products and Services, and Recent Developments)
- 6.4.1 ADM
- 6.4.2 BASF
- 6.4.3 Bio Brands LLC
- 6.4.4 Bioeutectics
- 6.4.5 Braskem
- 6.4.6 Cargill, Incorporated
- 6.4.7 Corbion
- 6.4.8 Covation Biomaterials
- 6.4.9 Dow
- 6.4.10 Elevance Renewable Sciences Inc.
- 6.4.11 Florachem Corp.
- 6.4.12 Florida Chemical Company
- 6.4.13 Galactic
- 6.4.14 Gevo
- 6.4.15 GFBIOCHEMICALS
- 6.4.16 LyondellBasell Industries Holdings B.V.
- 6.4.17 Merck
- 6.4.18 Peter Cremer Holding GmbH & Co. KG
- 6.4.19 Sekab
- 6.4.20 Solvay
- 6.4.21 Vertec BioSolvents Inc.
7 Market Opportunities and Future Outlook
- 7.1 White-space and Unmet-Need Assessment

