


 |
市場調查報告書
商品編碼
1836567
採礦設備:市場佔有率分析、行業趨勢、統計數據和成長預測(2025-2030 年)Mining Equipment - Market Share Analysis, Industry Trends & Statistics, Growth Forecasts (2025 - 2030) |
||||||
※ 本網頁內容可能與最新版本有所差異。詳細情況請與我們聯繫。
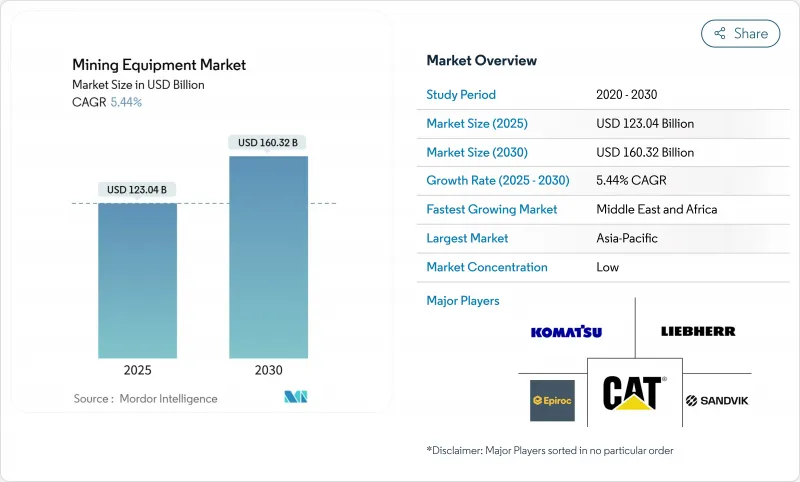
2025 年採礦設備市場價值為 1,230.4 億美元,預計到 2030 年將達到 1,603.2 億美元,複合年成長率為 5.44%(2025-2030 年)。
營運商致力於減少排放、提高生產力並確保清潔能源供應鏈所需的關鍵礦產供應,這推動了成長。隨著監管機構加強碳排放限制,投資人鼓勵低排放策略,電動車和自動駕駛汽車正從試點走向大規模部署。非洲銅、鈷和鋰產能的快速擴張,亞太地區龐大的礦產基地,以及北美的技術進步,都在推動對新一代設備的需求。隨著傳統原始設備製造商加速數位化服務,而新興中國品牌則利用其成本優勢在價格敏感型細分市場搶佔佔有率,競爭態勢日益加劇。
全球採礦設備市場趨勢與洞察
電池供應鏈中關鍵礦物的需求激增
預計到2050年,銅需求將成長70%,達到5,000多萬噸,這將推動對大容量自卸卡車、節能破碎機和人工智慧導引鑽機的需求。國際能源總署指出,清潔能源目標要求在2040年將關鍵礦產產量提高四倍,以確保敏感設備的多年更換週期。人工智慧探勘可以顯著降低鑽井成本,並將發現率提高四倍,使礦山負責人能夠更早部署資金,並刺激採礦設備市場的新訂單。亞洲電池超級工廠的建設和北美製造業回流的推動將使礦物加工系統的熱點局部。
加速採礦電氣化
加拿大、智利和澳洲已設定排放目標,迫使業者比原先設想的折舊免稅額計畫更早淘汰柴油車輛。 Fortescue 計劃在 2030 年部署 360 輛電池驅動的 T 264 自卸卡車,這清楚地表明了這種轉變的規模。現場試驗表明,由於運動部件更少且無燃料成本,電子機械可以將營運成本降低 7-15%,這項發現得到了未來電池產業合作研究中心的支持。隨著新的專業純電動車參與企業挑戰現有的原始設備製造商,並推動採礦設備市場走向不斷變化的技術基準,競爭挑戰日益加劇。
礦石品位劣化導致整體擁有成本上升
礦石品位下降要求操作員在相同產量下運輸更多礦石,從而增加能源消耗,並刺激對更大容量鏟運機、輸送機和磨機的需求。如果礦石品位下降和礦物需求持續下降,到2060年,全球採礦消費量可能增加2至8倍。原始設備製造商正在採用更節能的碎磨迴路,但這些系統的資本密集度對中型礦場來說是一個挑戰,並減緩了它們在某些礦床的可用性。
報告中分析的其他促進因素和限制因素
- 維持非洲計劃的資本支出升級
- 排放融資:降低資本成本
- 電網限制減緩了純電動車的普及
細分分析
由於電池驅動的裝載機和自卸卡車降低了通風成本並改善了空氣質量,預計地下採礦設備在2025年至2030年間的複合年成長率將達到6.36%。山特維克在2025年創紀錄的純電動車訂單標誌著曲折點。受鐵礦石和銅礦作業的推動,露天機械仍然是最大的採礦設備市場,佔67.25%。設備製造商不斷改進人工智慧分選系統,以提高破碎和分選線的礦石回收率,同時,礦工們也在努力抵消品位下降的影響。
第二代電鑽和破碎機將整合遠端控制功能,提升高風險掘進情況下的安全性。純電動車所需的重型電池正推動著人們對更輕的複合材料外殼和車載快速充電技術的研究,這一趨勢將重新定義整個採礦設備市場的產品藍圖。
受勞動力短缺和持續的安全需求推動,全自動駕駛汽車的複合年成長率高達14.2%。目前,已有超過600輛自動駕駛卡車投入商業營運,其路線由高精度GPS和防撞演算法繪製。每一次自動駕駛改造都會推動感測器、軟體和互聯互通方面的支出增加,採礦設備市場也將從中受益。
到2024年,手動設備將佔據最大的市場佔有率,達到82.15%。但半自動設備提供了一個中間環節,讓操作員可以根據地質條件和勞動力限制在手動操作和遠端操作之間切換。預計連網資產的安裝基數將從2023年的130萬增加一倍以上,達到2028年的270萬,這意味著自動化硬體和分析訂閱市場還有很長的路要走。
區域分析
到2024年,亞太地區將佔據全球採礦設備市場的60.90%,其中,中國龐大的露天礦場和澳洲高噸位鐵礦石走廊將佔據主導地位。本土領先的整機製造商徐工集團和三一集團目前正利用低成本規模和國內需求進入出口地區,這將對現有的定價結構帶來壓力。研究表明,整合太陽能和電池儲能的微電網可以將皮爾巴拉地區的柴油使用量減少70%。
中東和非洲是成長最快的叢集,到2030年的複合年成長率將達到7.55%。在非洲,剛果民主共和國的鈷、尚比亞的銅和南非的鉑金計劃是待開發區投資的主導。政府與社區夥伴關係將收益重新用於地方道路和電網建設,這進一步推動了車輛投資決策,並增強了採礦設備市場的吸引力。
北美和歐洲在技術強度和法規方面競爭。美國正在透過稅收優惠政策鼓勵自動化,並鼓勵礦工在內華達州的金礦開採作業中安裝遠端操作鑽孔機。歐洲組裝採購結構,這促使零排放運輸車原型訂單不斷湧現。南美洲主要由智利和巴西的大型企業主導,儘管宏觀經濟波動導致預算削減,但它們仍在穩步投資。安地斯高地的電網強度限制正在減緩純電動車的擴充性,但混合動力解決方案仍為電動平台保持了發展勢頭。
其他福利:
- Excel 格式的市場預測 (ME) 表
- 3個月的分析師支持
目錄
第1章 引言
- 研究假設和市場定義
- 調查範圍
第2章調查方法
第3章執行摘要
第4章 市場狀況
- 市場概況
- 市場促進因素
- 電池供應鏈中關鍵礦物的需求激增(亞洲和美國)
- 加速加拿大、智利和澳洲的礦場電氣化
- 非洲銅、鈷和鋰計劃的永續資本支出升級
- 排放掛鉤資金籌措降低電動車的資本成本
- 西澳大利亞和巴西鐵礦石綠地計畫的復甦
- 轉向預測性維護推動售後零件回收
- 市場限制
- 礦石品位劣化會增加整體擁有成本
- 偏遠礦山的電網限制阻礙了純電動車的普及
- 自動駕駛卡車司機人才短缺
- 新露天礦許可證發放時間表不一致(歐盟和美國)
- 價值/供應鏈分析
- 監理展望
- 技術展望
- 五力分析
- 供應商的議價能力
- 買方的議價能力
- 新進入者的威脅
- 替代品的威脅
- 競爭對手之間的競爭強度
第5章市場規模與成長預測(金額,十億美元)
- 依設備類型
- 地面採礦設備
- 地下採礦設備
- 選礦設備
- 鑽孔機和破碎機
- 破碎、研磨、篩檢
- 裝載機和運輸卡車
- 按自動化程度
- 手動設備
- 半自動自主設備
- 全自動設備
- 按動力傳動系統
- 內燃機汽車
- 純電動車
- 混合動力汽車
- 按輸出
- 小於500馬力
- 500至1000馬力
- 超過1000馬力
- 按用途
- 金屬礦業
- 礦物開採
- 採煤
- 按地區
- 北美洲
- 美國
- 加拿大
- 北美其他地區
- 南美洲
- 巴西
- 智利
- 秘魯
- 其他南美
- 歐洲
- 德國
- 英國
- 法國
- 西班牙
- 瑞典
- 其他歐洲國家
- 亞太地區
- 中國
- 印度
- 日本
- 韓國
- 印尼
- 其他亞太地區
- 中東和非洲
- 沙烏地阿拉伯
- 阿拉伯聯合大公國
- 南非
- 埃及
- 土耳其
- 其他中東和非洲地區
- 北美洲
第6章 競爭態勢
- 市場集中度
- 策略趨勢
- 市佔率分析
- 公司簡介
- Caterpillar Inc.
- Komatsu Ltd.
- Sandvik AB
- Liebherr-International AG
- Epiroc AB
- Hitachi Construction Machinery Co., Ltd.
- Atlas Copco AB
- Volvo Construction Equipment AB
- Metso Outotec Oyj
- Doosan Infracore Co.
- BEML Ltd.
- XCMG Group
- SANY Heavy Equipment
- Hyundai Construction Equipment Co.
- Terex Corporation
- Joy Global(Komatsu Mining)
- CNH Industrial NV
- JCB Ltd.
第7章 市場機會與未來展望
The mining equipment market is valued at USD 123.04 billion in 2025 and is forecast to reach USD 160.32 billion by 2030, reflecting a 5.44% CAGR (2025-2030).
Growth is anchored in operators' drive to cut emissions, raise productivity, and secure the critical minerals needed for clean-energy supply chains. Electrified and autonomous fleets are moving from pilot to scale as regulators tighten carbon rules and investors reward low-emission strategies. Africa's rapid build-out of copper, cobalt, and lithium capacity, Asia Pacific's large mineral base, and North America's technology upgrades collectively reinforce demand for new-generation equipment. Competitive dynamics are intensifying as traditional OEMs accelerate digital services while fast-moving Chinese brands use cost advantage to seize share in price-sensitive segments.
Global Mining Equipment Market Trends and Insights
Surging Demand for Critical Minerals for Battery Supply Chains
Copper demand is on track to climb 70% to more than 50 million tons by 2050, amplifying the pull for high-capacity haul trucks, energy-efficient crushers, and AI-guided drills. IEA indicates that clean-energy goals will require a fourfold lift in critical-mineral output by 2040, ensuring a multiyear replacement cycle for precision equipment. AI-enhanced exploration is trimming drilling expense significantly and quadrupling discovery hit rates, enabling mine planners to commit capital earlier and drive fresh orders into the mining equipment market. Asian battery-gigafactory build-outs and North America's reshoring push generate localized hotspots for mineral-processing systems.
Accelerated Mine-Electrification Mandates
Canada, Chile, and Australia have set emission-reduction targets that force operators to retire diesel fleets faster than depreciation schedules originally assumed. Fortescue's plan to deploy 360 Liebherr T 264 battery-electric haul trucks by 2030 underscores the scale of this pivot. Field trials show electric machines can cut OPEX by 7-15% owing to fewer moving parts and eliminated fuel costs, findings echoed by the Future Battery Industries Cooperative Research Centre. Competitive stakes are rising as specialised BEV newcomers challenge incumbent OEMs, propelling the mining equipment market toward a permanently altered technology baseline.
Ore-Grade Deterioration Inflating Total Cost-of-Ownership
Falling grades force operators to move more material for the same output, raising energy use and spurring demand for higher-capacity shovels, conveyors, and mills. Global mining energy consumption could climb two to eightfold by 2060 if grade decline and mineral demand trends continue. OEMs are countering with energy-efficient comminution circuits, but the capital intensity of such systems challenges mid-tier miners, slowing procurement in certain deposits.
Other drivers and restraints analyzed in the detailed report include:
- Sustained CAPEX Up-cycle in African Projects
- Emissions-Linked Financing: Lowering the Cost of Capital
- Grid Constraints Delaying BEV Deployment
For complete list of drivers and restraints, kindly check the Table Of Contents.
Segment Analysis
Underground Mining Equipment is expected to grow at a CAGR of 6.36% from 2025 to 2030 as battery-electric loaders and haul trucks mitigate ventilation costs and improve air quality. Sandvik's record BEV order book in 2025 signals an inflection point. The mining equipment market size for surface machines remains the largest with 67.25%, anchored by bulk iron ore and copper operations. Equipment OEMs continue to refine AI-sorting systems that raise ore recovery in crushing-screening lines, aligning with miners' drive to offset grade decline.
Second-generation electric drills and breakers integrate remote operation, advancing safety in high-risk headings. Ultra-class surface haul trucks dominate open-pit economics; yet the heavier batteries needed for BEV versions spur research into lighter composite housings and on-board fast-charging, a trend set to redefine product roadmaps across the mining equipment market.
Fully autonomous fleets are climbing at 14.2% CAGR, catalysed by persistent labour shortages and safety imperatives. More than 600 autonomy-enabled trucks are already in commercial service, with routes scripted by high-precision GPS and collision-avoidance algorithms. The mining equipment market benefits as each autonomous retrofit unlocks incremental spend on sensors, software, and connectivity.
Manual equipment accounts for the largest market share of 82.15% in 2024. However, semi-autonomous machines provide an intermediate step, letting operators switch between manual and remote control to fit geology or workforce constraints. The installed base of connected assets is slated to more than double from 1.3 million units in 2023 to 2.7 million by 2028, signaling a long runway for autonomy-ready hardware and analytics subscriptions.
The Mining Equipment Market Report is Segmented by Equipment Type (Surface Mining Equipment, Underground Mining Equipment, and More), Automation Level (Manual Equipment, Semi-Autonomous Equipment, and More), Power Train (ICE, BEV, and More) Power Output (Less Than 5HP and More), Application (Metal Mining, Mineral Mining, and More) and Geography. The Market Forecasts are Provided in Terms of Value (USD) and Volume (Units).
Geography Analysis
Asia Pacific holds 60.90% of the mining equipment market in 2024, spearheaded by China's vast open-pits and Australia's high-tonnage iron ore corridors. Local OEM champions XCMG and SANY now leverage low-cost scale and domestic demand to penetrate export regions, pressuring incumbent price structures. Australia's push for solar-powered mines supports early adoption of battery-electric load-hauls, particularly in the Pilbara, where studies show 70% diesel-use cuts from integrated PV-storage micro-grids.
In Middle East and Africa represents the fastest-growing cluster, registering a 7.55% CAGR through 2030. In Africa, DRC cobalt, Zambian copper, and South African platinum projects anchor greenfield spending, while infrastructure gaps spur modular design requests. Government-community partnerships that channel revenue into local roads and power links further anchor fleet investment decisions, intensifying the pull on the mining equipment market.
North America and Europe trade on technology intensity and regulation. The United States incentivises automation through tax allowances, pushing miners to retrofit tele-remote drills across Nevada gold operations. Europe frames procurement around carbon neutrality, catalysing orders for zero-emission haulage prototypes. South America, dominated by Chilean and Brazilian majors, invests steadily although macro volatility trims some budgets. Grid-strength constraints in Andean highlands slow BEV scalability, yet hybrid power solutions keep momentum for electrification-ready platforms.
- Caterpillar Inc.
- Komatsu Ltd.
- Sandvik AB
- Liebherr-International AG
- Epiroc AB
- Hitachi Construction Machinery Co., Ltd.
- Atlas Copco AB
- Volvo Construction Equipment AB
- Metso Outotec Oyj
- Doosan Infracore Co.
- BEML Ltd.
- XCMG Group
- SANY Heavy Equipment
- Hyundai Construction Equipment Co.
- Terex Corporation
- Joy Global (Komatsu Mining)
- CNH Industrial N.V.
- JCB Ltd.
Additional Benefits:
- The market estimate (ME) sheet in Excel format
- 3 months of analyst support
TABLE OF CONTENTS
1 Introduction
- 1.1 Study Assumptions & Market Definition
- 1.2 Scope of the Study
2 Research Methodology
3 Executive Summary
4 Market Landscape
- 4.1 Market Overview
- 4.2 Market Drivers
- 4.2.1 Surging demand for critical minerals for battery supply chains (Asia & US)
- 4.2.2 Accelerated mine electrification mandates in Canada, Chile & Australia
- 4.2.3 Sustained CAPEX up-cycle in African copper, cobalt & lithium projects
- 4.2.4 Emissions-linked financing lowering cost of capital for electric fleets
- 4.2.5 Recovery of greenfield iron-ore projects in Western Australia & Brazil
- 4.2.6 Shift to predictive maintenance driving aftermarket parts pull-through
- 4.3 Market Restraints
- 4.3.1 Ore-grade deterioration inflating total cost-of-ownership
- 4.3.2 Grid constraints at remote mines delaying BEV deployment
- 4.3.3 Talent shortage for autonomous haul-truck operations
- 4.3.4 Uneven permitting timelines for new surface mines (EU & US)
- 4.4 Value / Supply-Chain Analysis
- 4.5 Regulatory Outlook
- 4.6 Technological Outlook
- 4.7 Porter's Five Forces
- 4.7.1 Bargaining Power of Suppliers
- 4.7.2 Bargaining Power of Buyers
- 4.7.3 Threat of New Entrants
- 4.7.4 Threat of Substitutes
- 4.7.5 Intensity of Competitive Rivalry
5 Market Size & Growth Forecasts (Value, USD Billion)
- 5.1 By Equipment Type
- 5.1.1 Surface Mining Equipment
- 5.1.2 Underground Mining Equipment
- 5.1.3 Mineral Processing Equipment
- 5.1.4 Drills & Breakers
- 5.1.5 Crushing, Pulverizing & Screening
- 5.1.6 Loaders & Haul Trucks
- 5.2 By Automation Level
- 5.2.1 Manual Equipment
- 5.2.2 Semi-Autonomous Equipment
- 5.2.3 Fully Autonomous Equipment
- 5.3 By Powertrain Type
- 5.3.1 Internal-Combustion Engine Vehicles
- 5.3.2 Battery-Electric Vehicles
- 5.3.3 Hybrid Vehicles
- 5.4 By Power Output
- 5.4.1 Less than 500 HP
- 5.4.2 500 - 1,000 HP
- 5.4.3 Above 1,000 HP
- 5.5 By Application
- 5.5.1 Metal Mining
- 5.5.2 Mineral Mining
- 5.5.3 Coal Mining
- 5.6 By Geography
- 5.6.1 North America
- 5.6.1.1 United States
- 5.6.1.2 Canada
- 5.6.1.3 Rest of North America
- 5.6.2 South America
- 5.6.2.1 Brazil
- 5.6.2.2 Chile
- 5.6.2.3 Peru
- 5.6.2.4 Rest of South America
- 5.6.3 Europe
- 5.6.3.1 Germany
- 5.6.3.2 United Kingdom
- 5.6.3.3 France
- 5.6.3.4 Spain
- 5.6.3.5 Sweden
- 5.6.3.6 Rest of Europe
- 5.6.4 Asia Pacific
- 5.6.4.1 China
- 5.6.4.2 India
- 5.6.4.3 Japan
- 5.6.4.4 South Korea
- 5.6.4.5 Indonesia
- 5.6.4.6 Rest of Asia Pacific
- 5.6.5 Middle East and Africa
- 5.6.5.1 Saudi Arabia
- 5.6.5.2 United Arab Emirates
- 5.6.5.3 South Africa
- 5.6.5.4 Egypt
- 5.6.5.5 Turkey
- 5.6.5.6 Rest of Middle East and Africa
- 5.6.1 North America
6 Competitive Landscape
- 6.1 Market Concentration
- 6.2 Strategic Moves
- 6.3 Market Share Analysis
- 6.4 Company Profiles (includes Global level Overview, Market level overview, Core Segments, Financials as available, Strategic Information, Market Rank/Share for key companies, Products & Services, and Recent Developments)
- 6.4.1 Caterpillar Inc.
- 6.4.2 Komatsu Ltd.
- 6.4.3 Sandvik AB
- 6.4.4 Liebherr-International AG
- 6.4.5 Epiroc AB
- 6.4.6 Hitachi Construction Machinery Co., Ltd.
- 6.4.7 Atlas Copco AB
- 6.4.8 Volvo Construction Equipment AB
- 6.4.9 Metso Outotec Oyj
- 6.4.10 Doosan Infracore Co.
- 6.4.11 BEML Ltd.
- 6.4.12 XCMG Group
- 6.4.13 SANY Heavy Equipment
- 6.4.14 Hyundai Construction Equipment Co.
- 6.4.15 Terex Corporation
- 6.4.16 Joy Global (Komatsu Mining)
- 6.4.17 CNH Industrial N.V.
- 6.4.18 JCB Ltd.
7 Market Opportunities & Future Outlook
 自動化採礦設備:市場佔有率分析、產業趨勢與統計、成長預測(2026-2031)
 日本礦山機械市場規模、佔有率、趨勢和預測:按類型、設備、應用和地區分類,2026-2034年
 2026年全球行動採礦設備市場報告2026年全球電動採礦設備市場報告2026年全球礦業設備市場報告2026年全球自主採礦設備市場報告北美礦業設備市場:市場佔有率分析、產業趨勢與統計、成長預測(2026-2031年)
 礦業設備市場規模、佔有率和成長分析(按類型、動力來源、產量、應用和地區分類)—產業預測(2026-2033 年)
 礦業設備市場規模、佔有率和趨勢分析報告:按設備類型、動力來源、產量、應用、地區和細分市場預測(2025-2033 年)全球自主採礦設備市場:市場規模、佔有率、趨勢分析(按類型、採礦方法、應用和地區分類)、細分市場預測(2025-2033 年)