


 |
市場調查報告書
商品編碼
1836526
微型伺服器:市場佔有率分析、行業趨勢、統計數據和成長預測(2025-2030 年)Micro Server - Market Share Analysis, Industry Trends & Statistics, Growth Forecasts (2025 - 2030) |
||||||
※ 本網頁內容可能與最新版本有所差異。詳細情況請與我們聯繫。
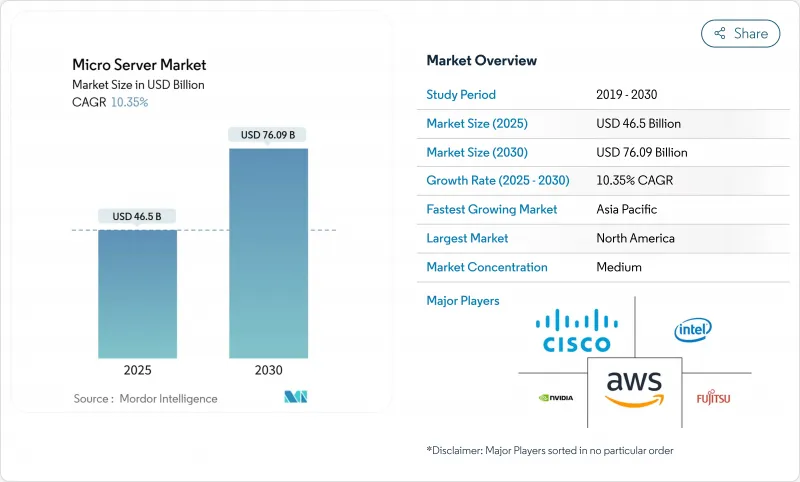
預計微型伺服器市場規模將在 2025 年達到 465 億美元,並在 2030 年達到 760.9 億美元,在此期間的複合年成長率為 10.4%。
資料中心空間的快速密集化、對支援人工智慧推理的低功耗計算節點的需求以及能源效率要求是關鍵促進因素。供應商競爭涵蓋現有的 x86 伺服器製造商、設計客製化晶片的雲端服務供應商,以及承諾提供更高每瓦效能的新 ARM 架構參與企業。雖然硬體仍然主導著採購預算,但隨著企業採用異質架構,託管服務正在快速成長。從地區來看,北美在超大規模資料中心投資方面領先,而亞太地區則在中小企業數位化和 5G 部署的推動下,正經歷最快的成長。
全球微型伺服器市場趨勢與洞察
超大規模和邊緣雲端建設激增
超大規模資料中心營運商正在標準化工廠整合的高密度伺服器,以縮短引進週期並提高單位運算功耗指標。 Infrastructure Mason 正在提議建造多千兆瓦園區式“清潔能源園區”,而 Lansheim 則正在規劃可能達到 6 千兆瓦的資料中心。電信業者也將同樣的邏輯應用於城域邊緣站點,將微型資料中心設在 5G 節點附近,以滿足低於 10 毫秒的延遲目標。因此,超大規模資料中心的經濟性與邊緣接近性的結合,已牢固確立了微型伺服器市場作為平衡密度、成本和能源效率的首選平台的地位。
人工智慧推理工作負載需要高密度、低功耗的節點
如今,推理導向的流量主導著許多生產級 AI 堆疊,推動伺服器設計朝著記憶體頻寬和加速器整合的方向發展,而非單純的 CPU 頻率。亞馬遜網路服務 (AWS) 的 Graviton 4 基於 Arm Neoverse V2 構建,整合了 96 個核心和 12 通道 DDR5-5600,在降低消費量的同時,將推理延遲控制在預算範圍內。戴爾的 4U PowerEdge XE9680L 整合了八個 NVIDIA Blackwell GPU,並採用直接液冷技術,在標準機架內提供高每瓦效能。這些藍圖突顯了一個架構軸心:微型伺服器必須整合能夠高效移動資料並在叢集中分配推理工作負載的加速器,而不僅僅是加速運算。
碎片化外形規格和 I/O 標準化
儘管開放運算專案 (OCP) 制定了 M-XIO 和模組化硬體系統 (MODH) 規範,但電源引腳、PCIe 通道和頻寬介面的差異使得不同供應商之間的互換變得複雜。這使得企業不得不擁有多個備用庫存和客製化的管理堆疊,從而削弱了規模經濟效益。缺乏即插即用的互通性也減緩了可安裝在通用背板上的第三方加速器模組的開發速度。在真正的標準化出現之前,預先認證互通性或捆綁全面支援合約的供應商將佔據優勢。
報告中分析的其他促進因素和限制因素
- 新興市場中小企業數位化熱潮
- 5G 和物聯網的推出推動了邊緣運算的需求
- 從 x86 到 Arm/RISC-V 的軟體移植成本高
細分分析
到2024年,按組件分類的微型伺服器市場規模(硬體)將達到305.5億美元(佔65.6%),證實了超大規模和邊緣資料中心的資本密集型更新週期。緊隨其後的是服務市場,規模將達到159.7億美元,到2030年複合年成長率將達到11.9%,反映出企業依賴管理基礎設施來協調架構異質性。這些支出中的大部分將用於人工智慧機架設計、液冷維修和遠端機群編配。
硬體收益得益於高密度1U雙節點伺服器和整合Arm、x86和客製化ASIC的4U GPU托架的持續出貨。戴爾在2025年第一季的AI最佳化伺服器出貨量達29億美元,這標誌著硬體週期的強勁成長。服務成長主要源自於對遠端BIOS配置、容器編配和生命週期安全性修補程式的需求,多重雲端團隊的外包業務也日益增加。提供諮詢、韌體客製化和微型伺服器叢集全天候支援的供應商正在獲得穩定的年金收入,並緩解資本預算的波動。
1U 至 4U框架單位由於與現有通道佈局和標準化電源的兼容性,將在 2024 年佔據微型伺服器市場佔有率的 60.1%。然而,隨著通訊業者和工業營運商在受限區域部署運算設備,堅固型邊緣箱的複合年成長率將達到 11.6%,遠超傳統底盤。許多設計都採用可前置的浸沒式散熱板和 -48V 直流輸入,與室外 5G 機櫃保持一致。
隨著 OEM 廠商將網路、AI 加速器和備用電池預先整合機殼鞋盒大小的機箱中,模組化微型伺服器市場正在不斷擴張。 Vicor 支援的參考設計顯示,與典型的機架節點相比,每次推理操作的能耗降低了 35%,這對於電網容量有限的地區來說極具吸引力。同時,多節點微雲固態伺服器在 3U 機架中配備八個單插槽主機板,可在不犧牲可維護性的情況下平衡更高的機架密度。
區域分析
預計到2024年,北美將累計微型伺服器市場的37.5%,營收將達到174.4億美元。喬治亞公共服務委員會目前要求高負載客戶預付電網升級成本,推動資料中心營運商轉向更節能的微伺服器節點。聯邦政府對人工智慧加速器的出口限制進一步鼓勵在美國組裝和測試,鞏固了本地價值保留。
歐洲正受到嚴格的能源效率和網路彈性立法的推動。最新版《能源效率指令》要求IT負載超過100千瓦的資料中心每年提交報告,而《數位營運彈性法案》則要求金融公司執行時間和安全性。這些規定將推動對微型伺服器的需求,微型伺服器每千瓦的運算能力更高,使營運商無需連接新電網即可實現其能源效率目標。
亞太地區是成長最快的地區,預計複合年成長率將達到 11.2%,這得益於 5G 密集化和中小企業雲端運算應用的整合。仁寶電腦與 Kalyani 集團簽署了一份合作備忘錄,將在印度生產伺服器,這符合旨在實現計算價值鏈本地化的「印度製造」獎勵。東協和南亞各國政府正在推動國內資料託管,以提高數位服務對 GDP 的貢獻,這為潮濕氣候和有限能源最佳化的區域微型伺服器設計鋪平了道路。
其他福利:
- Excel 格式的市場預測 (ME) 表
- 3個月的分析師支持
目錄
第1章 引言
- 研究假設和市場定義
- 調查範圍
第2章調查方法
第3章執行摘要
第4章 市場狀況
- 市場概況
- 市場促進因素
- 超大規模和邊緣雲端建設激增
- 人工智慧推理工作負載需要高密度、低功耗的節點
- 新興市場中小企業數位化熱潮
- 5G 和物聯網部署將增加對邊緣運算的需求
- 資料中心能源效率和碳排放稅強制要求
- 將國防級超緊湊型伺服器重新安置到「值得信賴的」供應鏈
- 市場限制
- 外形規格和 I/O 標準的細分。
- 從 x86 到 Arm/RISC-V 的軟體移植成本高
- 先進處理器出口管制的不確定性
- 開放原始碼RISC-V 生態系成熟緩慢
- 價值鏈分析
- 監管狀況
- 技術展望
- 波特五力分析
- 供應商的議價能力
- 買方的議價能力
- 新進入者的威脅
- 替代品的威脅
- 競爭對手之間的競爭
- 投資分析
- 評估宏觀經濟趨勢對市場的影響
第5章市場規模及成長預測(金額)
- 按組件
- 硬體
- 服務
- 外形規格
- 機架(1U-4U)
- 多節點微雲
- 模組化堅固邊緣盒
- 按用途
- 資料中心
- 雲端處理
- 媒體/內容存儲
- 數據分析與人工智慧
- 物聯網/工業邊緣
- 按最終用戶
- 主要企業
- 中小企業
- 按地區
- 北美洲
- 美國
- 加拿大
- 墨西哥
- 歐洲
- 德國
- 英國
- 法國
- 義大利
- 西班牙
- 其他歐洲國家
- 亞太地區
- 中國
- 日本
- 印度
- 韓國
- 澳洲
- 其他亞太地區
- 南美洲
- 巴西
- 阿根廷
- 其他南美
- 中東和非洲
- 中東
- 沙烏地阿拉伯
- 阿拉伯聯合大公國
- 土耳其
- 其他中東地區
- 非洲
- 南非
- 埃及
- 奈及利亞
- 其他非洲國家
- 北美洲
第6章 競爭態勢
- 市場集中度
- 策略趨勢
- 市佔率分析
- 公司簡介
- Dell Technologies
- Lenovo
- Foxconn
- Ampere Computing
- Advanced Micro Devices
- Huawei
- Cisco Systems
- Hewlett Packard Enterprise
- Quanta Computer
- Inventec
- AWS(Graviton)
- Nvidia
- Fujitsu
- Penguin Computing
- Super Micro Computer
- Wistron
- Gigabyte Technology
- Intel
- Marvell
- NEC
- Plat'Home
第7章 市場機會與未來展望
The micro server market size currently stands at USD 46.50 billion in 2025 and is forecast to climb to USD 76.09 billion by 2030, reflecting a 10.4% CAGR over the period.
Rapid densification of data-center footprints, demand for low-power compute nodes to support AI inference, and tightening energy-efficiency mandates are the primary tailwinds. Vendor competition spans established x86 server makers, cloud providers designing custom silicon, and new ARM-based entrants that promise higher performance per watt. Hardware continues to dominate procurement budgets, yet managed services grow quickly as enterprises grapple with heterogeneous architectures. Regionally, North America leads on the back of hyperscale investments, while Asia-Pacific shows the fastest expansion because of SME digitalisation and 5G roll-outs.
Global Micro Server Market Trends and Insights
Surge in Hyperscale and Edge-Cloud Build-Outs
Hyperscale operators are standardising factory-integrated, high-density sleds that shorten deployment cycles and improve watt-per-compute metrics. Infrastructure Masons advocates campus-style "clean-energy parks" sized at multi-gigawatt scale, while Lancium plans sites that may reach 6 GW of capacity, illustrating how power availability now guides server architecture choices. Telecommunications companies extend the same logic to metro edge sites, installing micro data centres adjacent to 5G nodes to meet sub-10 millisecond latency targets; ruggedised micro servers allow rapid provisioning without full-scale facilities. Convergence of hyperscale economics with edge proximity therefore cements the micro server market as the preferred platform for balancing density, cost, and power efficiency.
AI Inference Workloads Require Dense, Low-Power Nodes
Inference-oriented traffic now dominates many production AI stacks, pushing server design toward memory bandwidth and accelerator integration over raw CPU frequency. Amazon Web Services' Graviton 4, built on Arm Neoverse V2, integrates 96 cores and 12-channel DDR5-5600 to keep inference latency within budget while trimming energy draw. Dell's 4U PowerEdge XE9680L packages eight NVIDIA Blackwell GPUs with direct liquid cooling, delivering high performance per watt inside standard racks. These blueprints underscore an architectural pivot: micro servers must move data efficiently rather than simply compute faster, embedding accelerators that disperse inference workloads across clusters.
Fragmented Form-Factor and I/O Standards
Despite the Open Compute Project's M-XIO and Modular Hardware System specifications, variance in power pins, PCIe lanes, and out-of-band interfaces complicates swapping sleds across vendors. Enterprises therefore juggle multiple spares inventories and bespoke management stacks, diluting economies of scale. Lack of plug-and-play interoperability also slows the creation of third-party accelerator modules that could otherwise ride a common backplane. Vendors that pre-certify cross-compatibility or bundle holistic support contracts are better positioned until true standardisation emerges.
Other drivers and restraints analyzed in the detailed report include:
- SME Digitalisation Boom in Emerging Markets
- Rising Edge-Computing Demand from 5G and IoT Roll-Outs
- High Software-Porting Cost from x86 to Arm/RISC-V
For complete list of drivers and restraints, kindly check the Table Of Contents.
Segment Analysis
The micro server market size by component reached USD 30.55 billion for hardware in 2024, equivalent to 65.6% share, confirming capital-intensive refresh cycles within hyperscale and edge facilities. Services followed at USD 15.97 billion but will expand at 11.9% CAGR through 2030, reflecting enterprise reliance on managed infrastructure to tame architectural heterogeneity. Much of the spend funneled into design-for-AI racks, liquid cooling retrofits, and remote fleet orchestration.
Hardware revenue is anchored by continued shipments of dense 1U twin-node sleds and 4U GPU trays that integrate Arm, x86, and custom ASICs. Dell shipped USD 2.9 billion in AI-optimised servers during 2025 Q1, a single-vendor signal of the hardware cycle's strength. Services growth stems from demand for remote BIOS provisioning, container orchestration, and lifecycle security patching-tasks that multicloud teams increasingly outsource. Vendors that wrap consulting, firmware customisation, and 24-hour support around micro server fleets capture sticky annuity streams, cushioning volatility in capital budgets.
Rack units between 1U and 4U captured 60.1% of micro server market share in 2024, owing to their fit with existing aisle layouts and standardised power feeds. However, rugged edge boxes are on track for an 11.6% CAGR, far outpacing legacy chassis as telecom and industrial players push compute to constrained sites. Many designs adopt front-serviceable soaked-plate cooling and -48 V DC inputs, aligning with outdoor 5G cabinets.
The micro server market size for modular boxes will rise as OEMs pre-integrate networking, AI accelerators, and battery backup into shoebox-scale enclosures. Vicor-backed reference designs show 35% lower energy use per inference operation compared with typical rack nodes, attractive where grid capacity is scarce. Meanwhile, multi-node microcloud sleds strike a balance, fitting eight single-socket boards into a 3U frame to boost rack density without sacrificing serviceability.
The Micro Server Market Report is Segmented by Component (Hardware and Services), Form Factor (Rack, Multi-Node Microcloud, and Modular Rugged Edge Box), Application (Data Centre, Cloud Computing, Media / Content Storage, and More), End-User (Large Enterprises and Small and Medium Enterprises (SMEs)), and Geography. The Market Forecasts are Provided in Terms of Value (USD).
Geography Analysis
North America generated USD 17.44 billion of revenue in 2024, equal to 37.5% of the micro server market, thanks to heavy hyperscale capex and government preference for defence-grade domestic supply chains. The Georgia Public Service Commission now obliges large-load customers to shoulder upfront grid-upgrade costs, nudging data-centre operators toward more energy-efficient micro server nodes. Federal export controls on AI accelerators further incentivise U.S.-based assembly and testing, solidifying local value retention.
Europe follows, propelled by stringent energy-efficiency and cyber-resilience laws. The updated Energy Efficiency Directive mandates annual reporting for data-centre sites above 100 kW IT load, while the Digital Operational Resilience Act compels financial firms to bolster uptime and security. These rules elevate demand for micro servers that deliver higher compute per kilowatt, aiding operators in meeting power-usage-effectiveness targets without new grid connections.
Asia-Pacific is the fastest-growing territory, forecast at 11.2% CAGR, as 5G densification and SME cloud adoption converge. Compal Electronics and Kalyani Group signed an MoU to manufacture servers in India, aligning with "Make in India" incentives aimed at localising the compute value chain. Governments across ASEAN and South Asia promote domestically hosted data to spur digital services GDP contributions, paving the way for region-specific micro server designs optimised for humid climates and limited utility power.
- Dell Technologies
- Lenovo
- Foxconn
- Ampere Computing
- Advanced Micro Devices
- Huawei
- Cisco Systems
- Hewlett Packard Enterprise
- Quanta Computer
- Inventec
- AWS (Graviton)
- Nvidia
- Fujitsu
- Penguin Computing
- Super Micro Computer
- Wistron
- Gigabyte Technology
- Intel
- Marvell
- NEC
- Plat'Home
Additional Benefits:
- The market estimate (ME) sheet in Excel format
- 3 months of analyst support
TABLE OF CONTENTS
1 INTRODUCTION
- 1.1 Study Assumptions and Market Definition
- 1.2 Scope of the Study
2 RESEARCH METHODOLOGY
3 EXECUTIVE SUMMARY
4 MARKET LANDSCAPE
- 4.1 Market Overview
- 4.2 Market Drivers
- 4.2.1 Surge in hyperscale and edge-cloud build-outs
- 4.2.2 AI inference workloads require dense, low-power nodes
- 4.2.3 SME digitalisation boom in emerging markets
- 4.2.4 Rising edge-computing demand from 5G and IoT roll-outs
- 4.2.5 Data-centre energy-efficiency and carbon-tax mandates
- 4.2.6 Reshoring to "trusted" supply chains for defence-grade micro-servers
- 4.3 Market Restraints
- 4.3.1 Fragmented form-factor and I/O standards
- 4.3.2 High software-porting cost from x86 to Arm/RISC-V
- 4.3.3 Export-control uncertainty on advanced processors
- 4.3.4 Slow maturity of open-source RISC-V ecosystems
- 4.4 Value Chain Analysis
- 4.5 Regulatory Landscape
- 4.6 Technological Outlook
- 4.7 Porter's Five Forces Analysis
- 4.7.1 Bargaining Power of Suppliers
- 4.7.2 Bargaining Power of Buyers
- 4.7.3 Threat of New Entrants
- 4.7.4 Threat of Substitutes
- 4.7.5 Intensity of Competitive Rivalry
- 4.8 Investment Analysis
- 4.9 Assessment of the Impact of Macroeconomic Trends on the Market
5 MARKET SIZE AND GROWTH FORECASTS (VALUE)
- 5.1 By Component
- 5.1.1 Hardware
- 5.1.2 Services
- 5.2 By Form Factor
- 5.2.1 Rack (1U-4U)
- 5.2.2 Multi-node Microcloud
- 5.2.3 Modular Rugged Edge Box
- 5.3 By Application
- 5.3.1 Data Centre
- 5.3.2 Cloud Computing
- 5.3.3 Media / Content Storage
- 5.3.4 Data Analytics and AI
- 5.3.5 IoT / Industrial Edge
- 5.4 By End-User
- 5.4.1 Large Enterprises
- 5.4.2 Small and Medium Enterprises (SMEs)
- 5.5 By Geography
- 5.5.1 North America
- 5.5.1.1 United States
- 5.5.1.2 Canada
- 5.5.1.3 Mexico
- 5.5.2 Europe
- 5.5.2.1 Germany
- 5.5.2.2 United Kingdom
- 5.5.2.3 France
- 5.5.2.4 Italy
- 5.5.2.5 Spain
- 5.5.2.6 Rest of Europe
- 5.5.3 Asia-Pacific
- 5.5.3.1 China
- 5.5.3.2 Japan
- 5.5.3.3 India
- 5.5.3.4 South Korea
- 5.5.3.5 Australia
- 5.5.3.6 Rest of Asia-Pacific
- 5.5.4 South America
- 5.5.4.1 Brazil
- 5.5.4.2 Argentina
- 5.5.4.3 Rest of South America
- 5.5.5 Middle East and Africa
- 5.5.5.1 Middle East
- 5.5.5.1.1 Saudi Arabia
- 5.5.5.1.2 United Arab Emirates
- 5.5.5.1.3 Turkey
- 5.5.5.1.4 Rest of Middle East
- 5.5.5.2 Africa
- 5.5.5.2.1 South Africa
- 5.5.5.2.2 Egypt
- 5.5.5.2.3 Nigeria
- 5.5.5.2.4 Rest of Africa
- 5.5.1 North America
6 COMPETITIVE LANDSCAPE
- 6.1 Market Concentration
- 6.2 Strategic Moves
- 6.3 Market Share Analysis
- 6.4 Company Profiles (includes Global level Overview, Market level overview, Core Segments, Financials as available, Strategic Information, Market Rank/Share for key companies, Products and Services, and Recent Developments)
- 6.4.1 Dell Technologies
- 6.4.2 Lenovo
- 6.4.3 Foxconn
- 6.4.4 Ampere Computing
- 6.4.5 Advanced Micro Devices
- 6.4.6 Huawei
- 6.4.7 Cisco Systems
- 6.4.8 Hewlett Packard Enterprise
- 6.4.9 Quanta Computer
- 6.4.10 Inventec
- 6.4.11 AWS (Graviton)
- 6.4.12 Nvidia
- 6.4.13 Fujitsu
- 6.4.14 Penguin Computing
- 6.4.15 Super Micro Computer
- 6.4.16 Wistron
- 6.4.17 Gigabyte Technology
- 6.4.18 Intel
- 6.4.19 Marvell
- 6.4.20 NEC
- 6.4.21 Plat'Home
7 MARKET OPPORTUNITIES AND FUTURE OUTLOOK
- 7.1 White-space and Unmet-Need Assessment
 微型伺服器積體電路市場:2026-2032年全球市場預測(依架構、製程技術、封裝類型、最終用戶和銷售管道)
 全球微型伺服器積體電路市場規模、佔有率、趨勢和成長分析報告(2026-2034年)
 2026年全球微型伺服器IC市場報告
 微型伺服器積體電路市場-全球產業規模、佔有率、趨勢、機會、預測:按組件、處理器類型、最終用戶、地區和競爭格局分類,2021-2031年
 微型伺服器積體電路市場規模、佔有率和成長分析(按產品、處理器類型、應用、最終用戶和地區分類)—2026-2033年產業預測
 微型伺服器 IC 市場機會、成長動力、產業趨勢分析及 2025 - 2034 年預測
 微型伺服器 IC 市場規模、佔有率、趨勢分析報告:按組件、按處理器、按最終用途、按地區、按細分市場、預測,2024-2030 年
 2024-2028 年全球微型伺服器市場