


 |
市場調查報告書
商品編碼
1836513
苛性鈉:市場佔有率分析、產業趨勢、統計數據和成長預測(2025-2030 年)Caustic Soda - Market Share Analysis, Industry Trends & Statistics, Growth Forecasts (2025 - 2030) |
||||||
※ 本網頁內容可能與最新版本有所差異。詳細情況請與我們聯繫。
2024年,膜電池將佔據大部分產量,佔據苛性鈉市場佔有率的85%,而到2030年,隔膜電池的複合年成長率將達到5.12%。
預計全球對苛性鈉的需求將在 2025 年達到 9,495 萬噸,到 2030 年將達到 1.163 億噸,2025 年至 2030 年的複合年成長率為 4.14%。強勁的成長得益於該化學品廣泛的工業應用,包括氧化鋁精煉、有機化學合成、紙漿和造紙、紡織和水處理。膜電池技術已佔產量的 85%,由於與傳統汞電池相比,該技術可減少約 30% 的用電量並消除汞排放,因此正在擴大。亞洲佔噸位的 64%,由於具有競爭力的電價、快速的煉油廠建設和積極的粘膠纖維投資而佔據主導地位。液體等級佔出貨量的 65%,並提供有利的管道運輸和散裝儲存。價差擴大追蹤區域能源成本,促使生產商簽署低碳電力合約並在天然氣豐富的海岸線附近設立新工廠。中國、印度和美國宣布的產能擴張凸顯了能源安全、碳政策和局部需求叢集之間的謹慎平衡,維持了合理分散的苛性鈉市場。
全球苛性鈉市場趨勢與洞察
亞洲氧化鋁精煉廠加速擴張
由於每使用拜耳法提取一噸氧化鋁需要冶煉 2-3 噸,因此精煉產能的提高推高了苛性鈉的消耗量,預計到 2024 年,僅中國鋁製造商就將消耗數千萬噸燒鹼。印尼和印度的新冶煉廠正在簽訂長期供應合約以對沖價格上漲,這可能導致鋁生產成本較上季上漲近 6%。工廠營運商也在採購更高純度的燒鹼以減少赤泥浪費,導致低鹽苛性鈉價格溢價。目前,一些煉油廠所有者正在考慮後向整合,加劇了上游許可證和電力取得的競爭。由於每增加一百萬噸氧化鋁大約需要 250 萬噸苛性鈉,因此計劃於 2025-2027 年綠地計畫正在支持苛性鈉市場的結構性需求成長。
肥皂和清潔劑的需求不斷增加
新興市場衛生主導的都市化正在拓寬肥皂和清潔劑,而苛性鈉是這些產品中皂化反應的鹼性主鏈。預計到2024年,印尼、奈及利亞和越南界面活性劑製造商的出貨量將達到兩位數成長,目前優質食品級苛性鈉的價格較標準的50 wt%溶液上漲了12%。特殊配方師要求產品中鐵和鎳的含量達到超低,以減少透明肥皂的變色,這促使製造商投資鹽水淨化裝置。從抗菌液體到織物專用粉末,豐富的產品組合保持了苛性鈉市場的多樣性,從而緩解了重工業的週期性衰退。
歐洲電價波動
電費佔膜電解現金成本的50%,但歐洲的日前電價在2025年初超過90歐元/兆瓦時,侵蝕了歐洲氯鹼的利潤。根據歐盟排放權交易體系,生產商面臨間接二氧化碳排放費用,使得他們與俄羅斯和沙烏地阿拉伯出口商的成本差距擴大至每噸120美元。目前正在討論的補償方案可能會補償部分成本,但政策的不確定性阻礙了歐洲新產能的投資。因此,預計2024年西北歐的現貨進口量將年增19%,這將對該地區的苛性鈉市場帶來壓力。
報告中分析的其他促進因素和限制因素
- 印度粘膠短纖維產量激增
- 提高中東和非洲的海水淡化能力
- 能源密集型生產流程
細分分析
氯化鈉的優點源自於對汞技術的監管禁令(尤其是歐盟2017年的最終淘汰日期)及其比傳統電池節省30%的能源。此外,氯化鈉污染可以保持在100 ppm以下,從而為半導體製造提供高純度等級。中國、美國和德國的製造商正在透過將電流密度提高到7 kA m-2來突破現有薄膜生產線的瓶頸,從而在不增加新的鹽水迴路的情況下增加噸位。一股平行的投資浪潮席捲日本,旭化成將於2024年獲得政府支持,以擴大膜堆產能,用於國內氯鹼維修。苛性鈉市場的其餘部分是薄膜和殘留汞產能。
液體苛性鈉的運輸量通常為 50 wt%,佔 2024 年運輸量的 65%,而固態苛性鈉的複合年成長率預計為 4.87%。對於距離氯鹼廠 300-500 公里範圍內的客戶,管道連通性和散裝卡車處理使液體成為預設選擇,從而將運費保持在 30 美元/噸以下。紙漿和造紙廠、煉油廠和營業單位對液體的需求尤其強勁,這些公司的連續注入系統依賴標準的 50 wt% 原料。片狀、珠狀和團塊狀固態可滿足遠距、純度關鍵或小批量的需求。雖然固態原料的數量較少,但由於脫水、造粒和抑塵工藝,每噸價格高出 120 美元。 Hydrite 於 2025 年推出的密封桶珠包裝可有效降低吸濕性,直接滿足最終用戶的安全需求。固態的用量將主要成長於電子、製藥和紡織染色領域,這將為生產商在商品苛性鈉市場提高利潤率提供途徑。
區域分析
亞太地區鞏固了領先地位,佔2024年出貨量的64%。儘管由於歐洲需求疲軟導致出口下降,中國氯鹼工廠的產量仍接近4,100萬噸。由於鋁和聚氯乙烯(PVC)產量擴張,國內消費依然強勁。隨著Atul Products公司在瓦爾薩德(Valsad)的一座300噸/日的工廠於2024年運作,印度苛性鈉市場勢頭強勁。東南亞生產商受益於該地區對肥皂、生物柴油和電池前驅體的需求,在跨境計劃中站穩了腳跟,從而降低了海運風險。
北美儘管市場佔有率較小,但其電解電力成本在全球處於最低水平,充分利用頁岩氣資源,促進了苛性鈉和氯衍生物的出口競爭力。 OxyChem 將於 2024 年在德克薩斯州運作一條 67.8 萬噸製冷級生產線,以增強國內供應彈性。該地區的未來規劃包括 PCC 集團計劃在科慕德利斯爾工廠建造的 34 萬噸氯鹼裝置,該裝置計劃於 2028 年試運行。此類棕地整合將為成熟且技術先進的苛性鈉市場增添商用苛性鈉,同時鞏固氯氣經銷店。
歐洲正深陷高企且波動的能源價格的泥潭。儘管擁有76個製造地,但不斷上漲的現貨電價已將該地區的現金成本推高至遠高於俄羅斯或沙烏地阿拉伯,導致運轉率下降。政策制定者目前正在討論間接成本補償,以避免碳洩漏,並保護氯鹼產業鏈中3.5萬個直接就業機會。儘管如此,在電子、製藥和食品加工等行業,歐洲生產商仍在繼續與遵守歐洲大陸嚴格品質通訊協定的客戶開展業務,儘管面臨普遍的成本壓力,但仍保持著獨特的價值主張。
其他福利:
- Excel 格式的市場預測 (ME) 表
- 3個月的分析師支持
目錄
第1章 引言
- 研究假設和市場定義
- 調查範圍
第2章調查方法
第3章執行摘要
第4章 市場狀況
- 市場概況
- 市場促進因素
- 亞洲氧化鋁提煉加速擴張將增加苛性鈉需求
- 肥皂和清潔劑的需求不斷增加
- 印度粘膠短纖維產量激增
- 提高中東和非洲的海水淡化能力
- 歐盟強制要求改用膜電池推動升級計劃
- 市場限制
- 歐洲電價波動
- 能源密集型生產流程
- 各個終端用戶產業中替代產品的可用性
- 價值鏈分析
- 技術展望
- 價格概覽
- 貿易概況
- 五力分析
- 供應商的議價能力
- 買方的議價能力
- 新進入者的威脅
- 替代品的威脅
- 競爭程度
第5章市場規模及成長預測(數量)
- 按製造程序
- 膜細胞
- 隔膜細胞
- 其他流程
- 按形狀
- 液體
- 固體的
- 按濃度等級
- 32wt%
- 50wt%
- 73wt%或更多
- 按用途
- 紙漿和造紙
- 有機化學品
- 無機化學品
- 肥皂和清潔劑
- 氧化鋁
- 水處理
- 纖維(黏膠纖維,染色)
- 其他(食品和製藥加工、採礦和冶金)
- 按地區
- 亞太地區
- 中國
- 印度
- 日本
- 韓國
- ASEAN
- 其他亞太地區
- 北美洲
- 美國
- 加拿大
- 墨西哥
- 歐洲
- 德國
- 英國
- 義大利
- 法國
- 北歐的
- 其他歐洲國家
- 南美洲
- 巴西
- 阿根廷
- 其他南美
- 中東和非洲
- 沙烏地阿拉伯
- 阿拉伯聯合大公國
- 土耳其
- 南非
- 埃及
- 其他中東和非洲地區
- 亞太地區
第6章 競爭態勢
- 市場集中度
- 策略趨勢
- 市佔率(%)/排名分析
- 公司簡介{ }(英文)
- AGC Inc.
- Atul Ltd
- BorsodChem(Wanhua Chemical Group)
- Covestro AG
- DCW Ltd.
- Dow
- Formosa Plastics Corporation
- GHCL Limited
- Grasim Industries Limited
- Gujarat Alkalies and Chemicals Limited
- Hanwha Solutions Corp.
- INEOS
- Nouryon
- Occidental Petroleum Corporation
- Olin Corporation
- SABIC
- Shin-Etsu Chemical Co. Ltd.
- Tata Chemicals Ltd.
- Tosoh Corporation
- Westlake Corporation
- Xinjiang Zhongtai Chemical Co. Ltd.
第7章 市場機會與未來展望
- 鈉離子電池領域需求不斷成長
- 節能生產流程的需求不斷增加
- 閒置頻段和未滿足需求評估
The membrane cell segment generated the bulk of 2024 output, commanding 85% of the caustic soda market share, and the diaphragm cell is expanding at a 5.12% CAGR to 2030.
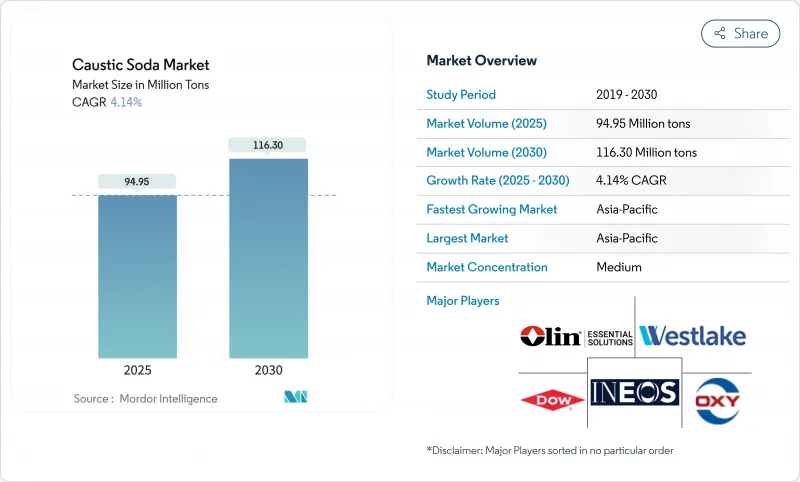
Global demand for caustic soda totals 94.95 million tons in 2025 and is forecast to climb to 116.30 million tons by 2030, reflecting a 4.14% CAGR over 2025-2030. Robust growth springs from the chemical's wide industrial reach, with alumina refining, organic chemical synthesis, pulp and paper, textiles, and water treatment each deepening their consumption. Membrane cell technology, already responsible for 85% of output, is expanding because it cuts electricity use by roughly 30% relative to legacy mercury cells and eliminates mercury emissions. Asia's dominance, at 64% of tonnage, rests on competitive power tariffs, rapid refinery build-outs, and aggressive viscose fiber investments. Liquid grades command 65% of deliveries, favored for pipeline transfer and bulk storage. Pricing spreads increasingly track regional energy costs, prompting producers to lock in low-carbon electricity contracts and locate new plants near gas-rich coastlines. Capacity additions announced in China, India, and the United States underscore a careful balance between energy security, carbon policy, and localized demand clusters, sustaining a moderately fragmented caustic soda market.
Global Caustic Soda Market Trends and Insights
Accelerated Alumina Refinery Expansions in Asia
Rising refinery capacity is lifting caustic soda offtake because 2-3 tons are dissolved for every ton of alumina extracted in the Bayer process, and Chinese aluminum producers alone consumed tens of millions of tons in 2024. New smelter complexes in Indonesia and India are contracting long-term supply to hedge price spikes, which can swing aluminum production costs by nearly 6% quarter-on-quarter. Plant operators also source higher-purity grades to reduce red-mud disposal volumes, translating into price premia for low-salt caustic soda. Several refinery owners now consider backward integration, sharpening competition for upstream licenses and power access. With each 1 million-ton alumina addition requiring roughly 2.5 million tons of caustic soda, green-field projects scheduled for 2025-2027 underpin structural demand growth for the caustic soda market.
Increasing Demand for Soap and Detergent
Hygiene-led urbanization across emerging economies is widening the soap and detergent aisle, where caustic soda forms the alkali backbone of saponification reactions. Volumes shipped to surfactant makers in Indonesia, Nigeria, and Vietnam rose in double digits in 2024, and premium food-grade caustic soda now secures a 12% pricing uplift over standard 50 wt% solutions. Specialty formulators request ultra-low iron and nickel specifications that cut discoloration in transparent soaps, nudging producers to invest in brine purification skids. The widening product mix-from anti-bacterial liquids to fabric-specific powders-keeps the caustic soda market diversified, cushioning cyclical downturns in heavy industry.
Volatile Electricity Prices in Europe
Electricity can represent 50% of cash costs for membrane electrolysis, and European day-ahead prices surged above EUR 90/MWh in early 2025, eroding margins Euro Chlor. Producers face indirect CO2 charges under the EU Emissions Trading Scheme, widening cost gaps versus Russian or Saudi exporters by up to USD 120 per ton. Compensation proposals under discussion could reimburse a share of these expenses, yet policy uncertainty curtails investment in new European capacity. Consequently, spot imports into north-west Europe rose 19% year-on-year in 2024, pressuring the regional caustic soda market.
Other drivers and restraints analyzed in the detailed report include:
- Surge in Viscose Staple Fiber Output in India
- Desalination Capacity Additions in the Middle East and Africa
- Energy-Intensive Production Process
For complete list of drivers and restraints, kindly check the Table Of Contents.
Segment Analysis
Its dominance stems from regulatory bans on mercury technology, notably the EU's final 2017 phase-out deadline, and from a 30% electricity-savings advantage relative to legacy cells. In addition, sodium chloride contamination can be held below 100 ppm, enabling high-purity grades for semiconductor production. Producers in China, the United States, and Germany are debottlenecking existing membrane lines by raising current density to 7 kA m-2, adding incremental tonnage without new brine circuits. A parallel investment wave is visible in Japan, where Asahi Kasei secured government backing in 2024 to expand membrane stack output for domestic chlor-alkali retrofits. Diaphragm and residual mercury capacity accounts for the balance of the caustic soda market.
Liquid caustic soda, typically shipped at 50 wt%, covered 65% of deliveries in 2024 while solid form is projected to rise at a 4.87% CAGR. Pipeline connectivity and bulk-truck handling make liquids the default for customers located within 300-500 km of a chlor-alkali plant, limiting freight costs to under USD 30 per ton. Liquid demand is particularly resilient among pulp and paper mills, oil refineries, and water utilities, where continuous dosing systems rely on standard 50 wt% feedstock. Solid forms-flakes, beads, and briquettes-meet long-haul, purity-critical, or small-batch needs. Although representing a smaller volume, solids fetch up to USD 120 per ton premiums owing to de-watering, prilling, and dust-suppression steps. Hydrite's 2025 launch of sealed-drum bead packaging cuts hygroscopic moisture pick-up and directly addresses end-user safety demands. Solid volumes grow mainly in electronics, pharmaceuticals, and textile dyeing, giving producers an avenue to lift margin in an otherwise commodity-like caustic soda market.
The Caustic Soda Market Report Segments the Industry by Production Process (Membrane Cell, Diaphragm Cell, and Other Processes), Form (Liquid and Solid), Concentration Grade (32 Wt%, 50 Wt%, and 73 Wt% and Higher), Applications (Pulp and Paper, Organic Chemicals, and More), and Geography (Asia-Pacific, North America, Europe, South America, and Middle East and Africa). The Market Forecasts are Provided in Terms of Volume (tons).
Geography Analysis
Asia-Pacific cemented its leadership with 64% of 2024 shipments. Chinese chlor-alkali plants recorded output near 41 million tons, even as exports dipped on softer European draws. Domestic consumption stayed buoyant thanks to aluminum and PVC expansions. India's caustic soda market gained momentum when Atul Products commissioned a 300 TPD facility in Valsad during 2024, complemented by captive 50 MW power that buffers electricity risk. Southeast Asian producers benefit from regional demand for soap, biodiesel, and battery precursors, building a springboard for cross-border pipeline projects that cut maritime freight exposure.
North America, holding a significant albeit smaller share, leverages shale-derived natural gas to enjoy one of the world's lowest electrolysis power costs, fostering competitive exports of both caustic soda and chlorine derivatives. OxyChem's 2024 restart of its 678 kt refrigeration-grade line in Texas bolsters domestic supply resilience. The region's forward pipeline includes PCC Group's planned 340 kt chlor-alkali unit at Chemours' DeLisle site, scheduled for commissioning in 2028. Such brownfield integrations anchor captive chlorine outlets while adding merchant caustic to a mature but technologically advanced caustic soda market.
Europe struggles under high and volatile energy prices. Despite hosting 76 manufacturing sites, capacity utilization dipped as spot electricity spikes pushed regional cash costs well above those in Russia or Saudi Arabia. Policymakers now debate indirect-cost compensation to avert carbon leakage and protect 35,000 direct jobs in the chlor-alkali chain. Nonetheless, European producers continue to court customers in electronics, pharmaceuticals, and food processing who insist on the continent's stringent quality protocols, preserving niche value despite broad cost pressures.
- AGC Inc.
- Atul Ltd
- BorsodChem (Wanhua Chemical Group)
- Covestro AG
- DCW Ltd.
- Dow
- Formosa Plastics Corporation
- GHCL Limited
- Grasim Industries Limited
- Gujarat Alkalies and Chemicals Limited
- Hanwha Solutions Corp.
- INEOS
- Nouryon
- Occidental Petroleum Corporation
- Olin Corporation
- SABIC
- Shin-Etsu Chemical Co. Ltd.
- Tata Chemicals Ltd.
- Tosoh Corporation
- Westlake Corporation
- Xinjiang Zhongtai Chemical Co. Ltd.
Additional Benefits:
- The market estimate (ME) sheet in Excel format
- 3 months of analyst support
TABLE OF CONTENTS
1 Introduction
- 1.1 Study Assumptions and Market Definition
- 1.2 Scope of the Study
2 Research Methodology
3 Executive Summary
4 Market Landscape
- 4.1 Market Overview
- 4.2 Market Drivers
- 4.2.1 Accelerated alumina refinery expansions in Asia boosting caustic demand
- 4.2.2 Increasing Demand for Soap and Detergent
- 4.2.3 Surge in viscose staple fiber output in India
- 4.2.4 Desalination capacity additions in the Middle East and Africa
- 4.2.5 EU-mandated switch to membrane cells driving upgrade projects
- 4.3 Market Restraints
- 4.3.1 Volatile electricity prices in Europe
- 4.3.2 Energy-intensive Production Process
- 4.3.3 Availability of substitutes in Various End User Industries
- 4.4 Value Chain Analysis
- 4.5 Technological Outlook
- 4.6 Price Overview
- 4.7 Trade Overview
- 4.8 Porter's Five Forces
- 4.8.1 Bargaining Power of Suppliers
- 4.8.2 Bargaining Power of Buyers
- 4.8.3 Threat of New Entrants
- 4.8.4 Threat of Substitutes
- 4.8.5 Degree of Competition
5 Market Size and Growth Forecasts ( Volume)
- 5.1 By Production Process
- 5.1.1 Membrane Cell
- 5.1.2 Diaphragm Cell
- 5.1.3 Other Processes
- 5.2 By Form
- 5.2.1 Liquid
- 5.2.2 Solid
- 5.3 By Concentration Grade
- 5.3.1 32 wt%
- 5.3.2 50 wt%
- 5.3.3 73 wt% and Higher
- 5.4 By Application
- 5.4.1 Pulp and Paper
- 5.4.2 Organic Chemicals
- 5.4.3 Inorganic Chemicals
- 5.4.4 Soap and Detergent
- 5.4.5 Alumina
- 5.4.6 Water Treatment
- 5.4.7 Textile (Viscose Fibre, Dyeing)
- 5.4.8 Others (Food and Pharmaceutical Processing, Mining and metallurgy)
- 5.5 By Geography
- 5.5.1 Asia-Pacific
- 5.5.1.1 China
- 5.5.1.2 India
- 5.5.1.3 Japan
- 5.5.1.4 South Korea
- 5.5.1.5 ASEAN
- 5.5.1.6 Rest of Asia-Pacific
- 5.5.2 North America
- 5.5.2.1 United States
- 5.5.2.2 Canada
- 5.5.2.3 Mexico
- 5.5.3 Europe
- 5.5.3.1 Germany
- 5.5.3.2 United Kingdom
- 5.5.3.3 Italy
- 5.5.3.4 France
- 5.5.3.5 Nordics
- 5.5.3.6 Rest of Europe
- 5.5.4 South America
- 5.5.4.1 Brazil
- 5.5.4.2 Argentina
- 5.5.4.3 Rest of South America
- 5.5.5 Middle East and Africa
- 5.5.5.1 Saudi Arabia
- 5.5.5.2 United Arab Emirates
- 5.5.5.3 Turkey
- 5.5.5.4 South Africa
- 5.5.5.5 Egypt
- 5.5.5.6 Rest of Middle East and Africa
- 5.5.1 Asia-Pacific
6 Competitive Landscape
- 6.1 Market Concentration
- 6.2 Strategic Moves
- 6.3 Market Share(%)/ Ranking Analysis
- 6.4 Company Profiles {(includes Global level Overview, Market level overview, Core Segments, Financials as available, Strategic Information, Market Rank/Share for key companies, Products and Services, and Recent Developments)}
- 6.4.1 AGC Inc.
- 6.4.2 Atul Ltd
- 6.4.3 BorsodChem (Wanhua Chemical Group)
- 6.4.4 Covestro AG
- 6.4.5 DCW Ltd.
- 6.4.6 Dow
- 6.4.7 Formosa Plastics Corporation
- 6.4.8 GHCL Limited
- 6.4.9 Grasim Industries Limited
- 6.4.10 Gujarat Alkalies and Chemicals Limited
- 6.4.11 Hanwha Solutions Corp.
- 6.4.12 INEOS
- 6.4.13 Nouryon
- 6.4.14 Occidental Petroleum Corporation
- 6.4.15 Olin Corporation
- 6.4.16 SABIC
- 6.4.17 Shin-Etsu Chemical Co. Ltd.
- 6.4.18 Tata Chemicals Ltd.
- 6.4.19 Tosoh Corporation
- 6.4.20 Westlake Corporation
- 6.4.21 Xinjiang Zhongtai Chemical Co. Ltd.
7 Market Opportunities and Future Outlook
- 7.1 Rising Demand for Sodium-Ion Batteries Sector
- 7.2 Increasing Demand for Energy-efficient Production Processes
- 7.3 White-space and Unmet-need Assessment
 苛性鈉市場:依生產流程、形態、純度、應用及分銷通路分類-2026-2032年全球市場預測
 苛性鈉市場規模、佔有率、趨勢和預測:按產品類型、製造流程、等級、應用和地區分類,2026-2034年
 苛性鈉市場分析及預測(至2035年):類型、產品類型、應用、最終用戶、技術、形態、製程、安裝類型、組件
 全球苛性鈉市場規模、佔有率、趨勢和成長分析報告(2026-2034)
 2026年全球苛性鈉市場報告按產量、產品類型、應用和最終用途苛性鈉和尿素市場-2026年至2032年全球預測
 歐洲苛性鈉:市場佔有率分析、產業趨勢、統計數據和成長預測(2026-2031)
 按應用和地區苛性鈉市場規模、佔有率和成長分析 - 2026-2033 年產業預測
 全球苛性鈉市場預測至2032年:依生產流程、形態、等級、通路、應用及地區分類的分析
 苛性鈉市場規模、佔有率、趨勢分析報告:按應用、地區、細分市場、預測,2025 年至 2033 年