


 |
市場調查報告書
商品編碼
1693808
西班牙資料中心:市場佔有率分析、產業趨勢與成長預測(2025-2030 年)Spain Data Center - Market Share Analysis, Industry Trends & Statistics, Growth Forecasts (2025 - 2030) |
||||||
※ 本網頁內容可能與最新版本有所差異。詳細情況請與我們聯繫。
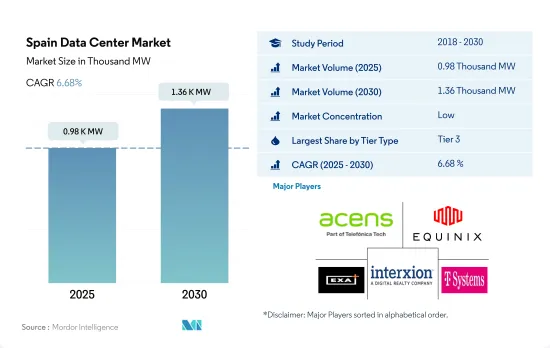
西班牙資料中心市場規模預計在 2025 年達到 980MW,預計 2030 年達到 1,360MW,複合年成長率為 6.68%。
預計主機託管收益將在 2025 年達到 9.638 億美元,到 2030 年將達到 17.165 億美元,預測期內(2025-2030 年)的複合年成長率為 12.24%。
預計到 2023 年,Tier 3 資料中心將佔據容量的大部分佔有率,並在整個預測期內保持主導地位。
- 2023年,西班牙Tier 3資料中心的IT負載容量預計將達到481.89MW,到2029年將超過795.09MW,複合年成長率為8.7%。另一方面,預計 Tier 4 資料中心的複合年成長率為 14.45%,到 2029 年容量將達到 547.68MW。
- 未來幾年,預計一級和二級發電設施的成長速度將逐漸放緩,並因長時間的非計畫停駛而負成長。此外,這些資料中心將擁有單一冷卻和供電通道,預計運轉率為 99.671%。這些資料中心比 Tier 3 和 Tier 4 設施便宜,但其容量較低意味著最終用戶擴大選擇後者。
- 到 2029 年,預計三級和四級市場的佔有率將分別達到 58.8% 和 40.5%。預計 2023 年對 Tier 3 設施的需求最高,佔 65.8% 的市場佔有率。三級資料中心因其現場服務、電力和冷卻冗餘等特點而最受歡迎。 BFSI、電信以及媒體和娛樂消費者主要使用批發和超大規模主機託管設施,大大推動了 Tier 3 設施的使用。
- 預計該國數付款用戶數將從 2022 年的 3,235 萬增至 2027 年的 4,060 萬人。預計未來幾年 Tier 4 資料中心將顯著成長。大型企業偏好 Tier 4 資料中心,因為它們具有容錯能力強、停機時間短、執行時間99.99%。此外,隨著越來越多的企業採用雲端基礎的服務,對配備最新技術的主機託管空間的 3 級和 4 級設施的需求可能會成長。
西班牙資料中心市場的趨勢
智慧型手機擁有量和應用程式下載量的增加正在推動市場成長
- 2022 年西班牙智慧型手機用戶數為 4,251 萬,預計到 2029 年將達到 4,660 萬,預測期內複合年成長率為 1.3%。西班牙的數位化應用正在迅速成長。網路和行動科技在各行各業的快速應用正在影響消費者的行為。 2021年西班牙的消費者支出為8,027.9億美元,較2020年成長12.04%。因此,更多的人能夠購買智慧型手機,智慧型手機的使用率也在上升。
- 未來幾年,隨著 5G 技術在西班牙的推廣,預計擁有能夠使用新技術的智慧型手機的人數比例將會增加。西班牙有四家通訊業者:四家公司擁有 5G 客戶:Movistar、Orange、Vodafone 和 Yoigo。使用這些電信商網路、5G 智慧型手機和 5G費率方案的消費者有 9.6% 到 10.6% 的時間連接到 5G 網路。
- 疫情加速了西班牙走向數位化的進程。 WhatsApp 是 95.05% 的西班牙人使用的社群媒體平台,其次是 Instagram、Facebook 和 YouTube。我每天花 3-4 個小時在這些應用程式上。為了維持非接觸式服務,公共機構和私人企業已轉向數位平台。
- 這一趨勢在金融領域尤其明顯,西班牙人越來越依賴網路銀行。例如,目前有 36.4% 的銀行用戶每天或幾乎每天都使用網路銀行應用程式,高於疫情前的 17.3%。因此,智慧型手機產生的大量數據正在推動西班牙資料中心數量的增加。
FTTx 寬頻和光纖網路的使用增加將推動市場需求
- 銅線網路連線的最大速度為 62.8Mbps,而光纖網路連線的最大速度為 134.6Mbps。 2022 年的 FTTx 寬頻資料速度為 159.2 Mbps,而預期 2029 年的速度為 1,342 Mbps。資料中心加速工作的目標是提供更高的網路連線性,並隨著頻寬需求的變化實現簡單、靈活的可擴展性。隨著越來越多的人使用網際網路,對資料儲存的需求不斷成長,處理設施的容量也在不斷成長。
- 直到 2020 年,DSL 一直是西班牙最受歡迎的選擇,但此後連接性一直在下降。 DSL 網路的衰落表明西班牙通訊業者優先部署新的 FTTP,而不是升級其銅線網路。 DSL 覆蓋率下降的趨勢是逐步淘汰和家庭數量增加的結果。到 2020 年,隨著西班牙營運商擴展其 FTTP 網路基礎設施,FTTP 覆蓋率將提高 4.6%,84.9% 的家庭將可以使用 FTTP 寬頻服務。
- 三大通訊業者控制西班牙大部分的光纖網路。通訊業者正在透過更快的網路滿足用戶日益成長的頻寬需求。在Gigabit速度連線方面,隨著 FTTP 的可用性不斷提高,西班牙是領先的國家之一。西班牙的國家寬頻計劃主要側重於農村地區,因為都市區的 FTTP 覆蓋率已經很高,這正在推動農村 FTTP 的覆蓋和擴展。
西班牙資料中心產業概況
西班牙資料中心市場細分化,前五大公司佔35.82%。該市場的主要企業包括 Acens Technologies SL、Equinix Inc.、EXA Infrastructure、Interxion(Digital Reality Trust Inc.)和 T-Systems International GmbH。
其他福利
- Excel 格式的市場預測 (ME) 表
- 3個月的分析師支持
目錄
第1章執行摘要和主要發現
第2章 報告要約
第3章 引言
- 研究假設和市場定義
- 研究範圍
- 調查方法
第4章 市場展望
- 負載能力
- 占地面積
- 主機代管收入
- 安裝機架數量
- 機架空間利用率
- 海底電纜
第5章 產業主要趨勢
- 智慧型手機用戶數量
- 每部智慧型手機的數據流量
- 行動數據速度
- 寬頻數據速度
- 光纖連接網路
- 法律規範
- 西班牙
- 價值鍊和通路分析
第6章市場區隔
- 熱點
- 馬德里
- 其他中東和非洲地區
- 資料中心規模
- 大規模
- 超大規模
- 中等規模
- 超大規模
- 小規模
- 等級類型
- 1級和2級
- 第 3 層
- 第 4 層
- 吸收量
- 未使用
- 使用
- 按主機託管類型
- 超大規模
- 零售
- 批發的
- 按最終用戶
- BFSI
- 雲
- 電子商務
- 政府
- 製造業
- 媒體與娛樂
- 電信
- 其他
第7章競爭格局
- 市場佔有率分析
- 商業狀況
- 公司簡介
- Acens Technologies SL
- Adam Ecotech SA
- Data4
- Digital Data Centre Bidco SL(Nabiax)
- Equinix Inc.
- EXA Infrastructure
- Global Switch Holdings Limited
- Interxion(Digital Reality Trust Inc.)
- NetActuate Inc.
- T-Systems International GmbH
- VPS House Technology Group LLC
- Zenlayer Inc.
第8章:CEO面臨的關鍵策略問題
第9章 附錄
- 世界概況
- 概述
- 五力分析框架
- 全球價值鏈分析
- 全球市場規模和DRO
- 資訊來源及延伸閱讀
- 圖表清單
- 關鍵見解
- 數據包
- 詞彙表
The Spain Data Center Market size is estimated at 0.98 thousand MW in 2025, and is expected to reach 1.36 thousand MW by 2030, growing at a CAGR of 6.68%. Further, the market is expected to generate colocation revenue of USD 963.8 Million in 2025 and is projected to reach USD 1,716.5 Million by 2030, growing at a CAGR of 12.24% during the forecast period (2025-2030).
Tier 3 data center accounted for majority share in terms of volume in 2023, and is expected to dominate through out the forecasted period
- In 2023, the IT load capacity of tier 3 data centers in Spain is expected to reach 481.89 MW and then register a CAGR of 8.7% to surpass 795.09 MW by 2029. Conversely, tier 4 data centers are predicted to record a CAGR of 14.45%, reaching a capacity of 547.68 MW by 2029.
- Over the coming years, facilities in tiers 1 and 2 will gradually slow down and exhibit negative growth, resulting from lengthy and irregular outages. Additionally, they possess a single channel for cooling and electricity, with a predicted uptime of 99.671%. Although these data centers are less expensive than tier 3 and tier 4 facilities, their reduced capability is prompting end users to increasingly opt for tier 3 and tier 4 facilities.
- In 2029, tier 3 and tier 4 facilities are expected to hold major shares of 58.8% and 40.5%, respectively. The year 2023 will witness the highest demand for tier 3 facilities, which are expected to hold a market share of 65.8%. Owing to features like onsite service, power, and cooling redundancy, tier 3 data centers are the most popular. BFSI, telecom, media, and entertainment consumers are primarily using wholesale and hyperscale colocation facilities, driving significant tier 3 facility usage.
- The number of digital payment users in the country is projected to reach 40.6 million by 2027, up from 32.35 million users in 2022. Tier 4 data centers are expected to experience significant growth over the coming years. Large businesses prefer tier 4 data centers due to their fault-tolerant capabilities, reduced downtime, and 99.99% uptime. Additionally, as more companies adopt cloud-based services, the demand for tier 3 and tier 4 facilities to offer colocation space with the latest technology will increase.
Spain Data Center Market Trends
Rising smartphone ownership and increase in number of app downloads boost the market growth
- The total number of smartphone users in the country was 42.51 million in 2022, which is expected to reach 46.6 million by 2029, witnessing a CAGR of 1.3% during the forecast period. In Spain, digital usage is growing quickly. The swift uptake of the internet and mobile technology in a range of enterprises has had an impact on consumer behavior. Consumer spending in Spain was USD 802.79 billion in 2021, a 12.04% increase from 2020. Thus, more people can now buy smartphones, increasing the usage of smartphones.
- Over the next several years, it is anticipated that when 5G technology is deployed throughout Spain, a greater proportion of people will have smartphones that can use the new technology. Spain has four operators: Movistar, Orange, Vodafone, and Yoigo, which have 5G customers. With a 5G smartphone and a 5G tariff plan, consumers on these operators' networks spent 9.6-10.6% of their time connected to a 5G network.
- The pandemic accelerated Spain's move toward digitalization. WhatsApp was the social media platform 95.05% of Spaniards utilized, followed by Instagram, Facebook, and YouTube. They spent three to four hours a day on these applications. In order to maintain contactless services, public and private organizations switched to digital platforms, which increased the need for data center services in Spain.
- This tendency has been especially noticeable in the financial sector, as Spaniards are becoming more dependent on online banking. For instance, compared to 17.3% before the pandemic, 36.4% of banking service users now utilize their online banking applications every day or virtually daily. As a result, the number of data centers in Spain has increased due to the large amount of data generated by smartphones.
Increase usage of FTTx broadband and fiber optic network lead to market demand
- The maximum speed of a copper-based internet connection is 62.8 Mbps, whereas the maximum speed of a fiber-optic internet connection is 134.6 Mbps. Compared to the expected speed of 1,342 Mbps in 2029, the FTTx broadband data speed in 2022 stood at 159.2 Mbps. The goal of data centers' efforts to become faster is to provide higher network connections and simple and flexible scalability as bandwidth demands change on a moment-by-moment basis. More people use the internet, which necessitates data storage that is increasing in size and boosting the volume of processing facilities.
- DSL remained the most prevalent technology in Spain till 2020, while its connectivity has decreased since then. The decline of DSL networks demonstrated that Spanish operators prioritize brand-new FTTP deployments over upgrading copper networks. The trend of declining DSL coverage is the result of both targeted decommissioning and a rise in the number of households. By 2020, 84.9% of homes had access to FTTP broadband services, owing to Spanish operators' expansion of their FTTP network infrastructure, which saw a 4.6% increase in FTTP coverage.
- Three major operators control the majority of Spain's extensive fiber optic network. Telecom companies better fulfill users' rising bandwidth demands with a quicker network. In terms of gigabit-speed connectivity, Spain is among the top countries, owing to the ongoing improvements in FTTP availability. The Spanish national broadband plan focused primarily on rural areas, given an already high FTTP coverage in urban areas, which is the driving rural FTTP coverage and expansion.
Spain Data Center Industry Overview
The Spain Data Center Market is fragmented, with the top five companies occupying 35.82%. The major players in this market are Acens Technologies SL, Equinix Inc., EXA Infrastructure, Interxion (Digital Reality Trust Inc.) and T-Systems International GmbH (sorted alphabetically).
Additional Benefits:
- The market estimate (ME) sheet in Excel format
- 3 months of analyst support
TABLE OF CONTENTS
1 EXECUTIVE SUMMARY & KEY FINDINGS
2 REPORT OFFERS
3 INTRODUCTION
- 3.1 Study Assumptions & Market Definition
- 3.2 Scope of the Study
- 3.3 Research Methodology
4 MARKET OUTLOOK
- 4.1 It Load Capacity
- 4.2 Raised Floor Space
- 4.3 Colocation Revenue
- 4.4 Installed Racks
- 4.5 Rack Space Utilization
- 4.6 Submarine Cable
5 Key Industry Trends
- 5.1 Smartphone Users
- 5.2 Data Traffic Per Smartphone
- 5.3 Mobile Data Speed
- 5.4 Broadband Data Speed
- 5.5 Fiber Connectivity Network
- 5.6 Regulatory Framework
- 5.6.1 Spain
- 5.7 Value Chain & Distribution Channel Analysis
6 MARKET SEGMENTATION (INCLUDES MARKET SIZE IN VOLUME, FORECASTS UP TO 2030 AND ANALYSIS OF GROWTH PROSPECTS)
- 6.1 Hotspot
- 6.1.1 Madrid
- 6.1.2 Rest of Spain
- 6.2 Data Center Size
- 6.2.1 Large
- 6.2.2 Massive
- 6.2.3 Medium
- 6.2.4 Mega
- 6.2.5 Small
- 6.3 Tier Type
- 6.3.1 Tier 1 and 2
- 6.3.2 Tier 3
- 6.3.3 Tier 4
- 6.4 Absorption
- 6.4.1 Non-Utilized
- 6.4.2 Utilized
- 6.4.2.1 By Colocation Type
- 6.4.2.1.1 Hyperscale
- 6.4.2.1.2 Retail
- 6.4.2.1.3 Wholesale
- 6.4.2.2 By End User
- 6.4.2.2.1 BFSI
- 6.4.2.2.2 Cloud
- 6.4.2.2.3 E-Commerce
- 6.4.2.2.4 Government
- 6.4.2.2.5 Manufacturing
- 6.4.2.2.6 Media & Entertainment
- 6.4.2.2.7 Telecom
- 6.4.2.2.8 Other End User
7 COMPETITIVE LANDSCAPE
- 7.1 Market Share Analysis
- 7.2 Company Landscape
- 7.3 Company Profiles (includes Global Level Overview, Market Level Overview, Core Business Segments, Financials, Headcount, Key Information, Market Rank, Market Share, Products and Services, and Analysis of Recent Developments).
- 7.3.1 Acens Technologies SL
- 7.3.2 Adam Ecotech SA
- 7.3.3 Data4
- 7.3.4 Digital Data Centre Bidco SL (Nabiax)
- 7.3.5 Equinix Inc.
- 7.3.6 EXA Infrastructure
- 7.3.7 Global Switch Holdings Limited
- 7.3.8 Interxion (Digital Reality Trust Inc.)
- 7.3.9 NetActuate Inc.
- 7.3.10 T-Systems International GmbH
- 7.3.11 VPS House Technology Group LLC
- 7.3.12 Zenlayer Inc.
- 7.4 LIST OF COMPANIES STUDIED
8 KEY STRATEGIC QUESTIONS FOR DATA CENTER CEOS
9 APPENDIX
- 9.1 Global Overview
- 9.1.1 Overview
- 9.1.2 Porter's Five Forces Framework
- 9.1.3 Global Value Chain Analysis
- 9.1.4 Global Market Size and DROs
- 9.2 Sources & References
- 9.3 List of Tables & Figures
- 9.4 Primary Insights
- 9.5 Data Pack
- 9.6 Glossary of Terms
 中東資料中心:市場佔有率分析、產業趨勢與統計、成長預測(2026-2031)印尼資料中心市場佔有率分析、產業趨勢與統計、成長預測(2026-2031)
 日本資料中心市場報告(按組件、類型、企業規模、最終用戶和地區分類,2026-2034 年)
 資料中心市場規模、佔有率和趨勢分析報告:按組件、類型、伺服器機架密度、冗餘、PUE、設計、層級、企業規模、最終用途、地區和細分市場預測(2026-2033 年)
 小型資料中心市場按產品類型、功率容量、部署應用、冷卻技術和地區分類
 資料中心基礎設施管理市場規模、佔有率和成長分析(按產品、功能、資料中心規模、層級類型、資料中心、應用和地區分類)-2026-2033年產業預測
 資料中心市場規模、佔有率和成長分析(按產品、類型、規模、資料中心冗餘、最終用戶產業和地區分類)-2026-2033年產業預測
 2025年全球資料中心資訊技術(IT)設備市場報告2025年全球資料中心遷移市場報告2025年全球配置自動化市場報告