


 |
市場調查報告書
商品編碼
1693774
亞太有機肥料:市場佔有率分析、行業趨勢和成長預測(2025-2030 年)Asia-Pacific Organic Fertilizer - Market Share Analysis, Industry Trends & Statistics, Growth Forecasts (2025 - 2030) |
||||||
※ 本網頁內容可能與最新版本有所差異。詳細情況請與我們聯繫。
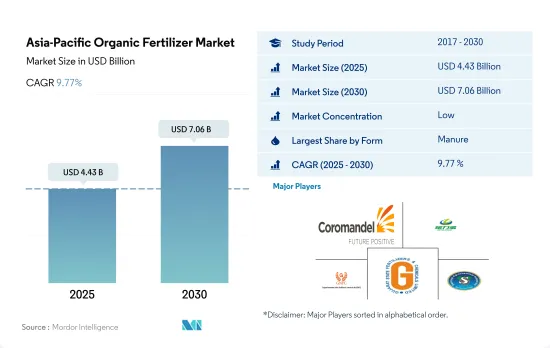
亞太有機肥料市場規模預計在 2025 年為 44.3 億美元,預計到 2030 年將達到 70.6 億美元,預測期內(2025-2030 年)的複合年成長率為 9.77%。
- 有機肥料是亞太地區消耗量最大的農業生物肥料。預計到2022年,有機肥料將佔亞太地區農業生技藥品市值的約45.8%,主要歸功於其在有機和傳統農業中的大規模使用。
- 在該地區,堆肥在傳統農業和有機農業中都占主導地位,因為它適用於所有類型的作物,主要是田間作物、經濟作物、水果和蔬菜,2022 年的市場規模為 16.7 億美元。肥料也用於在播種前改善土壤的理化性質,並根據需要在作物生長的不同階段使用。
- 2022 年,餐食基有機肥的消費量價值為 9.274 億美元。這些肥料的養分含量高於糞肥。血粉和鹿角粉等粉狀肥料的磷含量比其他粉狀肥料高,是經濟作物的理想選擇。
- 2022年油餅有機肥消費量價值1,870萬美元。這些肥料非常適合園藝作物,因為它們能緩慢釋放營養。
- 印度和中國等該地區領先的農業國家已經啟動了各種計畫和方案來推廣有機農業和永續農業投入的應用。 2023 年至 2029 年期間,有機作物種植面積的增加和對有機產品的需求的上升可能會推動亞太有機肥料市場的發展。
- 亞太地區正迅速成為全球有機農業和有機肥料市場的熱門地點。全部區域主要種植作物、甘蔗、新鮮水果和蔬菜等有機作物。中國和印度正在成為有機生產領域的領導者。雖然這兩個國家的有機農業面積很大,但有機農業佔其農業總面積的比例仍不到2.0%。
- 近年來,該地區有機農業面積大幅增加,從2017年的490萬公頃增加到2021年的690萬公頃。這一成長趨勢正在推動有機肥料的需求,預計到2029年將成長73.1%。
- 亞太地區大多數國家以連作物主,約佔有機作物總面積的67.7%。這項優勢將使連續作物成為有機肥料的最大消費量,到2022年將佔亞太地區有機消費量的79.7%。
- 各政府機構透過各種計劃和方案推廣有機和永續農業實踐,包括提供有機肥料補貼。預計這一趨勢將推動該地區對有機肥料的需求。
- 亞太地區的有機農業和有機肥料市場正在顯著成長。該地區有機農業面積的不斷增加,加上政府的各種激勵措施,預計將在 2023-2029 年期間推動該地區對有機肥料的需求。
亞太有機肥市場趨勢
中國、印度、印尼和澳洲等國政府的支持日益增強,有助於推動該地區的有機農業
- 根據FiBL統計,2021年亞太地區有機農地面積超過370萬公頃,佔全球有機農地面積的26.4%。 2017年至2022年間,有機種植面積增加了19.3%。截至 2020 年,該地區共有 183 萬家有機生產者,其中印度以 130 萬家位居榜首。中國、印度、印尼和澳洲是該地區有機種植面積最大的國家。中國和印度等國家的政府部門正在不斷推廣有機農業,以減少作物種植對化學物質的依賴。例如,印度實施了「Paramparagat Krishi Vikas Yojana」和「全印度有機農業網路計畫」(AI-NPOF)等計畫。
- 2021年,中國以250萬公頃的面積佔最大佔有率,為66.1%,其次是印度,為19.3%,印度尼西亞,為1.5%,澳大利亞,為1.4%。所有有機農地分為三種作物類型:連續作物、園藝作物和經濟作物。連作作物佔該地區有機土地的最大佔有率,2021 年為 67.5%,即 250 萬公頃。該地區種植的主要連作作物包括水稻、小麥、豆類、大豆和小米。
- 經濟作物將佔第二大佔有率,到2021年將達到70萬公頃,佔有機農地的18.5%。全球對糖和有機茶等有機經濟作物的需求正在增加。中國和印度分別是有機綠茶和有機紅茶的最大生產國。由於國際需求不斷成長,該地區有機種植面積預計會增加。
澳洲人均有機產品支出最高,而中國有機食品市場成長迅速
- 2021 年該地區人均有機產品支出為 85.1 美元。同年,澳洲人均有機產品支出較高,為 58.3 美元,主要是由於消費者認為有機食品更健康,導致需求增加。根據全球有機貿易的數據,2021 年澳洲有機包裝食品和飲料市場價值 8.852 億美元。
- 預計2021年中國有機食品市場將成長13.3%,並將持續維持正成長模式,2023年至2029年的複合年成長率為7.1%。預計到2025年,有機市場規模將達到64億美元,這得益於年輕一代越來越重視有機產品,以及由於職業母親數量的增加和健康保健趨勢的普及,對有機嬰兒食品的需求不斷成長。
- 印度的有機產品遠遠落後於全球需求的 1.0%,2021 年的人均支出僅 0.08 美元。然而,印度市場在未來幾年可能會繼續成長,到 2025 年將達到 1.533 億美元。目前,該地區的有機市場高度分散,只有少數超級市場和專賣店銷售有機產品。增加消費者知識和改變購買模式可能會讓人們更了解該地區有機食品的永續性。人均收入的增加和消費者對有機食品重要性的認知的提高可能會推動亞太地區人均有機食品支出的增加。
亞太有機肥產業概況
亞太有機肥市場細分化,前五大公司佔6.60%。市場的主要企業有 Coromandel International Ltd、Genliduo Bio-tech Corporation Ltd、Gujarat Narmada Valley Fertilizers & Chemicals Ltd、Gujarat State Fertilizers & Chemicals Ltd、Swaroop Agrochemical Industries 等。
其他福利
- Excel 格式的市場預測 (ME) 表
- 3個月的分析師支持
目錄
第1章執行摘要和主要發現
第2章 報告要約
第3章 引言
- 研究假設和市場定義
- 研究範圍
- 調查方法
第4章 產業主要趨勢
- 有機種植區
- 有機產品人均支出
- 法律規範
- 澳洲
- 中國
- 印度
- 印尼
- 日本
- 菲律賓
- 泰國
- 越南
- 價值鍊和通路分析
第5章市場區隔
- 形式
- 肥料
- 餐食基肥料
- 油餅
- 其他有機肥料
- 作物類型
- 經濟作物
- 園藝作物
- 田間作物
- 原產地
- 澳洲
- 中國
- 印度
- 印尼
- 日本
- 菲律賓
- 泰國
- 越南
- 其他亞太地區
第6章競爭格局
- 關鍵策略趨勢
- 市場佔有率分析
- 商業狀況
- 公司簡介
- Biolchim SpA
- Coromandel International Ltd
- Deepak Fertilisers & Petrochemicals Corp. Ltd
- Genliduo Bio-tech Corporation Ltd
- Gujarat Narmada Valley Fertilizers & Chemicals Ltd
- Gujarat State Fertilizers & Chemicals Ltd
- Prabhat Fertilizer And Chemical Works
- Shandong Nongda Fertilizer Sci.& Tech. Co. Ltd(NDFY)
- Sustane Natural Fertilizer Inc.
- Swaroop Agrochemical Industries
第7章:CEO面臨的關鍵策略問題
第 8 章 附錄
- 世界概況
- 概述
- 五力分析框架
- 全球價值鏈分析
- 市場動態(DRO)
- 資訊來源及延伸閱讀
- 圖片列表
- 關鍵見解
- 數據包
- 詞彙表
The Asia-Pacific Organic Fertilizer Market size is estimated at 4.43 billion USD in 2025, and is expected to reach 7.06 billion USD by 2030, growing at a CAGR of 9.77% during the forecast period (2025-2030).
- Organic fertilizers are the most consumed fertilizers in Asia-Pacific under agricultural biologicals. Organic fertilizers accounted for about 45.8% of the Asia-Pacific agriculture biologicals market value in 2022, mainly due to their application in bulk quantities in organic and conventional farming.
- Manure application was dominant in the region, valued at USD 1.67 billion in 2022, mainly due to its suitability to all types of crops, including field crops, cash crops, and fruits and vegetables, both in conventional and organic farming. Manures are also used to improve the physio-chemical properties of the soil before taking up the seed sowing and even at different growth stages of the crop based on the requirement.
- The consumption of meal-based organic fertilizers was valued at USD 927.4 million in 2022. These fertilizers have high nutrient content compared to manures. Meal-based fertilizers like blood and horn meal have higher phosphorus content compared to other meal-based fertilizers, and they are best suited for cash crops.
- The consumption value of oil cake organic fertilizers was valued at USD 18.7 million in 2022. These fertilizers are best suited in horticultural crops due to their slow release of nutrients.
- Major agricultural countries in the region, like India and China, have initiated various programs or schemes promoting organic farming and the application of sustainable agricultural inputs. The growing organic crop cultivation areas and the rising demand for organic commodities may drive the Asia-Pacific organic fertilizer market between 2023 and 2029.
- The Asia-Pacific region is rapidly becoming a hotspot in the global organic farming and organic fertilizer market. Major organic crops, like rice, sugarcane, and fresh fruits and vegetables, are grown across the region. China and India are emerging as leaders in organic production. While these two countries have a higher area under organic farming, it still accounts for less than 2.0% of the total agricultural area in these countries.
- The region has seen a significant increase in organic farming area over the last few years, growing from 4.9 million hectares in 2017 to 6.9 million hectares in 2021. This rising trend is driving the demand for organic fertilizers, which is estimated to increase by 73.1% by 2029.
- Row crops dominate most countries in the Asia-Pacific region, accounting for about 67.7% of the total organic crop area. This dominance resulted in row crops having the highest consumption of organic fertilizers, accounting for a 79.7% share of the Asia-Pacific region's consumption by value in 2022.
- Various government bodies are encouraging organic or sustainable farming methods through various schemes or programs, including offering incentives for organic fertilizers. This trend is expected to drive the demand for organic fertilizers in the region.
- The Asia-Pacific region is witnessing substantial growth in the organic farming and organic fertilizer market. The region's increasing organic farming area, combined with various government incentives, is expected to drive the demand for organic fertilizers in the region between 2023 and 2029.
Asia-Pacific Organic Fertilizer Market Trends
Growing government support in countries like China, India, Indonesia, and Australia, boosts organic farming in the region
- The area of organic agricultural land in Asia-Pacific was over 3.7 million ha in 2021, representing 26.4% of the global organic area, as per FiBL statistics. The organic area under cultivation grew by 19.3% between 2017-2022. As of 2020, the region had 1.83 million organic producers, with India topping the list with 1.3 million organic producers. China, India, Indonesia, and Australia are the major countries with large organic cultivation areas in the region. Government authorities in countries like China and India are constantly promoting organic agriculture to reduce reliance on chemical inputs for crop cultivation. For instance, India has implemented schemes like Paramparagat Krishi Vikas Yojana and the All India Network Programme on Organic Farming (AI-NPOF).
- In 2021, China accounted for a maximum share of 66.1%, with 2.5 million ha, followed by India, Indonesia, and Australia, with 19.3%, 1.5%, and 1.4%, respectively. The total organic land is divided into three crop types, namely row crops, horticultural crops, and cash crops. Row crops occupy a major share of organic agricultural land in the region, accounting for 67.5% share, i.e., 2.5 million ha in 2021. The major row crops grown in the region include paddy, wheat, pulses, soybeans, and millets.
- Cash crops held the second largest share, with 0.7 million ha in 2021, accounting for an 18.5% share of organic cropland. The demand for organic cash crops like sugar and organic tea is increasing worldwide. China and India are the largest organic green and black tea producers, respectively. The growing international demand is expected to increase the organic acreages in the region.
Per capita spending on organic product predominant in Australia and China's organic food market growing significantly
- The per capita spending on organic products in the region was recorded at USD 85.1 in 2021. Australia witnessed a higher per capita spending on organic products, with USD 58.3 in the same year, attributed to the higher demand due to consumers' perception of organic food as healthy. As per the Global Organic Trade data, the organic packaged food and beverage market in Australia was valued at USD 885.2 million in 2021.
- China's organic food market grew by 13.3% in 2021, and the positive growth pattern is expected to continue, with a CAGR of 7.1% between 2023 and 2029. With an increasing emphasis on the importance of organic products among the younger generation and the rising demand for organic baby food due to the growing number of mothers in the workforce and the increasing adoption of the health and wellness trend, organic products are expected to reach a value of USD 6.4 billion by 2025.
- Organic products in India represent far less than 1.0% of global demand, with a per capita expenditure of just USD 0.08 in 2021. However, the Indian market may grow over the coming years, reaching a value of USD 153.3 million by 2025. Currently, the region's organic goods market is highly fragmented, with just a few supermarkets and specialty stores selling them, as people from higher-income families are the only potential customers. Growing consumer knowledge and changing buying patterns may lead to a better understanding of organic food sustainability in the region. Increasing per capita income and increased consumer awareness of the importance of organic food can raise per capita expenditure on organic food items in the Asia-Pacific region.
Asia-Pacific Organic Fertilizer Industry Overview
The Asia-Pacific Organic Fertilizer Market is fragmented, with the top five companies occupying 6.60%. The major players in this market are Coromandel International Ltd, Genliduo Bio-tech Corporation Ltd, Gujarat Narmada Valley Fertilizers & Chemicals Ltd, Gujarat State Fertilizers & Chemicals Ltd and Swaroop Agrochemical Industries (sorted alphabetically).
Additional Benefits:
- The market estimate (ME) sheet in Excel format
- 3 months of analyst support
TABLE OF CONTENTS
1 EXECUTIVE SUMMARY & KEY FINDINGS
2 REPORT OFFERS
3 INTRODUCTION
- 3.1 Study Assumptions & Market Definition
- 3.2 Scope of the Study
- 3.3 Research Methodology
4 KEY INDUSTRY TRENDS
- 4.1 Area Under Organic Cultivation
- 4.2 Per Capita Spending On Organic Products
- 4.3 Regulatory Framework
- 4.3.1 Australia
- 4.3.2 China
- 4.3.3 India
- 4.3.4 Indonesia
- 4.3.5 Japan
- 4.3.6 Philippines
- 4.3.7 Thailand
- 4.3.8 Vietnam
- 4.4 Value Chain & Distribution Channel Analysis
5 MARKET SEGMENTATION (includes market size in Value in USD and Volume, Forecasts up to 2030 and analysis of growth prospects)
- 5.1 Form
- 5.1.1 Manure
- 5.1.2 Meal Based Fertilizers
- 5.1.3 Oilcakes
- 5.1.4 Other Organic Fertilizers
- 5.2 Crop Type
- 5.2.1 Cash Crops
- 5.2.2 Horticultural Crops
- 5.2.3 Row Crops
- 5.3 Country
- 5.3.1 Australia
- 5.3.2 China
- 5.3.3 India
- 5.3.4 Indonesia
- 5.3.5 Japan
- 5.3.6 Philippines
- 5.3.7 Thailand
- 5.3.8 Vietnam
- 5.3.9 Rest of Asia-Pacific
6 COMPETITIVE LANDSCAPE
- 6.1 Key Strategic Moves
- 6.2 Market Share Analysis
- 6.3 Company Landscape
- 6.4 Company Profiles (includes Global Level Overview, Market Level Overview, Core Business Segments, Financials, Headcount, Key Information, Market Rank, Market Share, Products and Services, and Analysis of Recent Developments).
- 6.4.1 Biolchim SpA
- 6.4.2 Coromandel International Ltd
- 6.4.3 Deepak Fertilisers & Petrochemicals Corp. Ltd
- 6.4.4 Genliduo Bio-tech Corporation Ltd
- 6.4.5 Gujarat Narmada Valley Fertilizers & Chemicals Ltd
- 6.4.6 Gujarat State Fertilizers & Chemicals Ltd
- 6.4.7 Prabhat Fertilizer And Chemical Works
- 6.4.8 Shandong Nongda Fertilizer Sci.&Tech. Co. Ltd (NDFY)
- 6.4.9 Sustane Natural Fertilizer Inc.
- 6.4.10 Swaroop Agrochemical Industries
7 KEY STRATEGIC QUESTIONS FOR AGRICULTURAL BIOLOGICALS CEOS
8 APPENDIX
- 8.1 Global Overview
- 8.1.1 Overview
- 8.1.2 Porter's Five Forces Framework
- 8.1.3 Global Value Chain Analysis
- 8.1.4 Market Dynamics (DROs)
- 8.2 Sources & References
- 8.3 List of Tables & Figures
- 8.4 Primary Insights
- 8.5 Data Pack
- 8.6 Glossary of Terms
 全球有機肥市場:預測(至2032年)-按來源、形態、營養成分、作物類型、施用方法、最終用戶和地區進行分析
 有機肥料市場(按最終用戶、銷售管道、配方、產品形式、供應來源和應用分類)—2025-2032 年全球預測有機農藥市場依產品類型、作物類型、配方、施用方法及通路分類-2025-2032年全球預測
 2025年全球有機肥料市場報告全球綠肥市場報告(2025年)植物性有機肥市場(依產品類型、作物類型、施用方式、包裝類型及通路分類)-2025-2030 年全球預測
 有機肥市場-全球產業規模、佔有率、趨勢、機會及預測(按來源、作物類型、形態、地區和競爭情況分類,2020-2030 年)
 有機肥市場規模、佔有率、成長分析(按來源、按作物類型、按形態、按應用類型、按地區)- 產業預測,2025-2032
 全球有機肥料市場:產業分析、規模、佔有率、成長、趨勢與預測(2025-2032)
 有機肥市場規模、佔有率、趨勢分析報告(按來源、形態、作物類型、地區、細分市場預測,2025-2030 年)