


 |
市場調查報告書
商品編碼
1693751
美國農業生技藥品:市場佔有率分析、產業趨勢、統計數據、成長預測(2025-2030 年)United States Agricultural Biologicals - Market Share Analysis, Industry Trends & Statistics, Growth Forecasts (2025 - 2030) |
||||||
價格
※ 本網頁內容可能與最新版本有所差異。詳細情況請與我們聯繫。
簡介目錄
美國農業生技藥品市場規模預計在 2025 年為 35.5 億美元,預計到 2030 年將達到 64.8 億美元,預測期內(2025-2030 年)的複合年成長率為 12.81%。
- 2022年,作物保護劑引領美國農業生技藥品市場,規模達13.5億美元。生物農藥是美國農業生技藥品市場消費最多的產品,2022年在作物保護領域佔最大佔有率,達83.5%。生物農藥在生物農藥領域占主導地位,用於控制病原真菌引起的植物疾病。生物殺菌劑要么來自微生物,要么植物來源。預計生物殺菌劑子區隔的市場規模在 2022 年將達到 6.509 億美元,佔同年 49.5% 的市場佔有率,成為消費量最大的生物農藥類型。
- 預計 2022 年美國生物殺蟲劑子區隔市場規模為 4.039 億美元,市佔率為 30.7%。它是第二大消費量生物農藥。
- 2022年,作物營養在美國農業生技藥品市場中佔11.5億美元。 2022年美國農業生技藥品市場中,有機肥料是作物營養領域的最大消費者。化肥是美國消費量最大的有機肥料,2022 年佔最大,達 46.7%。堆肥可以是植物來源的,也可以是動物基的,由分解植物或動物廢物(如糞肥)製成,通常富含有機物。動物或植物廢棄物堆肥、農地肥料和綠肥是農業中常用的類型。
- 農民對過度使用化學肥料的認知不斷提高,政府支持永續和有機農業實踐的舉措正在推動對基於作物營養的農業生技藥品的需求。因此,預計市場將從 2023 年到 2029 年成長。
美國農業生技藥品市場趨勢
依照國家法律法規增加有機種植面積,特別是連續作物
- 過去二十年來,美國的有機農業取得了顯著發展,這主要歸功於具體立法的訂定。 2021年,美國有623,000公頃土地採用有機耕作。
- 加州是美國最大的農產品生產州,也是有機生產的領導者,擁有 3,000 多個有機農場。相較而言,其他幾個州用於有機農業的土地面積比加州更大,而加州的有機農業土地面積僅佔其農田面積的 4% 左右。相反,有機農民數量最多的州是緬因州、紐約州和佛蒙特州等東北部各州。
- 耕地作物是美國有機作物的主導。 2021年,其占有機農地總面積的約71.8%。穀類生產占主導地位。主要糧食作物有玉米、小麥、稻米、小米。有機產品的消費在美國消費者中越來越流行,越來越多的消費者因其各種健康益處而選擇有機食品。
- 有機園藝作物種植總面積呈上升趨勢,從 2017 年的 112,900 公頃增加到 2021 年的 156,100 公頃。就 2021 年國內產量而言,前五的水果和蔬菜分別是蘋果(31.1%)、草莓(9.5%)、柳橙(6.9%)、羅馬生菜(6.7%)和馬鈴薯(6.2%)。在貿易方面,進口量最大的產品是香蕉(53.1%)、酪梨(7.7%)、芒果(5.8%)、藍莓(5.0%)和南瓜(4.3%),出口量最大的產品是蘋果(80.0%)、梨子(14.4%)、櫻桃(4.0%)、洋蔥乾(1.5%)。
對有機農產品的需求不斷增加,尤其是在水果和蔬菜領域,人均有機食品支出也在增加
- 美國是世界最大的有機產品消費國。根據《營養商業日誌》(NBJ,2021 年)的數據,2020 年該國有機食品總銷售額為 516 億美元。 2021年,美國是北美地區人均有機產品支出最高的國家,相當於158美元。
- 自有機食品零售業誕生以來,有機新鮮水果和蔬菜一直是有機食品的主要類別。 2020年,這些有機產品的零售額價值200億美元,顯示對有機農產品的需求不斷增加。過去20年來,對有機新鮮水果和蔬菜的需求穩步上升。有機食品銷售的成長是由於消費者意識的增強,尤其是高所得族群。需求量最大的有機食品類別包括雞蛋、乳製品、水果和蔬菜等主食。
- 不同人群和地區的人們對有機食品的偏好各不相同。 18-29 歲的年輕人比 65 歲以上的老年人更有可能想要有機產品(超過 50%)。收入和地區也起著一定的作用,42% 的收入低於 30,000 美元的人想要有機產品,而 49% 的收入超過 75,000 美元的人想要有機產品。
- 美國的人均有機產品支出正在增加,2017 年至 2021 年的複合年成長率為 5.2%。對有機產品的需求不斷成長,為美國有機生產商創造了機會,使其能夠進入國內和國際高價值市場。有機產品的價格溢價是低收入消費者消費有機食品的主要限制因素之一。
美國農業生技藥品產業概況
美國農業生技藥品市場細分化,前五大公司佔6.56%的市佔率。該市場的主要企業包括 Bioworks Inc.、Cedar Grove Composting Inc.、Certis USA LLC、Corteva Agriscience、Novozymes 等。
其他福利
- Excel 格式的市場預測 (ME) 表
- 3個月的分析師支持
目錄
第1章執行摘要和主要發現
第2章 報告要約
第3章 引言
- 研究假設和市場定義
- 研究範圍
- 調查方法
第4章 產業主要趨勢
- 有機種植區
- 有機產品人均支出
- 法律規範
- 美國
- 價值鍊和通路分析
第5章市場區隔
- 功能
- 作物營養
- 生物肥料
- 固氮螺菌
- 固氮菌
- 菌根真菌
- 解磷細菌
- 根瘤菌
- 其他生物肥料
- 生物肥料
- 胺基酸
- 富裡酸
- 腐植酸
- 蛋白質水解物
- 海藻萃取物
- 其他生物刺激素
- 有機肥
- 肥料
- 餐食基肥料
- 油餅
- 其他有機肥料
- 作物保護
- 生物防治劑
- 大型微生物
- 微生物
- 生物防治劑
- 生物真菌劑
- 生物除草劑
- 生物殺蟲劑
- 其他生物防治劑
- 作物營養
- 作物類型
- 經濟作物
- 園藝作物
- 耕地作物
第6章 競爭格局
- 重大策略舉措
- 市場佔有率分析
- 商業狀況
- 公司簡介
- Andermatt Group AG
- Bioline AgroSciences Ltd
- Bioworks Inc.
- Cedar Grove Composting Inc.
- Certis USA LLC
- Corteva Agriscience
- Koppert Biological Systems Inc.
- Novozymes
- Sustane Natural Fertilizer Inc.
- Symborg Inc.
第7章:CEO面臨的關鍵策略問題
第 8 章 附錄
- 世界概況
- 概述
- 五力分析框架
- 全球價值鏈分析
- 市場動態(DRO)
- 資訊來源及延伸閱讀
- 圖片列表
- 關鍵見解
- 數據包
- 詞彙表
簡介目錄
Product Code: 500011
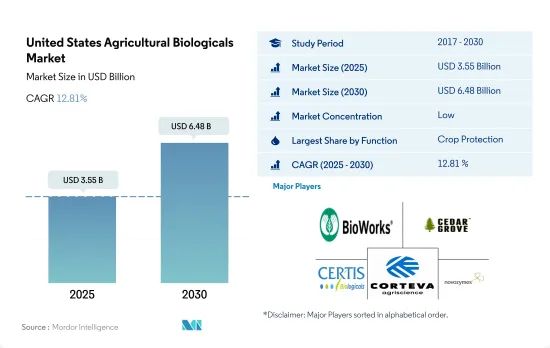
The United States Agricultural Biologicals Market size is estimated at 3.55 billion USD in 2025, and is expected to reach 6.48 billion USD by 2030, growing at a CAGR of 12.81% during the forecast period (2025-2030).
- In 2022, crop protection led the US agricultural biologicals market, accounting for USD 1.35 billion. Biopesticides are the most consumed in the US agricultural biologicals market and accounted for a maximum share of 83.5% in the crop protection segment in 2022. Biofungicides dominate the biopesticides segment and are used to control plant diseases that are caused by pathogenic fungi. Biofungicides may be of microbial or botanical origin. The biofungicides sub-segment was valued at USD 650.9 million in 2022, and they are the most consumed biopesticide type, with a market share of 49.5% in the same year.
- The bioinsecticides sub-segment in the United States was valued at USD 403.9 million in 2022, and it accounted for a share of 30.7%. They are the second-most consumed biopesticides.
- Crop nutrients accounted for USD 1.15 billion in the US agricultural biologicals market in 2022. Organic fertilizers were the most consumed in the US agricultural biologicals market in the crop nutrition segment in 2022. Manures are the most consumed organic fertilizer in the United States, accounting for a maximum share of 46.7% in 2022. Manures can be of plant or animal origin, and they are a decomposed form of plant or animal waste like excreta, generally rich in organic matter. Animal or plant waste compost manure, farmyard manure, and green manure are the common types used in agriculture.
- The increasing awareness about the overuse of fertilizers among farmers and the government initiatives to support sustainable agricultural practices and organic farming resulted in a rising demand for crop nutrition-based agricultural biologicals. Therefore, the market is anticipated to increase between 2023 and 2029.
United States Agricultural Biologicals Market Trends
Increase in organic area, particularly in row crops, due to country's laws and regulations
- Organic agriculture in the United States has increased significantly over the last 20 years, owing mostly to the introduction of particular laws and regulations. In 2021, the area under organic agricultural farming in the United States was 623 thousand hectares.
- California is the nation's top state for agricultural sales overall, and it is also the leader in organic production, with more than 3,000 organic farms. In relative terms, several other states devote a greater share of their farmland to organic farming than California, where organic farms represent only about 4% of the state's agricultural acreage. Instead, the list of top states for organic farms on a relative basis is led by northeastern states, including Maine, New York, and Vermont.
- Row crops dominate organic farming in the nation. In 2021, they accounted for about 71.8% of all organic cropland. The production of cereal crops predominates. The main cereals include maize, wheat, rice, and millet. The consumption of organic products has become popular among US consumers, who increasingly choose to eat organic foods because of their various health benefits.
- An increasing trend was observed in the overall organic horticulture crop cultivation area, from 112.9 thousand hectares in 2017 to 156.1 thousand hectares in 2021. Regarding domestic production in 2021, the top five fruits and vegetables were apples (31.1%), strawberries (9.5%), oranges (6.9%), romaine lettuce (6.7%), and potatoes (6.2%). In the case of trade, the most imported produce was bananas (53.1%), avocados (7.7%), mangoes (5.8%), blueberries (5.0%), and squash (4.3%), while the most exported were apples (80.0%), pears (14.4%), cherries (4.0%), dried onions (1.5%), and potatoes (0.2%).
Growing demand for organic produce especially in the fruits and vegetables sector, rise in per capita spending on organic food
- The United States is one of the largest organic product consumers in the world. In 2020, the country's total sales of organic food products accounted for USD 51.6 billion, according to the Nutrition Business Journal (NBJ, 2021). In 2021, the United States had the largest per capita spending on organic products in the North American region, worth USD 158.0.
- Organic fresh fruits and vegetables have been the leading organic food category since the organic food retail industry began. In 2020, retail sales for these organic products were valued at USD 20.0 billion, showing a growing demand for organic produce. The demand for organic fresh fruits and vegetables has steadily risen over the past two decades. Organic food sales are rising due to growing consumer awareness, especially among high-income consumers. The most in-demand organic categories include basic foods like eggs, dairy, fruits, and vegetables.
- Organic food preferences vary by demographic and region. Younger people of age between 18-29 are more likely to seek out organic products (over 50%) compared to older people aged 65 and above. Income and region also play a role, with 42% of those with under USD 30 thousand income and 49% of those with over USD 75.0 thousand seeking organic products.
- The per capita spending on organic products is increasing in the country, and it recorded a CAGR of 5.2% from 2017 to 2021. The growing demand for organic products creates opportunities for US organic producers to tap into high-value markets domestically and abroad. The price premium associated with organic products is one of the major limiting factors for organic food consumption for low-level income consumers.
United States Agricultural Biologicals Industry Overview
The United States Agricultural Biologicals Market is fragmented, with the top five companies occupying 6.56%. The major players in this market are Bioworks Inc., Cedar Grove Composting Inc., Certis USA LLC, Corteva Agriscience and Novozymes (sorted alphabetically).
Additional Benefits:
- The market estimate (ME) sheet in Excel format
- 3 months of analyst support
TABLE OF CONTENTS
1 EXECUTIVE SUMMARY & KEY FINDINGS
2 REPORT OFFERS
3 INTRODUCTION
- 3.1 Study Assumptions & Market Definition
- 3.2 Scope of the Study
- 3.3 Research Methodology
4 KEY INDUSTRY TRENDS
- 4.1 Area Under Organic Cultivation
- 4.2 Per Capita Spending On Organic Products
- 4.3 Regulatory Framework
- 4.3.1 United States
- 4.4 Value Chain & Distribution Channel Analysis
5 MARKET SEGMENTATION (includes market size in Value in USD and Volume, Forecasts up to 2030 and analysis of growth prospects)
- 5.1 Function
- 5.1.1 Crop Nutrition
- 5.1.1.1 Biofertilizer
- 5.1.1.1.1 Azospirillum
- 5.1.1.1.2 Azotobacter
- 5.1.1.1.3 Mycorrhiza
- 5.1.1.1.4 Phosphate Solubilizing Bacteria
- 5.1.1.1.5 Rhizobium
- 5.1.1.1.6 Other Biofertilizer
- 5.1.1.2 Biostimulants
- 5.1.1.2.1 Amino Acids
- 5.1.1.2.2 Fulvic Acid
- 5.1.1.2.3 Humic Acid
- 5.1.1.2.4 Protein Hydrolysates
- 5.1.1.2.5 Seaweed Extracts
- 5.1.1.2.6 Other Biostimulants
- 5.1.1.3 Organic Fertilizer
- 5.1.1.3.1 Manure
- 5.1.1.3.2 Meal Based Fertilizers
- 5.1.1.3.3 Oilcakes
- 5.1.1.3.4 Other Organic Fertilizer
- 5.1.2 Crop Protection
- 5.1.2.1 Biocontrol Agents
- 5.1.2.1.1 Macrobials
- 5.1.2.1.2 Microbials
- 5.1.2.2 Biopesticides
- 5.1.2.2.1 Biofungicides
- 5.1.2.2.2 Bioherbicides
- 5.1.2.2.3 Bioinsecticides
- 5.1.2.2.4 Other Biopesticides
- 5.1.1 Crop Nutrition
- 5.2 Crop Type
- 5.2.1 Cash Crops
- 5.2.2 Horticultural Crops
- 5.2.3 Row Crops
6 COMPETITIVE LANDSCAPE
- 6.1 Key Strategic Moves
- 6.2 Market Share Analysis
- 6.3 Company Landscape
- 6.4 Company Profiles (includes Global Level Overview, Market Level Overview, Core Business Segments, Financials, Headcount, Key Information, Market Rank, Market Share, Products and Services, and Analysis of Recent Developments).
- 6.4.1 Andermatt Group AG
- 6.4.2 Bioline AgroSciences Ltd
- 6.4.3 Bioworks Inc.
- 6.4.4 Cedar Grove Composting Inc.
- 6.4.5 Certis USA LLC
- 6.4.6 Corteva Agriscience
- 6.4.7 Koppert Biological Systems Inc.
- 6.4.8 Novozymes
- 6.4.9 Sustane Natural Fertilizer Inc.
- 6.4.10 Symborg Inc.
7 KEY STRATEGIC QUESTIONS FOR AGRICULTURAL BIOLOGICALS CEOS
8 APPENDIX
- 8.1 Global Overview
- 8.1.1 Overview
- 8.1.2 Porter's Five Forces Framework
- 8.1.3 Global Value Chain Analysis
- 8.1.4 Market Dynamics (DROs)
- 8.2 Sources & References
- 8.3 List of Tables & Figures
- 8.4 Primary Insights
- 8.5 Data Pack
- 8.6 Glossary of Terms
02-2729-4219
+886-2-2729-4219
 動物微生物組市場規模、佔有率和成長分析:按動物種類、產品類型、原料、形態、應用、最終用戶、通路和地區分類——2026-2033年行業預測
 農業生物製品:市場佔有率分析、產業趨勢與統計、成長預測(2026-2031)
 全球農業生技藥品市場規模、佔有率、趨勢和成長分析報告(2026-2034年)
 2026年全球農業生技藥品市場報告
 生物合理作物保護市場依產品類型、作物類型、配方、作用機制、成分及應用方法分類-2026-2032年全球預測
 農業生技藥品市場規模、佔有率和趨勢分析報告:按作物類型、產品類型、應用方法、地區和細分市場預測(2026-2033 年)
 日本農業生物製品市場報告(按類型、來源、應用方式、應用領域和地區分類,2026-2034年)
 農業生技藥品市場規模、佔有率和成長分析(按類型、來源、應用、作物類型和地區分類)-2026-2033年產業預測
 農業生技藥品市場規模、佔有率和成長分析(按類型、來源、應用、作物類型和地區分類)-2026-2033年產業預測農業生技藥品市場-2025-2030年預測
▼