


 |
市場調查報告書
商品編碼
1693750
生物農藥-市場佔有率分析、產業趨勢與統計、成長預測(2025-2030)Bioinsecticides - Market Share Analysis, Industry Trends & Statistics, Growth Forecasts (2025 - 2030) |
||||||
價格
※ 本網頁內容可能與最新版本有所差異。詳細情況請與我們聯繫。
簡介目錄
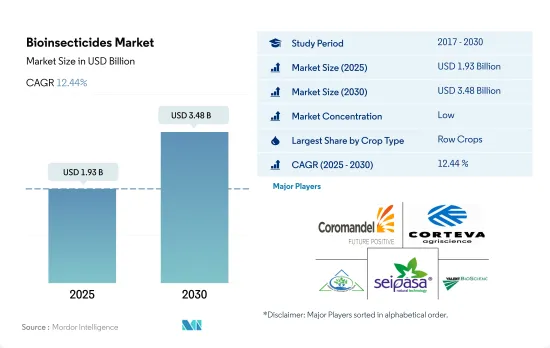
生物農藥市場規模預計在 2025 年為 19.3 億美元,預計到 2030 年將達到 34.8 億美元,預測期內(2025-2030 年)的複合年成長率為 12.44%。
- 生物農藥是從多種來源獲得的天然物質,可有效控制害蟲,同時對非目標生物安全,並且易於在污水處理廠和自然環境中分解。這些獨特的特性使得生物農藥越來越受到農民和消費者的歡迎。
- 生物農藥市場以連續作物為主,佔2022年全球市場價值的84.0%。大麥、玉米、小麥、油菜籽、黑麥、向日葵、大豆和水稻等主要連續作物是世界上種植最廣泛的作物。緊隨其後的是園藝作物,2022 年的市場佔有率為 11.8%。
- 北美引領全球生物農藥市場,2022 年市場佔有率為 40.8%,其次是歐洲(33.2%)及亞太地區(17.5%)。向有機、生態學和永續農業實踐的轉變已獲得全球支持,尤其注重減少因疫情而產生的化肥和農藥的消耗。
- 農藥行動網路 (PAN) 是一個由 600 多個非政府組織、機構和個人組成的全球網路,致力於推廣對環境無害、對社會公正的危險農藥替代品。透過其舉措和計劃,PAN 提高了人們對農藥有害影響的認知,並提倡採用生物農藥作為更安全、更永續的替代方案。
- 由於其獨特的特性和優勢,加上消費者對無化學和有機農產品的偏好日益成長,全球生物農藥市場預計在 2023 年至 2029 年期間的複合年成長率將達到 12.2%。
- 生物農藥是利用真菌、細菌或植物抽取物等微生物來對抗危害作物生長發育的害蟲的生物衍生農藥。北美、歐洲和亞太地區主導全球生物農藥市場。
- 2022年,北美地區將佔全球生物農藥市場的40.8%(以金額為準計算)。北美國家已經採取了一定的措施來增加有機農業。例如,在美國,美國有機農業轉型計畫和區域綜合病蟲害管理中心已經實施。加拿大已透過其害蟲管理中心實施了禁止使用某些殺蟲劑的禁令。在墨西哥,人們越來越反對使用化學殺蟲劑。所有這些舉措都在推動該地區生物農藥市場的發展。
- 歐洲是第二大生物農藥市場。歐盟正大力推廣有機農業,目標是2030年歐盟25%的農業用地採用有機耕作方式。作為該策略的一部分,所有成員國必須在2030年前將化學農藥使用量減半。為此,各成員國都採取了各自的措施和措施,例如義大利對化學農藥徵收高額稅。
- 亞太地區是生物農藥第三大市場。中國和印度佔據亞太生物農藥市場的大部分佔有率。中國是全球最大的農藥使用國,計畫在2025年將園藝作物的農藥使用量減少10%,水稻、小麥和玉米種植的農藥使用量減少5%。預計在預測期內,全球農藥禁令和有機農業的興起將推動全球生物農藥市場的發展。
生物農藥市場的全球趨勢
在北美和歐洲,由於人們意識的增強和政府的推動,有機生產達到了歷史最高水準。
- 有機農業已成為永續糧食系統的主要貢獻者,並在全球 187 個國家/地區實踐。截至2021年,全球有機農地面積為7,230萬公頃,2018年至2021年間各地區平均成長2.9%。有機耕地面積為1,440萬公頃,佔有機農地總面積的19.9%。
- 有機農業最強大的市場是北美和歐洲,這兩個地區佔世界有機耕地面積的41.0%。 2022年,歐洲將擁有650萬公頃有機耕地,佔全球有機耕地總面積的44.1%。北美和歐洲最重要的有機種植作物是蘋果、草莓、穀物和橄欖。
- 亞太地區的新興國家也加入了有機農業運動,並在生產和供應新鮮有機農產品方面實現自給自足,以滿足國內需求。有機農業趨勢在亞太地區日益興起,2017年至2022年間,該地區有機土地面積將增加18.8%。該地區政府的主要措施也在有機農業擴張趨勢中發揮了關鍵作用。例如,日本的《食品、農業和農村基本計畫》的目標是到2030年將有機農民和有機農地的數量增加兩倍。
- 有機農業的成長得益於人們對其益處的認知不斷提高,例如促進土壤健康、減少環境影響和生產更健康的食品。
人均有機食品支出的成長主要出現在美國和德國,這是由消費者對更健康、更永續食品的需求所推動的。
- 過去幾年,有機食品市場經歷了顯著成長,全球銷售額預計將從 2012 年的 708 億美元成長到 2020 年的 1,206 億美元。有機食品的流行趨勢受到多種因素的推動,包括消費者對更健康、更永續的食品選擇的需求不斷成長,以及對傳統農業對環境影響的認知不斷提高。預計未來幾年全球有機食品市場將持續維持成長趨勢。
- 根據有機貿易協會 2021 年的一項調查,當年有機水果和蔬菜的銷售量成長了約 4.5%,佔有機產品總銷量的 15%。北美在有機產品平均支出方面佔據市場主導地位,2021年美國的人均有機產品支出達到186.7美元,是北美國家中最高的。預計歐洲有機食品市場也將強勁成長,其中德國 2021 年人均有機食品支出最高,為 75.6 美元。
- 有機食品市場仍由消費者可支配收入較高的已開發國家主導,但預計新興國家的有機食品市場也將成長。例如,亞太地區的工人階級不斷壯大,使得有機食品更容易取得且更便宜,這有助於擴大市場。
生物農藥產業概況
生物農藥市場細分化,前五大企業市佔率合計為1.69%。該市場的主要企業包括 Coromandel International Ltd、Corteva Agriscience、IPL Biologicals Limited、Seipasa SA、Valent Biosciences LLC 等。
其他福利
- Excel 格式的市場預測 (ME) 表
- 3個月的分析師支持
目錄
第1章執行摘要和主要發現
第2章 報告要約
第3章 引言
- 研究假設和市場定義
- 研究範圍
- 調查方法
第4章 產業主要趨勢
- 有機種植區
- 有機產品人均支出
- 法律規範
- 阿根廷
- 澳洲
- 巴西
- 加拿大
- 中國
- 埃及
- 法國
- 德國
- 印度
- 印尼
- 義大利
- 日本
- 墨西哥
- 荷蘭
- 奈及利亞
- 菲律賓
- 俄羅斯
- 南非
- 西班牙
- 泰國
- 土耳其
- 英國
- 美國
- 越南
- 價值鍊和通路分析
第5章市場區隔
- 作物類型
- 經濟作物
- 園藝作物
- 耕地作物
- 地區
- 非洲
- 按國家
- 埃及
- 奈及利亞
- 南非
- 其他非洲國家
- 亞太地區
- 按國家
- 澳洲
- 中國
- 印度
- 印尼
- 日本
- 菲律賓
- 泰國
- 越南
- 其他亞太地區
- 歐洲
- 按國家
- 法國
- 德國
- 義大利
- 荷蘭
- 俄羅斯
- 西班牙
- 土耳其
- 英國
- 其他歐洲國家
- 中東
- 按國家
- 伊朗
- 沙烏地阿拉伯
- 其他中東地區
- 北美洲
- 按國家
- 加拿大
- 墨西哥
- 美國
- 北美其他地區
- 南美洲
- 按國家
- 阿根廷
- 巴西
- 南美洲其他地區
- 非洲
第6章 競爭格局
- 關鍵策略趨勢
- 市場佔有率分析
- 商業狀況
- 公司簡介
- Andermatt Group AG
- Certis USA LLC
- Coromandel International Ltd
- Corteva Agriscience
- IPL Biologicals Limited
- Jaipur Bio Fertilizers
- Lallemand Inc.
- Seipasa SA
- T.Stanes and Company Limited
- Valent Biosciences LLC
第7章:CEO面臨的關鍵策略問題
第 8 章 附錄
- 世界概況
- 概述
- 五力分析框架
- 全球價值鏈分析
- 市場動態(DRO)
- 資訊來源及延伸閱讀
- 圖片列表
- 關鍵見解
- 數據包
- 詞彙表
簡介目錄
Product Code: 500008
The Bioinsecticides Market size is estimated at 1.93 billion USD in 2025, and is expected to reach 3.48 billion USD by 2030, growing at a CAGR of 12.44% during the forecast period (2025-2030).
- Bioinsecticides are natural substances derived from various sources that effectively control insect pests while being safe for non-target organisms and easily degradable in sewage treatment plants and natural environments. These unique features make bioinsecticides an increasingly popular choice for farmers and consumers.
- The bioinsecticides market is dominated by row crops, which accounted for 84.0% of the global market value in 2022. Major row crops such as barley, corn, wheat, rapeseed, rye, sunflower, soybean, and rice are among the most widely farmed globally. Following closely behind are horticulture crops, which had a market share of 11.8% in 2022.
- North America leads the global bioinsecticides market, accounting for 40.8% of the market share in 2022, followed by Europe and Asia-Pacific, with market shares of 33.2% and 17.5%, respectively. The transition to organic agriculture through agroecological and sustainable agricultural practices gained traction globally, focusing on reducing fertilizers and pesticide consumption, particularly due to the pandemic.
- The Pesticide Action Network (PAN) is a global network of over 600 non-governmental organizations, institutions, and individuals working to promote environmentally sound and socially just alternatives to hazardous pesticides. Through its initiatives and programs, PAN is raising awareness about the negative effects of pesticides and driving the adoption of bioinsecticides as a safer and more sustainable alternative.
- With its unique features and benefits and growing consumer preference for chemical-free produce and organically grown food, bioinsecticides are set to experience growth in the global market, with an estimated CAGR of 12.2% between 2023 and 2029.
- Bioinsecticides are biologically-derived pesticides that use microorganisms such as fungi, bacteria, or even plant extracts to combat pest insects that disrupt crop growth and development. North America, Europe, and Asia-Pacific are dominating the global bioinsecticides market.
- The North American region accounted for 40.8%, by value, of the global bioinsecticides market in 2022. North American countries are establishing certain policies to increase organic farming. For instance, the United States implemented USDA's Organic Transition Initiative and a regional integrated pest management center. Canada implemented a ban on certain pesticides through pest management centers. In Mexico, there is growing opposition to the use of chemical pesticides. All these initiatives are driving the bioinsecticides market in the region.
- Europe is the second-largest market for bioinsecticides. The European Union is promoting organic farming by setting the target of achieving 25% of the region's agricultural land under organic farming by 2030. As part of the strategy, all member countries must reduce their use of chemical pesticides by half by 2030. Therefore all the member countries are implementing individual initiatives and policies, including imposing a high tax on chemical pesticides in Italy.
- Asia-Pacific is the third-largest market for bioinsecticides. China and India hold the major share of the Asia-Pacific bioinsecticides market. China, the world's largest pesticide user, intends to reduce pesticide use by 10% in horticultural crops and 5% in rice, wheat, and corn cultivation by 2025. Pesticide bans worldwide and increased organic farming are expected to drive the global bioinsecticides market during the forecast period.
Global Bioinsecticides Market Trends
Organic production is at an all-time high in North America and Europe, due to the increasing awareness and Government initiatives.
- Organic agriculture has emerged as a significant contributor to sustainable food systems, with 187 countries practicing it globally. As of 2021, there was 72.3 million ha of organic agricultural land worldwide, with an average increase of 2.9% across all regions from 2018 to 2021. Organic arable land accounted for 14.4 million ha, representing 19.9% of the total organic agricultural land.
- The strongest markets for organic farming are North America and Europe, accounting for 41.0% of the global organic arable land. In 2022, Europe had 6.5 million ha of organic arable land, equivalent to 44.1% of the overall organic arable agricultural area. The most significant crops grown organically in North America and Europe are apples, strawberries, cereals, and olives.
- Developing countries in Asia-Pacific are also joining the organic agriculture movement and becoming self-sufficient in producing and providing fresh organic produce to meet their domestic demand. The trend of organic farming is gaining momentum in Asia-Pacific, with the region recording an 18.8% increase in organic arable land from 2017 to 2022. The major initiatives by governments in the region also play a vital role in the growing trend of organic farming. For example, Japan's Basic Plan for Food, Agriculture, and Rural Areas aims to triple the number of organic farmers and lands by 2030.
- The growth of organic agriculture is driven by the rising awareness of the benefits of organic farming, such as promoting soil health, reducing environmental impacts, and producing healthier food.
Per capita spending of organic food majorly observed in United States and Germany, attributed to the consumer demand for healthier and sustainable food
- The organic food market experienced significant growth in the past few years, with global sales reaching USD 120.6 billion in 2020, up from USD 70.8 billion in 2012. The trend toward organic food is being driven by several factors, such as increasing consumer demand for healthier, more sustainable food options and a growing awareness of the environmental impact of conventional agriculture. The global organic food market is expected to continue its growth trend over the coming years.
- According to a survey conducted by the Organic Trade Association in 2021, sales of organic fruits and vegetables increased by around 4.5% in the same year, accounting for 15% of the overall organic sales. North America dominates the market in terms of average spending on organic products, with per capita spending in the United States reaching USD 186.7 in 2021, the highest among all North American countries. Europe is also expected to experience significant growth in the organic food market, with Germany accounting for the highest per capita spending of USD 75.6 in 2021.
- While the organic food market is still dominated by developed countries with high consumer disposable incomes, it is also expected to grow in developing nations. For example, the increasing number of working-class people in the Asia-Pacific region may contribute to the market's expansion due to the growing availability and affordability of organic food products.
Bioinsecticides Industry Overview
The Bioinsecticides Market is fragmented, with the top five companies occupying 1.69%. The major players in this market are Coromandel International Ltd, Corteva Agriscience, IPL Biologicals Limited, Seipasa SA and Valent Biosciences LLC (sorted alphabetically).
Additional Benefits:
- The market estimate (ME) sheet in Excel format
- 3 months of analyst support
TABLE OF CONTENTS
1 EXECUTIVE SUMMARY & KEY FINDINGS
2 REPORT OFFERS
3 INTRODUCTION
- 3.1 Study Assumptions & Market Definition
- 3.2 Scope of the Study
- 3.3 Research Methodology
4 KEY INDUSTRY TRENDS
- 4.1 Area Under Organic Cultivation
- 4.2 Per Capita Spending On Organic Products
- 4.3 Regulatory Framework
- 4.3.1 Argentina
- 4.3.2 Australia
- 4.3.3 Brazil
- 4.3.4 Canada
- 4.3.5 China
- 4.3.6 Egypt
- 4.3.7 France
- 4.3.8 Germany
- 4.3.9 India
- 4.3.10 Indonesia
- 4.3.11 Italy
- 4.3.12 Japan
- 4.3.13 Mexico
- 4.3.14 Netherlands
- 4.3.15 Nigeria
- 4.3.16 Philippines
- 4.3.17 Russia
- 4.3.18 South Africa
- 4.3.19 Spain
- 4.3.20 Thailand
- 4.3.21 Turkey
- 4.3.22 United Kingdom
- 4.3.23 United States
- 4.3.24 Vietnam
- 4.4 Value Chain & Distribution Channel Analysis
5 MARKET SEGMENTATION (includes market size in Value in USD and Volume, Forecasts up to 2030 and analysis of growth prospects)
- 5.1 Crop Type
- 5.1.1 Cash Crops
- 5.1.2 Horticultural Crops
- 5.1.3 Row Crops
- 5.2 Region
- 5.2.1 Africa
- 5.2.1.1 By Country
- 5.2.1.1.1 Egypt
- 5.2.1.1.2 Nigeria
- 5.2.1.1.3 South Africa
- 5.2.1.1.4 Rest of Africa
- 5.2.2 Asia-Pacific
- 5.2.2.1 By Country
- 5.2.2.1.1 Australia
- 5.2.2.1.2 China
- 5.2.2.1.3 India
- 5.2.2.1.4 Indonesia
- 5.2.2.1.5 Japan
- 5.2.2.1.6 Philippines
- 5.2.2.1.7 Thailand
- 5.2.2.1.8 Vietnam
- 5.2.2.1.9 Rest of Asia-Pacific
- 5.2.3 Europe
- 5.2.3.1 By Country
- 5.2.3.1.1 France
- 5.2.3.1.2 Germany
- 5.2.3.1.3 Italy
- 5.2.3.1.4 Netherlands
- 5.2.3.1.5 Russia
- 5.2.3.1.6 Spain
- 5.2.3.1.7 Turkey
- 5.2.3.1.8 United Kingdom
- 5.2.3.1.9 Rest of Europe
- 5.2.4 Middle East
- 5.2.4.1 By Country
- 5.2.4.1.1 Iran
- 5.2.4.1.2 Saudi Arabia
- 5.2.4.1.3 Rest of Middle East
- 5.2.5 North America
- 5.2.5.1 By Country
- 5.2.5.1.1 Canada
- 5.2.5.1.2 Mexico
- 5.2.5.1.3 United States
- 5.2.5.1.4 Rest of North America
- 5.2.6 South America
- 5.2.6.1 By Country
- 5.2.6.1.1 Argentina
- 5.2.6.1.2 Brazil
- 5.2.6.1.3 Rest of South America
- 5.2.1 Africa
6 COMPETITIVE LANDSCAPE
- 6.1 Key Strategic Moves
- 6.2 Market Share Analysis
- 6.3 Company Landscape
- 6.4 Company Profiles (includes Global Level Overview, Market Level Overview, Core Business Segments, Financials, Headcount, Key Information, Market Rank, Market Share, Products and Services, and Analysis of Recent Developments).
- 6.4.1 Andermatt Group AG
- 6.4.2 Certis U.S.A. LLC
- 6.4.3 Coromandel International Ltd
- 6.4.4 Corteva Agriscience
- 6.4.5 IPL Biologicals Limited
- 6.4.6 Jaipur Bio Fertilizers
- 6.4.7 Lallemand Inc.
- 6.4.8 Seipasa SA
- 6.4.9 T.Stanes and Company Limited
- 6.4.10 Valent Biosciences LLC
7 KEY STRATEGIC QUESTIONS FOR AGRICULTURAL BIOLOGICALS CEOS
8 APPENDIX
- 8.1 Global Overview
- 8.1.1 Overview
- 8.1.2 Porter's Five Forces Framework
- 8.1.3 Global Value Chain Analysis
- 8.1.4 Market Dynamics (DROs)
- 8.2 Sources & References
- 8.3 List of Tables & Figures
- 8.4 Primary Insights
- 8.5 Data Pack
- 8.6 Glossary of Terms
02-2729-4219
+886-2-2729-4219
 生物來源殺蟲劑市場:按類型、製劑形式、施用方法、作物類型和分銷管道分類-2026-2032年全球市場預測Chlorfenapyr技術市場按作物類型、製劑、應用方法和最終用戶分類,全球預測,2026-2032年
 生物農藥市場-2025年至2030年預測
 2032年生物農藥市場預測:按來源、劑型、應用類型、作物類型、目標害蟲、最終用戶和地區進行的全球分析
 生物殺蟲劑市場-全球產業規模、佔有率、趨勢、機會及預測(按來源、應用、地區和競爭細分,2020-2030 年)
 生物農藥市場規模、佔有率及成長分析(按來源、用途、配方、應用方法、最終用戶和地區)-2025-2032 年產業預測