


 |
市場調查報告書
商品編碼
1693621
亞太商用車:市場佔有率分析、產業趨勢與成長預測(2025-2030 年)Asia-Pacific Commercial Vehicles - Market Share Analysis, Industry Trends & Statistics, Growth Forecasts (2025 - 2030) |
||||||
價格
※ 本網頁內容可能與最新版本有所差異。詳細情況請與我們聯繫。
簡介目錄
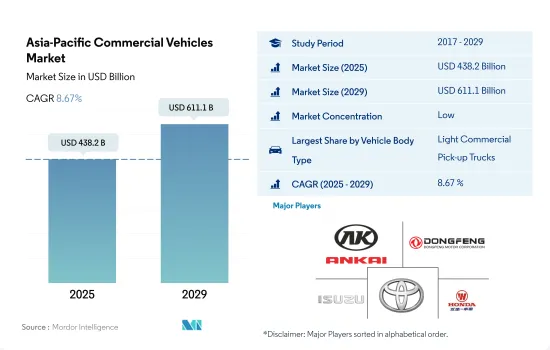
亞太商用車市場規模預計在 2025 年為 4,382 億美元,預計到 2029 年將達到 6,111 億美元,預測期內(2025-2029 年)的複合年成長率為 8.67%。
亞太地區作為全球商用車產業關鍵參與企業的重要性體現在其韌性、適應性和成長潛力。
- 亞太商用車市場的輕型商用皮卡車領域表現出韌性和穩定成長。從 2017 年的 4,624,010 輛開始,2018 年和 2019 年銷量一度停滯不前。然而,接下來的幾年銷量顯著成長,證明了對這些車輛的強勁需求。根據預測,到 2023 年,該細分市場的銷量將達到 6,042,081 輛,顯示出顯著的復甦和成長軌跡。相較之下,輕型商用廂型車市場則從2017年的1,176,110輛下滑至2019年的885,614輛。自2019年以來,市場逐漸復甦,但尚未達到皮卡的步伐。 2023 年輕型商用貨車的預測銷售量為 1,082,025 輛,顯示此類車輛的需求穩定但適中。
- 近年來,亞太商用車市場的中型商用卡車領域面臨挑戰。在 2017 年達到 461,391 輛的峰值之後,2019 年大幅下降至 327,819 輛。不過,也有令人鼓舞的復甦跡象,一些預測表明,到 2023 年這一數字將上升至 492,106 輛。在重型商用卡車領域,一個清晰的模式正在浮現。雖然 2017 年至 2021 年間數字有所波動,但整體趨勢是上升的。 2017 年起,該細分市場的銷量為 1,459,599 輛,2020 年達到高峰 1,754,298 輛。在 2021 年下滑之後,預計該細分市場將強勁復甦,2023 年銷量預測為 2,318,219 輛。
- 最後,作為大眾運輸必不可少的公車領域,亞太市場的銷量最初從 2017 年的 680,162 輛下降到 2019 年的 546,164 輛。然而,自 2019 年以來,這一數量已經穩定下來,預計將緩慢成長,到 2023 年將達到 709,944 輛。
亞太地區商用車註冊量持續穩定成長,可望支撐該地區日益成長的物流和商業需求
- 工業生產以中國為中心轉移,開闢了貿易管道,間接使商用車市場和物流業受益。由於物流和電子商務行業的成長,輕型商用車的需求預計會增加。中國不斷成長的經濟正在增加中階的可支配收入,從而刺激了商用車和乘用車的需求。此外,過去五年來,中國的低生產成本推動了汽車需求的大幅成長。
- 受新冠疫情影響,亞太地區商用車市場遭遇挫折,地方政府對商業和旅遊實施限制。這導致商用車銷售量急劇下降。疫情導致消費者偏好轉向低價產品,重塑了當地商用車市場。
- 儘管面臨障礙,印度政府仍致力於開發共用、連網和電動交通的生態系統。預計這些努力將長期推動商用電動車的成長。預計到2030年,亞洲各國政府將在基礎建設方面投資26兆美元,將大大增強亞太地區建築材料和機械的流動。嚴格的污染法規迫使汽車製造商(OEM)轉向電動車。隨著人們對未來出行方式的理解不斷加深,現代新興企業和企業家擴大支持商用電動車。
亞太商用車市場趨勢
受政府措施和商用車電氣化推動,亞太地區電動車需求和銷售快速成長
- 近年來,亞太地區電動車(EV)的需求和銷售量激增。主要市場中國2022年電動車銷量較2021年成長2.90%,日本同期電動車銷量成長11.11%。推動這一趨勢的因素包括日益成長的環境問題、嚴格的法規以及電動車的優勢,例如燃油效率、降低維護成本和零碳排放。政府補貼進一步推動了亞洲國家對電動車的採用。
- 使用傳統燃料的商用車輛,尤其是卡車和公共汽車,正在導致亞太國家污染水平上升。為此,該地區許多國家正在大力投資,將內燃機 (ICE) 汽車轉型為電動車,以減少二氧化碳排放。例如,2020 年 12 月,印尼市政公車業者 Transjakarta 宣布了雄心勃勃的計劃,到 2030 年將其電動公車車隊擴大到 10,000 輛。類似這樣的全部區域努力正在推動商用車的電氣化。
- 亞太地區各國政府機構正積極提案逐步淘汰石化燃料汽車的措施,此舉可望提振電動商用車市場。值得注意的進展是,2022 年 5 月,塔塔汽車贏得了一份政府契約,根據 FAME 2 計劃,向印度供應 5,450 輛電動公車,價值 500 億印度盧比。該公司還宣布計劃向六家大型電子商務公司交付20,000 輛小型電動卡車。預計電動車領域的這些進步將在 2024 年至 2030 年間進一步推動亞太地區對電動商用車的需求。
亞太商用車產業概覽
亞太商用車市場細分化,前五大企業佔31.67%。市場的主要企業有安徽安凱汽車、東風汽車公司、五十鈴汽車公司、豐田汽車公司、五菱汽車控股有限公司等。
其他福利
- Excel 格式的市場預測 (ME) 表
- 3個月的分析師支持
目錄
第1章執行摘要和主要發現
第2章 報告要約
第3章 引言
- 研究假設和市場定義
- 研究範圍
- 調查方法
第4章 產業主要趨勢
- 人口
- 人均GDP
- 消費者汽車支出(cvp)
- 通貨膨脹率
- 汽車貸款利率
- 電氣化的影響
- 電動車充電站
- 電池組價格
- 新款 Xev 車型發布
- 物流績效指數
- 燃油價格
- OEM生產統計
- 法律規範
- 價值鍊和通路分析
第5章市場區隔
- 汽車模型
- 商用車
- 公車
- 大型商用卡車
- 輕型商用皮卡車
- 輕型商用廂型車
- 中型商用卡車
- 商用車
- 推進類型
- 混合動力和電動車
- 按燃料類別
- BEV
- FCEV
- HEV
- PHEV
- 內燃機
- 按燃料類別
- 天然氣
- 柴油引擎
- 汽油
- LPG
- 混合動力和電動車
- 國家
- 澳洲
- 中國
- 印度
- 印尼
- 日本
- 馬來西亞
- 韓國
- 泰國
- 其他亞太地區
第6章 競爭格局
- 關鍵策略趨勢
- 市場佔有率分析
- 商業狀況
- 公司簡介
- Anhui Ankai Automobile Co. Ltd.
- Daihatsu Motor Co. Ltd.
- Dongfeng Motor Corporation
- Ford Motor Company
- General Motors Company
- Great Wall Motor Company Ltd(GWM)
- Honda Motor Co. Ltd.
- Hyundai Motor Company
- Isuzu Motors Limited
- Kia Corporation
- Mazda Motor Corporation
- Mitsubishi Motors Corporation
- Nissan Motor Co. Ltd.
- Renault-Nissan-Mitsubishi Alliance
- Subaru Corporation
- Suzuki Motor Corporation
- Tata Motors Limited
- Toyota Motor Corporation
- Wuling Motors Holdings Limited
第7章:CEO面臨的關鍵策略問題
第 8 章 附錄
- 世界概況
- 概述
- 五力分析框架
- 全球價值鏈分析
- 市場動態(DRO)
- 資訊來源及延伸閱讀
- 圖片列表
- 關鍵見解
- 數據包
- 詞彙表
簡介目錄
Product Code: 93009
The Asia-Pacific Commercial Vehicles Market size is estimated at 438.2 billion USD in 2025, and is expected to reach 611.1 billion USD by 2029, growing at a CAGR of 8.67% during the forecast period (2025-2029).
APAC's significance as a pivotal player in the global commercial vehicle industry is marked by resilience, adaptability, and growth potential
- The light commercial pickup trucks segment of the Asia-Pacific commercial vehicles market has been showcasing resilience and steady growth. Starting at 4,620,401 units in 2017, there was a brief lull in 2018 and 2019. However, subsequent years witnessed a notable uptick, underscoring a robust demand for these vehicles. Projections indicated that by 2023, this segment would hit 6,042,081 units, showcasing a remarkable recovery and growth trajectory. In contrast, the light commercial vans segment registered a decline from 1,176,110 units in 2017 to 885,614 units in 2019. While there has been a modest rebound since 2019, it has not matched the pace of pickup trucks. The forecast for 2023 stood at 1,082,025 units for light commercial vans, indicating a steady but moderate demand for these vehicles.
- The medium-duty commercial trucks segment of the Asia-Pacific commercial vehicles market has faced challenges in recent years. After peaking at 461,391 units in 2017, it experienced a significant drop to 327,819 units by 2019. However, there were positive signs of recovery, with projections indicating a rise to 492,106 units by 2023. In the heavy-duty commercial trucks segment, a distinct pattern emerges. While the figures fluctuated between 2017 and 2021, the overall trend has been upward. Starting at 1,459,599 units in 2017, there was a peak in 2020 at 1,754,298 units. Despite a dip in 2021, the segment rebounded strongly, with 2,318,219 units projected for 2023.
- Lastly, the buses segment, crucial for mass transit, initially saw a decline from 680,162 units in 2017 to 546,164 units in 2019 across the Asia-Pacific market. However, the post-2019 period has been marked by stabilization and gradual growth, with projections indicating a rise to 709,944 units by 2023.
Asia-Pacific is likely to continue witnessing a consistent increase in CV registrations, supporting the region's expanding logistical and commercial demands
- The relocation of industrial output, primarily to China, has opened up trade channels, indirectly benefiting the commercial vehicle market and the logistics sector. With the growth of the logistics and e-commerce sectors, the demand for LCVs is expected to rise. The expanding Chinese economy has led to an increase in disposable income for the middle class, driving up demand for both commercial and passenger vehicles. Additionally, the nation's low production costs have fueled a significant surge in automobile demand over the past five years.
- The Asia-Pacific commercial vehicles market faced a setback during the COVID-19 outbreak, with local authorities imposing restrictions on commerce and travel. This led to a sharp decline in commercial vehicle sales. The pandemic shifted consumer preferences toward low-cost goods, reshaping the local commercial vehicle market.
- Despite hurdles, the Indian government is committed to developing a shared, connected, and electric mobility ecosystem. Such initiatives are expected to drive the growth of commercial electric vehicles in the long term. Asian governments are projected to invest USD 26 trillion in infrastructure by 2030, significantly bolstering the transportation of construction materials and machinery across Asia-Pacific. Stringent pollution regulations have prompted automakers (OEMs) to pivot toward electric vehicles. With a growing understanding of the future of mobility, modern start-ups and entrepreneurs are increasingly favoring commercial electric vehicles.
Asia-Pacific Commercial Vehicles Market Trends
APAC's rapid electric vehicle demand and sales growth are driven by government initiatives and commercial vehicle electrification
- Electric vehicle (EV) demand and sales have surged in the APAC region in recent years. China, the dominant market, saw a 2.90% rise in electric car sales in 2022 compared to 2021, while Japan experienced an 11.11% increase during the same period. Factors driving this trend include mounting environmental concerns, stringent regulations, and the advantages of EVs, such as fuel efficiency, lower maintenance costs, and zero carbon emissions. Government subsidies further bolster the adoption of EVs in Asian nations.
- Conventional fuel-powered commercial vehicles, notably trucks and buses, are contributing to the escalating pollution levels in several Asia-Pacific countries. In response, many nations in the region are making substantial investments to transition their internal combustion engine (ICE) vehicles to electric ones, aiming to curb carbon emissions. For instance, in December 2020, TransJakarta, a city-owned bus operator in Indonesia, unveiled an ambitious plan to expand its electric bus (e-bus) fleet to 10,000 units by 2030. Such initiatives across the region are propelling the electrification of commercial vehicles.
- Government bodies in various APAC countries are actively proposing measures to phase out fossil fuel vehicles, a move that is poised to bolster the market for electric commercial vehicles. In a notable development, in May 2022, Tata Motors secured a government contract in India to supply 5,450 electric buses worth INR 5,000 crore under the FAME 2 scheme. Additionally, the company announced plans to deliver 20,000 light electric trucks to six major e-commerce players. These advancements in the EV space are anticipated to further fuel the demand for electric commercial vehicles in the APAC region from 2024 to 2030.
Asia-Pacific Commercial Vehicles Industry Overview
The Asia-Pacific Commercial Vehicles Market is fragmented, with the top five companies occupying 31.67%. The major players in this market are Anhui Ankai Automobile Co. Ltd., Dongfeng Motor Corporation, Isuzu Motors Limited, Toyota Motor Corporation and Wuling Motors Holdings Limited (sorted alphabetically).
Additional Benefits:
- The market estimate (ME) sheet in Excel format
- 3 months of analyst support
TABLE OF CONTENTS
1 EXECUTIVE SUMMARY & KEY FINDINGS
2 REPORT OFFERS
3 INTRODUCTION
- 3.1 Study Assumptions & Market Definition
- 3.2 Scope of the Study
- 3.3 Research Methodology
4 KEY INDUSTRY TRENDS
- 4.1 Population
- 4.2 GDP Per Capita
- 4.3 Consumer Spending For Vehicle Purchase (cvp)
- 4.4 Inflation
- 4.5 Interest Rate For Auto Loans
- 4.6 Impact Of Electrification
- 4.7 EV Charging Station
- 4.8 Battery Pack Price
- 4.9 New Xev Models Announced
- 4.10 Logistics Performance Index
- 4.11 Fuel Price
- 4.12 Oem-wise Production Statistics
- 4.13 Regulatory Framework
- 4.14 Value Chain & Distribution Channel Analysis
5 MARKET SEGMENTATION (includes market size in Value in USD and Volume, Forecasts up to 2029 and analysis of growth prospects)
- 5.1 Vehicle Type
- 5.1.1 Commercial Vehicles
- 5.1.1.1 Buses
- 5.1.1.2 Heavy-duty Commercial Trucks
- 5.1.1.3 Light Commercial Pick-up Trucks
- 5.1.1.4 Light Commercial Vans
- 5.1.1.5 Medium-duty Commercial Trucks
- 5.1.1 Commercial Vehicles
- 5.2 Propulsion Type
- 5.2.1 Hybrid and Electric Vehicles
- 5.2.1.1 By Fuel Category
- 5.2.1.1.1 BEV
- 5.2.1.1.2 FCEV
- 5.2.1.1.3 HEV
- 5.2.1.1.4 PHEV
- 5.2.2 ICE
- 5.2.2.1 By Fuel Category
- 5.2.2.1.1 CNG
- 5.2.2.1.2 Diesel
- 5.2.2.1.3 Gasoline
- 5.2.2.1.4 LPG
- 5.2.1 Hybrid and Electric Vehicles
- 5.3 Country
- 5.3.1 Australia
- 5.3.2 China
- 5.3.3 India
- 5.3.4 Indonesia
- 5.3.5 Japan
- 5.3.6 Malaysia
- 5.3.7 South Korea
- 5.3.8 Thailand
- 5.3.9 Rest-of-APAC
6 COMPETITIVE LANDSCAPE
- 6.1 Key Strategic Moves
- 6.2 Market Share Analysis
- 6.3 Company Landscape
- 6.4 Company Profiles
- 6.4.1 Anhui Ankai Automobile Co. Ltd.
- 6.4.2 Daihatsu Motor Co. Ltd.
- 6.4.3 Dongfeng Motor Corporation
- 6.4.4 Ford Motor Company
- 6.4.5 General Motors Company
- 6.4.6 Great Wall Motor Company Ltd (GWM)
- 6.4.7 Honda Motor Co. Ltd.
- 6.4.8 Hyundai Motor Company
- 6.4.9 Isuzu Motors Limited
- 6.4.10 Kia Corporation
- 6.4.11 Mazda Motor Corporation
- 6.4.12 Mitsubishi Motors Corporation
- 6.4.13 Nissan Motor Co. Ltd.
- 6.4.14 Renault-Nissan-Mitsubishi Alliance
- 6.4.15 Subaru Corporation
- 6.4.16 Suzuki Motor Corporation
- 6.4.17 Tata Motors Limited
- 6.4.18 Toyota Motor Corporation
- 6.4.19 Wuling Motors Holdings Limited
7 KEY STRATEGIC QUESTIONS FOR VEHICLES CEOS
8 APPENDIX
- 8.1 Global Overview
- 8.1.1 Overview
- 8.1.2 Porter's Five Forces Framework
- 8.1.3 Global Value Chain Analysis
- 8.1.4 Market Dynamics (DROs)
- 8.2 Sources & References
- 8.3 List of Tables & Figures
- 8.4 Primary Insights
- 8.5 Data Pack
- 8.6 Glossary of Terms
02-2729-4219
+886-2-2729-4219
 東協商用車:市場佔有率分析、產業趨勢與統計、成長預測(2026-2031)
 商用車空氣懸吊系統市場(按車輛類型、零件類型、技術、應用和分銷管道分類)-2026-2032年全球預測
 商用車市場-全球產業規模、佔有率、趨勢、機會和預測,按車輛類型、應用類型、動力類型、地區和競爭格局分類,2021-2031年預測
 日本商用車市場報告(按車輛類型(巴士、重型商用卡車、輕型商用皮卡、輕型商用廂型車、中型商用卡車)、引擎類型(混合動力和電動車、內燃機)和地區分類,2026-2034 年)
 人工智慧及其在商用車市場的應用,全球(2024-2029)
 2025年全球商用車市場報告
 2025-2029年全球商用車市場2025 年至 2033 年商用車市場規模、佔有率、趨勢及預測(按車型、推進類型、最終用途和地區分類)
 商用車市場:依產品、最終用途及地區分類印度商用車市場:市場佔有率分析、行業趨勢和統計數據、成長預測(2025-2030 年)
▼