


 |
市場調查報告書
商品編碼
1693532
葉面肥料:市場佔有率分析、產業趨勢與統計、成長預測(2025-2030)Foliar Fertilizer - Market Share Analysis, Industry Trends & Statistics, Growth Forecasts (2025 - 2030) |
||||||
※ 本網頁內容可能與最新版本有所差異。詳細情況請與我們聯繫。
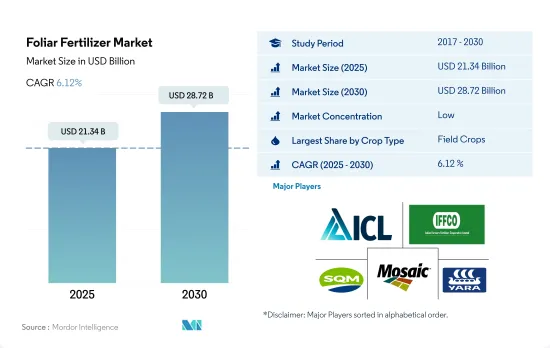
葉面肥料市場規模預計在 2025 年為 213.4 億美元,預計到 2030 年將達到 287.2 億美元,預測期內(2025-2030 年)的複合年成長率為 6.12%。
葉面噴布的各種好處促使人們紛紛葉面噴布。
- 至2022年,大田作物部分將佔葉面肥料市場總量的78.4%。全球超過85%的農業用地集中在田間作物的種植上,作物大田作物則需要使用大量的葉面肥料。
- 2022 年,亞太地區和北美佔據了葉面作物市場總量的 70.2%。這是因為該地區有大片區域種植田間作物,約佔同期世界田間作物種植面積的 58.0%。 2022年,北美佔田間作物葉面肥料使用量的26.8%,亞太地區佔43.3%。
- 園藝作物佔全球葉面肥料價值佔有率的 18.2%,2022 年為 43.7 億美元。葉面施肥可以將營養物質精確、有針對性地直接輸送到植物葉片。這在園藝中尤其有益,因為需要滿足不同作物和生長階段的特定營養需求。此外,葉面噴布可以快速應對營養缺乏的情況,確保在植物最需要的時候提供必需的營養。由於這些因素,全部區域葉面肥料的使用量顯著增加。
- 就以金額為準,草坪和觀賞作物領域對葉面肥料的需求預計在 2023 年至 2030 年期間實現 5.9% 的複合年成長率。需求的成長是由於人們對觀賞作物的需求不斷成長,以提高美感和生活品質,以及公共場所草坪維護的需求。
土壤養分普遍缺乏,推動葉面肥料需求成長
- 葉面施肥在世界各地的作物生產中被廣泛採用,尤其是在穀物和園藝行業。這種方法可以快速應對營養缺乏,並確保植物在關鍵生長階段獲得重要的營養。
- 2022年,亞太地區將佔據葉面肥料市場的最大佔有率,價值為113億美元,消費量為1,190萬噸。田間作物佔據了大部分佔有率,佔據了72.4%的市場佔有率,價值達82億美元。
- 歐洲是葉面肥料市場的主要參與者,到 2022 年將佔據 16.0% 的市場佔有率,在研究期間將實現 76.9% 的強勁成長。微量營養素缺乏,尤其是錳、鋅和鐵的缺乏,對歐洲部分地區的作物品質和產量造成影響。根據研究,該地區約有 60.0% 和 28.0% 的土壤分別缺乏鐵和鋅,這推動了市場的發展。
- 南美洲為全球葉面噴布市場貢獻了5.8%。在審查期間,該地區出現了顯著成長,葉面噴布市場成長了 62.1%,消費量成長了 27.1%。預計 2023 年至 2030 年期間市場價值的複合年成長率為 5.9%。
- 由於精密農業、保護性農業的採用以及對土壤微量營養素的不斷成長以提高農業產量,全球對葉面肥料的需求預計將增加。葉面施肥將推動這一需求,因為它可以為葉子提供營養,預計從 2023 年到 2030 年的複合年成長率為 5.9%。
葉面肥料的全球趨勢
為滿足日益成長的糧食需求,農業面臨的壓力日益增大,預計將導致田間作物種植面積增加
- 全球農業部門面臨許多挑戰。根據聯合國預測,到 2050 年,世界人口可能超過 90 億。人口成長可能對農業造成過度壓力,而由於勞動力短缺和都市化進程加劇導致農地面積減少,農業產量已經下降。根據聯合國糧食及農業組織預測,2050年,全球70%的人口預計將居住在城市。隨著全球可耕地面積減少,農民需要使用更多的肥料來提高作物產量。
- 亞太地區是世界上最大的農產品生產地區。農業對該地區的經濟至關重要,約佔總勞動力的 20%。該地區以田間作物種植為主,約佔全部區域作物總面積的95%以上。水稻、小麥和玉米是該地區的主要田間作物,2022年約佔總耕地面積的24.3%。
- 北美洲是世界上第二大可耕地。該農場種植多種作物,主要為田間作物。尤其是玉米、棉花、稻米、大豆和小麥,都是美國農業部強調的主要田間作物。 2022年,美國佔北美作物種植面積的46.2%。然而,2017年至2019年期間,該國作物面積大幅下降,主要原因是惡劣天氣導致德克薩斯和休士頓等地區發生嚴重洪災。
全球田間作物主要養分氮、鉀、磷的平均施用量為164.31公斤/公頃。
- 玉米、油菜籽、棉花、高粱、水稻、小麥和大豆是世界主要的營養密集型作物。 2022年,這些作物的平均一次養分施用量為玉米230.57公斤/公頃、油菜籽255.75公斤/公頃、棉花172.70公斤/公頃、高粱158.46公斤/公頃、水稻154.49公斤/公頃、小麥135公頃.35/709公斤。主要營養素對作物至關重要,因為它們驅動植物中的重要代謝過程,並有助於細胞、細胞膜和葉綠素等重要組織的形成。其中,磷對於種植優質作物至關重要,而鉀在激活植物生長所必需的酵素方面起著關鍵作用。
- 全球田間作物氮、鉀、磷的平均施用量為164.31公斤/公頃。氮肥是使用最廣泛的基肥,2022年的施用量為224.6公斤/公頃。其次是鉀肥,施用量為150.3公斤/公頃,磷肥施用量排名第三,為117.9公斤/公頃。
- 2022年,氮肥施用量最高的是油菜,為347.4公斤/公頃。玉米磷施用量最高,為156.3公斤/公頃,菜籽鉀施用量最高,248.6公斤/公頃。全球田間作物種植正在興起,其中南美洲和亞太地區的成長尤其顯著。這些地區正成為化肥的潛在市場。歐洲和北美等發展中地區以及面臨營養缺乏的地區由於其有效性而擴大採用特種肥料。預計這些趨勢將在 2023 年至 2030 年期間推動主要營養肥料市場的發展。
葉面肥料業概況
葉面肥料市場分散,前五大企業佔32.55%。該市場的主要企業有:ICL Group Ltd、Indian Farmers Fertiliser Cooperative Limited、Sociedad Quimica y Minera de Chile SA、The Mosaic Company 和 Yara International ASA(按字母順序排列)
其他福利
- Excel 格式的市場預測 (ME) 表
- 3個月的分析師支持
目錄
第1章執行摘要和主要發現
第2章 報告要約
第3章 引言
- 研究假設和市場定義
- 研究範圍
- 調查方法
第4章 產業主要趨勢
- 主要作物種植面積
- 田間作物
- 園藝作物
- 平均養分施用量
- 微量營養素
- 田間作物
- 園藝作物
- 主要營養素
- 田間作物
- 園藝作物
- 次要宏量營養素
- 田間作物
- 園藝作物
- 微量營養素
- 灌溉農田
- 法律規範
- 價值鍊和通路分析
第5章市場區隔
- 類型
- 複合型
- 直的
- 按營養成分
- 微量營養素
- 氮
- 磷酸
- 鉀
- 次要營養物質
- 作物類型
- 田間作物
- 園藝作物
- 草坪和觀賞植物
- 地區
- 亞太地區
- 澳洲
- 孟加拉
- 中國
- 印度
- 印尼
- 日本
- 巴基斯坦
- 菲律賓
- 泰國
- 越南
- 其他亞太地區
- 歐洲
- 法國
- 德國
- 義大利
- 荷蘭
- 俄羅斯
- 西班牙
- 烏克蘭
- 英國
- 其他歐洲國家
- 中東和非洲
- 奈及利亞
- 沙烏地阿拉伯
- 南非
- 土耳其
- 其他中東和非洲地區
- 北美洲
- 加拿大
- 墨西哥
- 美國
- 北美其他地區
- 南美洲
- 阿根廷
- 巴西
- 南美洲其他地區
- 亞太地區
第6章 競爭格局
- 關鍵策略趨勢
- 市場佔有率分析
- 商業狀況
- 公司簡介
- Grupa Azoty SA(Compo Expert)
- Haifa Group
- ICL Group Ltd
- Indian Farmers Fertiliser Cooperative Limited
- Sociedad Quimica y Minera de Chile SA
- The Mosaic Company
- UPL Limited
- Yara International ASA
第7章:CEO面臨的關鍵策略問題
第 8 章 附錄
- 世界概況
- 概述
- 五力分析框架
- 全球價值鏈分析
- 市場動態(DRO)
- 資訊來源及延伸閱讀
- 圖片列表
- 關鍵見解
- 資料包
- 詞彙表
The Foliar Fertilizer Market size is estimated at 21.34 billion USD in 2025, and is expected to reach 28.72 billion USD by 2030, growing at a CAGR of 6.12% during the forecast period (2025-2030).
The various benefits associated with a foliar application are driving the adoption of the foliar method
- The field crops segment accounted for 78.4% of the overall foliar fertilizer market value in 2022. More than 85% of the world's agricultural acreage is focused on the cultivation of field crops, which accounts for the huge use of foliar fertilizers by these crops.
- Asia-Pacific and North America together held a market value share of 70.2% in 2022 of the total foliar field crop market. This was due to the presence of a large field crop cultivation area, which accounted for about 58.0% of the total field crop cultivation area worldwide during the same period. North America accounted for 26.8%, and Asia-Pacific accounted for a share of 43.3% of the usage of foliar fertilizers in field crops in 2022.
- The horticultural crops held a value share of 18.2% of the global foliar fertilizer value and accounted for USD 4.37 billion in 2022. Foliar fertilization allows for precise and targeted nutrient delivery directly to the plant's leaves. This is particularly beneficial in horticulture, where specific nutrient requirements for different crops and stages of growth need to be met. Furthermore, the foliar application provides a quick response to nutrient deficiencies, ensuring that plants receive essential nutrients when they need them most. Due to these factors, the adoption of foliar fertilizers is growing significantly across the region.
- The demand for foliar fertilizers in the turf and ornament crop segment is projected to register a CAGR of 5.9% in terms of value from 2023 to 2030. This uptick is driven by the increasing demand for ornamentals to enhance aesthetics and quality of life, as well as the need for turf maintenance in public spaces.
The rising prevalence of soil nutrient deficiencies is driving the demand for foliar fertilizers
- Foliar application of fertilizers is a widely adopted practice in global crop production, especially in the cereal and horticulture industries. This method offers a swift response to nutrient deficiencies, ensuring plants receive vital nutrients at critical growth stages.
- In 2022, Asia-Pacific held the largest share in the foliar fertilizer market, reaching a value of USD 11.3 billion, with a consumption volume of 11.9 million metric tons. Field crops accounted for the majority share, capturing 72.4% of the market, valued at USD 8.2 billion.
- Europe, a significant player in the foliar fertilizer market, held a 16.0% market value share in 2022, witnessing a robust growth of 76.9% during the study period. Micronutrient deficiencies, particularly in manganese, zinc, and iron, have been a concern for crop quality and yield in several European regions. Studies indicate that around 60.0% and 28.0% of the region's soil had insufficient iron and zinc levels, respectively, underscoring the market's growth drivers.
- South America contributed 5.8% to the global foliar market. During the study period, the region saw a notable uptick, with the foliar market growing by 62.1% and consumption by volume rising by 27.1%. Projections indicate a 5.9% CAGR for the market value from 2023 to 2030.
- The global demand for foliar fertilizers is set to rise, driven by the adoption of precision farming, protected agriculture, and a heightened need for soil micronutrients to enhance agricultural yields. Foliar fertilization, with its targeted nutrient delivery to leaves, is expected to fuel this demand, leading to a projected 5.9% CAGR from 2023 to 2030.
Global Foliar Fertilizer Market Trends
The rising pressure on the agriculture industry to meet the growing demand for food is expected to increase the area under field crop cultivation
- The global agricultural sector is facing many challenges. According to the UN, the world population may exceed 9 billion by 2050. This population growth may overburden the agricultural industry, which is already experiencing an output loss due to a lack of laborers and the shrinkage of agricultural fields caused by rising urbanization. According to the Food and Agriculture Organization, 70% of the global population is expected to live in cities by 2050. Due to the global loss of arable land, farmers now need to utilize more fertilizers to increase crop yields.
- Asia-Pacific is the world's largest producer of agricultural products. Agriculture is critical to the region's economy, as it employs about 20% of the total available workforce. Field crop cultivation dominates the region, accounting for about more than 95% of the total crop area in the region. Rice, wheat, and corn are the major field crops produced in the region, together accounting for about 24.3% of the total crop area in 2022.
- North America ranks as the second-largest arable region globally. Its farms cultivate a diverse range of crops, with a focus on field crops. Notably, corn, cotton, rice, soybean, and wheat are the prominent field crops, as highlighted by the USDA. In 2022, the United States commanded 46.2% of North America's crop cultivation area. However, the country witnessed a significant drop in crop acreage between 2017 and 2019, primarily due to adverse environmental conditions, leading to severe flooding in regions like Texas and Houston.
The global average application rate of primary nutrient nitrogen, potassium, and phosphorus in field crops is 164.31 kg/ha
- Corn, rapeseed, cotton, sorghum, rice, wheat, and soybean are among the primary nutrient-intensive crops globally. In 2022, the average primary nutrient application rates for these crops were as follows: corn - 230.57 kg/ha, rapeseed - 255.75 kg/ha, cotton - 172.70 kg/ha, sorghum - 158.46 kg/ha, rice - 154.49 kg/ha, wheat - 135.35 kg/ha, and soybean - 120.97 kg/ha. Primary nutrients are vital for crops as they facilitate essential plant metabolic processes and contribute to the formation of crucial tissues like cells, cell membranes, and chlorophyll. Notably, phosphorus is pivotal for cultivating high-quality crops, while potassium plays a key role in activating enzymes necessary for plant growth.
- On a global scale, field crops have an average application rate of 164.31 kg/ha for nitrogen, potassium, and phosphorus. Nitrogen takes the lead as the most widely used primary nutrient fertilizer, with an application rate of 224.6 kg/ha in 2022. Potassic fertilizers follow, with an application rate of 150.3 kg/ha, and phosphorus ranks third, with an application rate of 117.9 kg/ha.
- In 2022, rapeseed had the highest nitrogen application rate at 347.4 kg/ha. Corn led in phosphorus application, with a rate of 156.3 kg/ha, while canola topped the charts for potassium application at 248.6 kg/ha. Field crop cultivation is on the rise globally, with notable growth in South America and the Asia-Pacific region. These regions are emerging as potential markets for fertilizers. Developed regions like Europe and North America, along with areas facing nutrient deficiencies, are increasingly adopting specialty fertilizers for their efficacy. These trends are expected to propel the primary nutrient fertilizers market from 2023 to 2030.
Foliar Fertilizer Industry Overview
The Foliar Fertilizer Market is fragmented, with the top five companies occupying 32.55%. The major players in this market are ICL Group Ltd, Indian Farmers Fertiliser Cooperative Limited, Sociedad Quimica y Minera de Chile SA, The Mosaic Company and Yara International ASA (sorted alphabetically).
Additional Benefits:
- The market estimate (ME) sheet in Excel format
- 3 months of analyst support
TABLE OF CONTENTS
1 EXECUTIVE SUMMARY & KEY FINDINGS
2 REPORT OFFERS
3 INTRODUCTION
- 3.1 Study Assumptions & Market Definition
- 3.2 Scope of the Study
- 3.3 Research Methodology
4 KEY INDUSTRY TRENDS
- 4.1 Acreage Of Major Crop Types
- 4.1.1 Field Crops
- 4.1.2 Horticultural Crops
- 4.2 Average Nutrient Application Rates
- 4.2.1 Micronutrients
- 4.2.1.1 Field Crops
- 4.2.1.2 Horticultural Crops
- 4.2.2 Primary Nutrients
- 4.2.2.1 Field Crops
- 4.2.2.2 Horticultural Crops
- 4.2.3 Secondary Macronutrients
- 4.2.3.1 Field Crops
- 4.2.3.2 Horticultural Crops
- 4.2.1 Micronutrients
- 4.3 Agricultural Land Equipped For Irrigation
- 4.4 Regulatory Framework
- 4.5 Value Chain & Distribution Channel Analysis
5 MARKET SEGMENTATION (includes market size in Value in USD and Volume, Forecasts up to 2030 and analysis of growth prospects)
- 5.1 Type
- 5.1.1 Complex
- 5.1.2 Straight
- 5.1.2.1 By Nutrient
- 5.1.2.1.1 Micronutrients
- 5.1.2.1.2 Nitrogenous
- 5.1.2.1.3 Phosphatic
- 5.1.2.1.4 Potassic
- 5.1.2.1.5 Secondary Macronutrients
- 5.2 Crop Type
- 5.2.1 Field Crops
- 5.2.2 Horticultural Crops
- 5.2.3 Turf & Ornamental
- 5.3 Region
- 5.3.1 Asia-Pacific
- 5.3.1.1 Australia
- 5.3.1.2 Bangladesh
- 5.3.1.3 China
- 5.3.1.4 India
- 5.3.1.5 Indonesia
- 5.3.1.6 Japan
- 5.3.1.7 Pakistan
- 5.3.1.8 Philippines
- 5.3.1.9 Thailand
- 5.3.1.10 Vietnam
- 5.3.1.11 Rest of Asia-Pacific
- 5.3.2 Europe
- 5.3.2.1 France
- 5.3.2.2 Germany
- 5.3.2.3 Italy
- 5.3.2.4 Netherlands
- 5.3.2.5 Russia
- 5.3.2.6 Spain
- 5.3.2.7 Ukraine
- 5.3.2.8 United Kingdom
- 5.3.2.9 Rest of Europe
- 5.3.3 Middle East & Africa
- 5.3.3.1 Nigeria
- 5.3.3.2 Saudi Arabia
- 5.3.3.3 South Africa
- 5.3.3.4 Turkey
- 5.3.3.5 Rest of Middle East & Africa
- 5.3.4 North America
- 5.3.4.1 Canada
- 5.3.4.2 Mexico
- 5.3.4.3 United States
- 5.3.4.4 Rest of North America
- 5.3.5 South America
- 5.3.5.1 Argentina
- 5.3.5.2 Brazil
- 5.3.5.3 Rest of South America
- 5.3.1 Asia-Pacific
6 COMPETITIVE LANDSCAPE
- 6.1 Key Strategic Moves
- 6.2 Market Share Analysis
- 6.3 Company Landscape
- 6.4 Company Profiles
- 6.4.1 Grupa Azoty S.A. (Compo Expert)
- 6.4.2 Haifa Group
- 6.4.3 ICL Group Ltd
- 6.4.4 Indian Farmers Fertiliser Cooperative Limited
- 6.4.5 Sociedad Quimica y Minera de Chile SA
- 6.4.6 The Mosaic Company
- 6.4.7 UPL Limited
- 6.4.8 Yara International ASA
7 KEY STRATEGIC QUESTIONS FOR FERTILIZER CEOS
8 APPENDIX
- 8.1 Global Overview
- 8.1.1 Overview
- 8.1.2 Porter's Five Forces Framework
- 8.1.3 Global Value Chain Analysis
- 8.1.4 Market Dynamics (DROs)
- 8.2 Sources & References
- 8.3 List of Tables & Figures
- 8.4 Primary Insights
- 8.5 Data Pack
- 8.6 Glossary of Terms

