


 |
市場調查報告書
商品編碼
1693525
液體肥料:市場佔有率分析、產業趨勢與統計、成長預測(2025-2030)Liquid Fertilizer - Market Share Analysis, Industry Trends & Statistics, Growth Forecasts (2025 - 2030) |
||||||
※ 本網頁內容可能與最新版本有所差異。詳細情況請與我們聯繫。
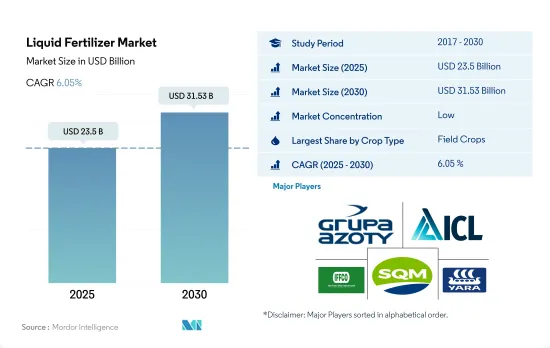
液體肥料市場規模預計在 2025 年達到 235 億美元,預計到 2030 年將達到 315.3 億美元,預測期內(2025-2030 年)的複合年成長率為 6.05%。
增加田間作物液體肥料的消耗
- 田間作物在全球液體肥料市場中佔據主導地位,約佔液體肥料總消費量的77.4%。 2022年田間作物液體肥料消費量將達2,060萬噸,相當於206億美元。由於田間作物的種植面積較大,因此田間作物對液體肥料的消費量較高。世界上超過85.0%的農業用地用於種植田間作物。
- 園藝作物是液體肥料的第二大作物,2022 年約佔全球液體肥料消費量的 19.2%。
- 在新冠疫情爆發後,人們對健康和營養的關注度不斷提高,導致全球對水果和蔬菜等高價值作物的需求增加。番茄、馬鈴薯、洋蔥、捲心菜和花椰菜等高需求蔬菜作物消耗大量肥料,並且全年生長。葉面液體肥料在水果作物中發揮重要作用,因為眾所周知,葉面噴布可以提高水果的品質。
- 草坪和觀賞作物約佔全球液體肥料市場總量的 3.4%,2022 年價值 8.639 億美元,消費量為 907,200 噸。
- 由於污染問題、園林美學景觀日益重要以及全球生態旅遊的發展,草坪和觀賞作物的種植面積正在增加。因此,預計 2023-2030 年期間全球各類作物液體肥料消費量的複合年成長率將達到 5.1%。
美國在該地區液體肥料消費中佔有最大的市場佔有率
- 2022年,亞太液體肥料市場約佔全球液體肥料市場總佔有率的49.9%。該地區的種植者越來越意識到液體肥料的好處,它更容易滲透土壤,使植物更快吸收養分。此外,液體肥料可消除肥料浪費,並可施用於地面或葉子。
- 2022 年,液體肥料佔北美特殊肥料市場的 21.8% 。美國是北美最大的液體肥料消費國,2022 年的佔有率為 74.4%。 2022 年,美國液體肥料市場價值為 31 億美元,消費量為 330 萬噸。
- 歐洲是全球第三大液體肥料市場,約佔液體肥料市場總量的15.6%。這是因為該地區擁有優良的灌溉系統。例如,德國、俄羅斯、英國和法國等國家超過55%的灌溉土地被噴灌和微灌系統所覆蓋,這推動了該地區的市場發展。
- 該地區各國政府繼續透過價格補貼鼓勵採用微灌溉系統。因此,隨著更先進的灌溉方法的採用,預計未來該地區液體肥料的採用量將會增加。
- 因此,由於施用方便、分佈均勻且施用成本降低,因此採用液體肥料的趨勢日益成長。這些因素可能會推動 2023 年至 2030 年期間液體肥料市場的發展。
全球液體肥料市場趨勢
為了滿足日益成長的糧食需求,農業面臨越來越大的壓力,預計田間作物的種植面積將會增加。
- 當前全球農業領域面臨許多挑戰。根據聯合國預測,到2050年,世界人口可能會超過90億。人口成長可能會對農業造成過多的壓力,而由於勞動力短缺和都市化導致的耕地減少,農業產量已經下降。根據聯合國糧食及農業組織預測,2050年,全球70%的人口預計將居住在城市。隨著全球可耕地面積減少,農民需要使用更多的肥料來提高作物產量。
- 亞太地區是世界上最大的農產品生產地區。農業對該地區的經濟至關重要,約佔總勞動力的 20%。該地區以大田作物為主,佔該地區作物總面積的95%以上。水稻、小麥和玉米是該地區的主要田間作物,約佔2022年總種植面積的24.3%。
- 北美洲是世界上第二大可耕地。北美的農場種植多種作物,以田間作物為主。根據美國農業部的數據,玉米、棉花、稻米、大豆和小麥是該地區的主要田間作物。在研究期間,美國佔作物種植面積的 46.2%,佔市場主導地位。 2017年至2019年間,該國作物種植面積大幅下降,主因是不利的環境條件導致德克薩斯州和休士頓等地區發生嚴重洪災。
全球田間作物主要養分氮、鉀、磷的平均施用量為164.31公斤/公頃。
- 玉米、油菜籽、棉花、高粱、稻米、小麥和大豆是世界作物的初級營養消費者。這些田間作物的主要養分施用量分別為 230.57 公斤/公頃、255.75 公斤/公頃、172.70 公斤/公頃、158.46 公斤/公頃、154.49 公斤/公頃、135.35 公斤/公頃和 120.97 公斤/公頃。主要營養素對作物至關重要,因為它們在植物代謝過程中發揮著至關重要的作用,並有助於細胞、細胞膜和葉綠素等組織的形成。磷對於種植優質作物至關重要,而鉀可以激活植物生長發育所必需的酵素。
- 全球田間作物氮、鉀、磷的平均施用量為164.31公斤/公頃。氮肥是田間作物使用最廣泛的大量營養肥料,施用率為 224.6 公斤/公頃,其次是鉀肥,施用率為 150.3 公斤/公頃,磷肥是第三大消費量肥料,2022 年施用率為 117.9 公斤/公頃。
- 2022年,氮肥施用量最高的是油菜,為347.4公斤/公頃。同樣,玉米的磷施用量最高,為156.3公斤/公頃,油菜的鉀施用量最高,為248.6公斤/公頃。全球田間作物種植面積正在增加,尤其是在南美洲和亞太地區。這些都是肥料的潛在成長市場。由於其高效性,專用肥料在歐洲和北美等已開發地區以及營養缺乏現象普遍的地區已廣泛應用。預計這些因素將在 2023 年至 2030 年期間推動主要營養肥料市場的發展。
液體肥料產業概況
液體肥料市場較為分散,前五大企業佔15.48%的市佔率。該市場的主要企業包括 Grupa Azoty SA(Compo Expert)、ICL Group Ltd、Indian Farmers Fertilizer Cooperative Limited、Sociedad Quimica y Minera de Chile SA、Yara International ASA 等。
其他福利
- Excel 格式的市場預測 (ME) 表
- 3個月的分析師支持
目錄
第1章執行摘要和主要發現
第2章 報告要約
第3章 引言
- 研究假設和市場定義
- 研究範圍
- 調查方法
第4章 產業主要趨勢
- 主要作物種植面積
- 田間作物
- 園藝作物
- 平均養分施用量
- 微量營養素
- 田間作物
- 園藝作物
- 主要營養素
- 田間作物
- 園藝作物
- 次要宏量營養素
- 田間作物
- 園藝作物
- 微量營養素
- 灌溉農田
- 法律規範
- 價值鍊和通路分析
第5章市場區隔
- 類型
- 複合型
- 直的
- 按營養成分
- 微量營養素
- 氮
- 磷酸
- 鉀
- 次要宏量營養素
- 應用模式
- 受精
- 葉面噴布
- 作物類型
- 田間作物
- 園藝作物
- 草坪和觀賞植物
- 地區
- 亞太地區
- 澳洲
- 孟加拉
- 中國
- 印度
- 印尼
- 日本
- 巴基斯坦
- 菲律賓
- 泰國
- 越南
- 其他亞太地區
- 歐洲
- 法國
- 德國
- 義大利
- 荷蘭
- 俄羅斯
- 西班牙
- 烏克蘭
- 英國
- 其他歐洲國家
- 中東和非洲
- 奈及利亞
- 沙烏地阿拉伯
- 南非
- 土耳其
- 其他中東和非洲地區
- 北美洲
- 加拿大
- 墨西哥
- 美國
- 北美其他地區
- 南美洲
- 阿根廷
- 巴西
- 南美洲其他地區
- 亞太地區
第6章 競爭格局
- 關鍵策略趨勢
- 市場佔有率分析
- 商業狀況
- 公司簡介
- BMS Micro-Nutrients NV
- Grupa Azoty SA(Compo Expert)
- ICL Group Ltd
- Indian Farmers Fertiliser Cooperative Limited
- Nortox
- Safsulphur
- Sociedad Quimica y Minera de Chile SA
- Yara International ASA
第7章:CEO面臨的關鍵策略問題
第 8 章 附錄
- 世界概況
- 概述
- 五力分析框架
- 全球價值鏈分析
- 市場動態(DRO)
- 資訊來源及延伸閱讀
- 圖片列表
- 關鍵見解
- 數據包
- 詞彙表
The Liquid Fertilizer Market size is estimated at 23.5 billion USD in 2025, and is expected to reach 31.53 billion USD by 2030, growing at a CAGR of 6.05% during the forecast period (2025-2030).
Field crop consumption of liquid fertilizers is increasing
- Field crops dominated the global liquid fertilizer market, accounting for about 77.4% of the total liquid fertilizer consumption. Their volume consumption of liquid fertilizers was 20.6 million metric tons, worth USD 20.6 billion in 2022. The large consumption of liquid fertilizers by field crops is due to the large area under cultivation of these crops. More than 85.0% of the global agricultural land is dedicated to the cultivation of field crops.
- Horticultural crops are the second-largest crop type that consumes liquid fertilizers, accounting for about 19.2% of the global liquid fertilizer consumption in 2022.
- With increasing concerns for health and nutrition after the COVID-19 pandemic, the demand for high-value crops like fruits and vegetables is increasing worldwide. Vegetable crops with major demand, such as tomatoes, potatoes, onions, cabbage, and cauliflower, consume high amounts of fertilizer and are grown throughout the year. Foliar liquid fertilizers play an important role in fruit crops, as foliar spraying is known to improve the quality of fruits.
- Turf and ornamental crops accounted for a share of about 3.4% of the total global liquid fertilizer market and were valued at USD 863.9 million in 2022, with a volume consumption of 907.2 thousand metric tons.
- The area under cultivation of turf and ornamental crops is increasing with concerns over pollution, the growing importance of aesthetic landscaping in gardens, and ecotourism worldwide. Therefore, the global consumption of liquid fertilizers in respective crop types is anticipated to register a CAGR of 5.1% between 2023 and 2030.
The United States occupied the higher market share in liquid fertilizers consumption in the region
- In 2022, the Asia-Pacific liquid fertilizers market accounted for approximately 49.9% of the global liquid fertilizers market's total value share. Growers in the region are increasingly aware of the advantages of liquid fertilizers, such as their ability to penetrate the soil easily and enable plants to absorb nutrients more quickly. Additionally, liquid fertilizers help reduce fertilizer wastage and can be applied either to the ground or to the leaves.
- Liquid fertilizer represented 21.8% of the North American specialty market in 2022. The United States was the top consumer of liquid fertilizers in North America, with a share of 74.4% in 2022. The liquid fertilizer market in the country was valued at USD 3.1 billion in 2022, with a volume consumption of 3.3 million metric tons.
- Europe is the third-largest market for liquid fertilizers in the world, accounting for about 15.6% of the total liquid fertilizer market. This is due to the dominance of better irrigation systems in the region. For instance, countries like Germany, Russia, the United Kingdom, and France have more than 55% of their irrigated land covered by sprinklers or micro-irrigation systems, thus driving the market in the region.
- Governments across the region are continuously promoting the adoption of micro-irrigation systems through price subsidies. Therefore, the adoption of liquid fertilizers in the region is expected to increase in the future, with the increased adoption of advanced irrigation methods.
- Hence, there is an increasing trend toward the adoption of liquid fertilizers due to the ease of application, uniform distribution, and reduction in the cost of application. These factors may drive the liquid fertilizer market between 2023 and 2030.
Global Liquid Fertilizer Market Trends
The rising pressure on the agriculture industry to meet the increasing demand for food is expected to increase the area under field crop cultivation
- The global agricultural sector is currently facing many challenges. According to the UN, the world population is likely to exceed nine billion by 2050. This population growth may overburden the agricultural industry, which is already experiencing an output loss due to a lack of laborers and the shrinkage of agricultural fields caused by rising urbanization. According to the Food and Agriculture Organization, 70% of the global population is expected to live in cities by 2050. Due to the global loss of arable land, farmers now need to utilize more fertilizers to increase crop yields.
- Asia-Pacific is the world's largest producer of agricultural products. Agriculture is critical to the region's economy, as it employs about 20% of the total available workforce. Field crop cultivation dominates the region, accounting for more than 95% of the total crop area in the region. Rice, wheat, and corn are the major field crops produced in the region, which accounted for about 24.3% of the total crop area in 2022.
- North America is the second-largest arable region of the total agricultural land area in the world. Diverse varieties of crops are grown in North American farms, primarily field crops. As per the USDA, corn, cotton, rice, soybean, and wheat are among the region's dominant field crops. The United States dominated the market by accounting for 46.2% of the total area under crop cultivation during the study period, with field crops covering the majority of the area compared to other crop types. Crop acreage in the country fell significantly between 2017 and 2019, primarily due to unfavorable environmental conditions that resulted in heavy floods in areas such as Texas and Houston.
The global average application rate of primary nutrient nitrogen, potassium, and phosphorus in field crops is 164.31 kg/ha
- Corn, rapeseed, cotton, sorghum, rice, wheat, and soybean are some of the major primary nutrient-consuming crops worldwide. The primary nutrient application rates for these field crops are 230.57 kg/ha, 255.75 kg/ha, 172.70 kg/ha, 158.46 kg/ha, 154.49 kg/ha, 135.35 kg/ha, and 120.97 kg/ha, respectively. Primary nutrient fertilizers are crucial for crops because they play an essential role in plant metabolic processes and assist in forming tissues such as cells, cell membranes, and chlorophyll. Phosphorus is essential for growing high-quality crops; potassium activates the enzymes needed for plant growth and development.
- The global average application rate of nitrogen, potassium, and phosphorus in field crops is 164.31 kg/ha. Nitrogen is the most widely used primary nutrient fertilizer in field crops, accounting for an application rate of 224.6 kg/hectare, followed by potassic fertilizers with 150.3 kg/hectare, and phosphorus was the third most consumed fertilizer with an application rate of 117.9 kg/hectare in 2022.
- In 2022, the nitrogen application rate was highest in rapeseed at 347.4 kg/hectare. Similarly, the phosphorus application rate was highest in corn at 156.3 kg/hectare, and the potassium application rate was highest in canola at 248.6 kg/hectare. The global field crop cultivation area is increasing, particularly in South America and Asia-Pacific. These are the potential growing markets for fertilizers. Due to their efficiency, specialty fertilizers are widely used in developed regions such as Europe, North America, and other regions with widespread nutrient deficiencies. These factors are anticipated to drive the primary nutrient fertilizers market between 2023 and 2030.
Liquid Fertilizer Industry Overview
The Liquid Fertilizer Market is fragmented, with the top five companies occupying 15.48%. The major players in this market are Grupa Azoty S.A. (Compo Expert), ICL Group Ltd, Indian Farmers Fertiliser Cooperative Limited, Sociedad Quimica y Minera de Chile SA and Yara International ASA (sorted alphabetically).
Additional Benefits:
- The market estimate (ME) sheet in Excel format
- 3 months of analyst support
TABLE OF CONTENTS
1 EXECUTIVE SUMMARY & KEY FINDINGS
2 REPORT OFFERS
3 INTRODUCTION
- 3.1 Study Assumptions & Market Definition
- 3.2 Scope of the Study
- 3.3 Research Methodology
4 KEY INDUSTRY TRENDS
- 4.1 Acreage Of Major Crop Types
- 4.1.1 Field Crops
- 4.1.2 Horticultural Crops
- 4.2 Average Nutrient Application Rates
- 4.2.1 Micronutrients
- 4.2.1.1 Field Crops
- 4.2.1.2 Horticultural Crops
- 4.2.2 Primary Nutrients
- 4.2.2.1 Field Crops
- 4.2.2.2 Horticultural Crops
- 4.2.3 Secondary Macronutrients
- 4.2.3.1 Field Crops
- 4.2.3.2 Horticultural Crops
- 4.2.1 Micronutrients
- 4.3 Agricultural Land Equipped For Irrigation
- 4.4 Regulatory Framework
- 4.5 Value Chain & Distribution Channel Analysis
5 MARKET SEGMENTATION (includes market size in Value in USD and Volume, Forecasts up to 2030 and analysis of growth prospects)
- 5.1 Type
- 5.1.1 Complex
- 5.1.2 Straight
- 5.1.2.1 By Nutrient
- 5.1.2.1.1 Micronutrients
- 5.1.2.1.2 Nitrogenous
- 5.1.2.1.3 Phosphatic
- 5.1.2.1.4 Potassic
- 5.1.2.1.5 Secondary Macronutrients
- 5.2 Application Mode
- 5.2.1 Fertigation
- 5.2.2 Foliar
- 5.3 Crop Type
- 5.3.1 Field Crops
- 5.3.2 Horticultural Crops
- 5.3.3 Turf & Ornamental
- 5.4 Region
- 5.4.1 Asia-Pacific
- 5.4.1.1 Australia
- 5.4.1.2 Bangladesh
- 5.4.1.3 China
- 5.4.1.4 India
- 5.4.1.5 Indonesia
- 5.4.1.6 Japan
- 5.4.1.7 Pakistan
- 5.4.1.8 Philippines
- 5.4.1.9 Thailand
- 5.4.1.10 Vietnam
- 5.4.1.11 Rest of Asia-Pacific
- 5.4.2 Europe
- 5.4.2.1 France
- 5.4.2.2 Germany
- 5.4.2.3 Italy
- 5.4.2.4 Netherlands
- 5.4.2.5 Russia
- 5.4.2.6 Spain
- 5.4.2.7 Ukraine
- 5.4.2.8 United Kingdom
- 5.4.2.9 Rest of Europe
- 5.4.3 Middle East & Africa
- 5.4.3.1 Nigeria
- 5.4.3.2 Saudi Arabia
- 5.4.3.3 South Africa
- 5.4.3.4 Turkey
- 5.4.3.5 Rest of Middle East & Africa
- 5.4.4 North America
- 5.4.4.1 Canada
- 5.4.4.2 Mexico
- 5.4.4.3 United States
- 5.4.4.4 Rest of North America
- 5.4.5 South America
- 5.4.5.1 Argentina
- 5.4.5.2 Brazil
- 5.4.5.3 Rest of South America
- 5.4.1 Asia-Pacific
6 COMPETITIVE LANDSCAPE
- 6.1 Key Strategic Moves
- 6.2 Market Share Analysis
- 6.3 Company Landscape
- 6.4 Company Profiles
- 6.4.1 BMS Micro-Nutrients NV
- 6.4.2 Grupa Azoty S.A. (Compo Expert)
- 6.4.3 ICL Group Ltd
- 6.4.4 Indian Farmers Fertiliser Cooperative Limited
- 6.4.5 Nortox
- 6.4.6 Safsulphur
- 6.4.7 Sociedad Quimica y Minera de Chile SA
- 6.4.8 Yara International ASA
7 KEY STRATEGIC QUESTIONS FOR FERTILIZER CEOS
8 APPENDIX
- 8.1 Global Overview
- 8.1.1 Overview
- 8.1.2 Porter's Five Forces Framework
- 8.1.3 Global Value Chain Analysis
- 8.1.4 Market Dynamics (DROs)
- 8.2 Sources & References
- 8.3 List of Tables & Figures
- 8.4 Primary Insights
- 8.5 Data Pack
- 8.6 Glossary of Terms
 液態肥料市場:2026-2032年全球市場預測(依產品類型、作物、生產流程、應用及通路分類)
 液體肥料市場規模、佔有率、成長及全球產業分析:按類型、應用和地區分類的洞察,2026-2034 年預測
 全球液體肥料市場報告(2026 年)按作物類型、包裝規格、應用、最終用途和銷售管道的多元素水溶性液體肥料市場—2026-2032年全球預測
 液態肥料市場規模、佔有率及成長分析(依作物類型、化合物、應用、類型及地區分類)-2026-2033年產業預測液體肥料市場-2025-2030年預測
 液體肥料市場-全球產業規模、佔有率、趨勢、機會和預測,按類型、應用方式、成分類型、作物類型、地區和競爭情況分類,2020-2030 年
 液體肥料市場機會、成長動力、產業趨勢分析及2025-2034年預測
 2025-2033年液體肥料市場報告(按類型、生產流程、作物、施用方式和地區)
 北美液體肥料:市場佔有率分析、行業趨勢和統計、成長預測(2025-2030 年)