


 |
市場調查報告書
商品編碼
1693524
水溶性肥料:市場佔有率分析、產業趨勢與成長預測(2025-2030)Water Soluble Fertilizer - Market Share Analysis, Industry Trends & Statistics, Growth Forecasts (2025 - 2030) |
||||||
※ 本網頁內容可能與最新版本有所差異。詳細情況請與我們聯繫。
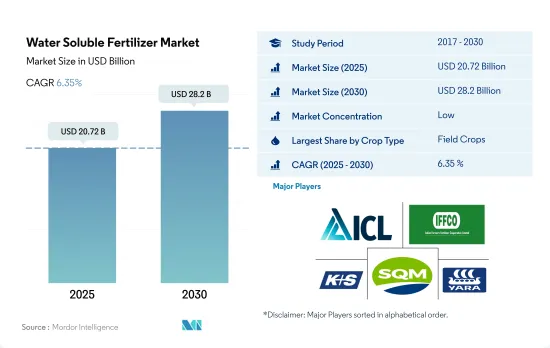
預計 2025 年水溶性肥料市場規模將達到 207.2 億美元,到 2030 年將達到 282 億美元,預測期內(2025-2030 年)的複合年成長率為 6.35%。
耕地面積的擴大促進了水溶性肥料的需求,提高了生產力。
- 田間作物種植在世界範圍內占主導地位,約佔可溶性肥料總消費量的78.8%。這些作物的種植消耗了2,910萬噸可溶性肥料,價值181.9億美元。由於田間作物種植面積較大,因此大田作物對水溶性肥料的消費量較高。世界上90.0%以上的農業用地用於種植田間作物。
- 一般來說,園藝作物對水溶性肥料的需求很高,因為它們配備了噴灌和微灌系統等灌溉設施。水溶性肥料可以採用葉面噴布或灌溉方法施用。園藝作物是第二大水溶性肥料消耗作物,佔 2022 年全球水溶性肥料市場規模的約 18.8%。葉面水溶性肥料在水果作物中發揮重要作用,因為眾所周知,葉面噴布可以提高水果品質。
- 草坪和觀賞作物約佔全球可溶性肥料市場的 3.5%,消耗量為 984,000 噸。這些作物在各種應用中的需求不斷增加以及環保肥料的採用正在擴大這些作物的水溶性肥料的市場。由於草皮和觀賞作物種植面積的增加,預計市場將以 5.4% 的複合年成長率成長。這是因為人們越來越關注污染,並且全世界越來越重視美觀的景觀和生態旅遊。
- 因此,預計 2023-2030 年期間全球各類作物可溶性肥料的消費量都將成長。
由於農民優先考慮最大限度地提高作物產量,市場正在見證成長
- 亞太地區水溶肥市場佔據43.9%的市場佔有率,在研究期間呈現穩定成長,全部區域到2022年將達到101億美元。田間作物佔比最大,為81.6%,其次是園藝作物。
- 過去幾年,我國水溶肥產業憑藉著諸多優勢,取得了顯著的成長與發展。事實證明,該行業是減少化肥使用、水、勞動力和成本,同時提高作物產量和品質的有效解決方案。這一成長得益於政府對現代農業發展的優惠政策和對該行業的大量投資。
- 北美特種肥料市場以水溶性肥料為主,2022 年的市場佔有率為 52.8%。這些肥料的需求受到各種營養等級和不同施用方式的影響,例如根據特定的施用要求而葉面噴布和灌溉。分析認為,2022年,施肥模式的市場佔有率將佔54.7%,葉面施肥模式的市佔率將佔45.3%。
- 近年來,全球農民對水溶性肥料等特殊肥料的需求大幅增加。這種趨勢背後的主要原因是農民越來越傾向於最大限度地提高每公頃作物的產量。眾所周知,這些肥料能夠以易於取得的形式為作物提供所需的營養,促進植物生長並提高產量。因此,預計市場將在 2023 年至 2030 年間持續成長。
全球水溶性肥料市場趨勢
為滿足日益成長的糧食需求,農業產業面臨的壓力預計將導致田間作物種植面積增加
- 當前全球農業領域面臨許多挑戰。根據聯合國預測,到 2050 年,世界人口可能超過 90 億。人口成長可能對農業造成過度壓力,而由於勞動力短缺和都市化加劇導致的耕地減少,農業產量已經在下降。根據聯合國糧食及農業組織預測,2050年,全球70%的人口預計將居住在城市。隨著全球可耕地面積減少,農民需要使用更多的肥料來提高作物產量。
- 亞太地區是世界上最大的農產品生產地區。農業對該地區的經濟至關重要,約佔總勞動力的 20%。該地區以大田作物為主,佔該地區作物總面積的95%以上。水稻、小麥和玉米是該地區的主要田間作物,約佔2022年總耕地面積的24.3%。
- 北美洲是世界上第二大可耕地。該農場種植多種作物,主要為田間作物。尤其是玉米、棉花、稻米、大豆和小麥,都是美國農業部強調的主要田間作物。 2022年,美國佔北美作物種植面積的46.2%。然而,2017年至2019年期間,該國作物種植面積大幅下降,主要原因是惡劣的環境條件導致德克薩斯和休士頓等地區發生嚴重洪災。
全球田間作物主要養分氮、鉀、磷的平均施用量為164.31公斤/公頃。
- 玉米、油菜、棉花、高粱、水稻、小麥和大豆是世界主要的營養密集作物。這些作物主要養分的平均施用量分別為230.57公斤/公頃、255.75公斤/公頃、172.70公斤/公頃、158.46公斤/公頃、154.49公斤/公頃、135.35公斤/公頃和120.97公斤/公頃/公頃。主要營養肥料對作物至關重要,因為它們促進植物中的重要代謝過程,並有助於細胞、細胞膜和葉綠素等關鍵組織的形成。磷對於種植優質作物至關重要,而鉀可以激活植物生長所必需的酵素。
- 全球田間作物氮、鉀、磷的平均施用量為164.31公斤/公頃。使用最廣泛的基肥是氮肥,施用量為224.6公斤/公頃,其次是鉀肥,施用量為150.3公斤/公頃。磷排在第三位,2022 年的施用率為 117.9 公斤/公頃。
- 2022年,油菜籽施用氮量最高,為347.4公斤/公頃,玉米施用磷量最高,為156.3公斤/公頃。油菜籽鉀施用量最高,248.6公斤/公頃。
- 全球田間作物種植面積正在增加,尤其是南美洲和亞太地區是肥料的潛在成長市場。歐洲和北美等已開發地區以及遭受營養缺乏的地區擴大轉向使用特種肥料,以提高其有效性。這些因素將在未來幾年推動主要營養肥料市場的發展。
水溶性肥料產業概況
水溶肥市場分散,前五大企業佔27.25%的市佔率。該市場的主要企業包括 ICL Group Ltd、印度農民化肥合作社有限公司、K+S Aktiengesellschaft、Sociedad Quimica y Minera de Chile SA、Yara International ASA 等。
其他福利
- Excel 格式的市場預測 (ME) 表
- 3個月的分析師支持
目錄
第1章執行摘要和主要發現
第2章 報告要約
第3章 引言
- 研究假設和市場定義
- 研究範圍
- 調查方法
第4章 產業主要趨勢
- 主要作物種植面積
- 田間作物
- 園藝作物
- 平均養分施用量
- 微量營養素
- 田間作物
- 園藝作物
- 主要營養素
- 田間作物
- 園藝作物
- 次要宏量營養素
- 田間作物
- 園藝作物
- 微量營養素
- 灌溉農田
- 法律規範
- 價值鍊和通路分析
第5章市場區隔
- 類型
- 複合型
- 直的
- 按營養成分
- 微量營養素
- 氮
- 磷酸
- 鉀
- 次要宏量營養素
- 應用模式
- 受精
- 葉面噴布
- 作物類型
- 田間作物
- 園藝作物
- 草坪和觀賞植物
- 地區
- 亞太地區
- 澳洲
- 孟加拉
- 中國
- 印度
- 印尼
- 日本
- 巴基斯坦
- 菲律賓
- 泰國
- 越南
- 其他亞太地區
- 歐洲
- 法國
- 德國
- 義大利
- 荷蘭
- 俄羅斯
- 西班牙
- 烏克蘭
- 英國
- 其他歐洲國家
- 中東和非洲
- 奈及利亞
- 沙烏地阿拉伯
- 南非
- 土耳其
- 其他中東和非洲地區
- 北美洲
- 加拿大
- 墨西哥
- 美國
- 北美其他地區
- 南美洲
- 阿根廷
- 巴西
- 南美洲其他地區
- 亞太地區
第6章競爭格局
- 關鍵策略趨勢
- 市場佔有率分析
- 商業狀況
- 公司簡介
- BMS Micro-Nutrients NV
- Coromandel International Ltd.
- Grupa Azoty SA(Compo Expert)
- Haifa Group
- ICL Group Ltd
- Indian Farmers Fertiliser Cooperative Limited
- K+S Aktiengesellschaft
- Sociedad Quimica y Minera de Chile SA
- Yara International ASA
第7章 CEO 的關鍵策略問題
第 8 章 附錄
- 世界概況
- 概述
- 五力分析框架
- 全球價值鏈分析
- 市場動態(DRO)
- 資訊來源及延伸閱讀
- 圖片列表
- 關鍵見解
- 數據包
- 詞彙表
The Water Soluble Fertilizer Market size is estimated at 20.72 billion USD in 2025, and is expected to reach 28.2 billion USD by 2030, growing at a CAGR of 6.35% during the forecast period (2025-2030).
The expansion of cultivation areas is driving the demand for water-soluble fertilizers, improving productivity
- Field crop cultivation dominates globally, accounting for about 78.8% of the total water-soluble fertilizer consumption. The cultivation of these crops led to a consumption of 29.1 million metric tons of water-soluble fertilizers, valued at USD 18.19 billion. The large consumption of water-soluble fertilizers by field crops was due to the large area under the cultivation of these crops. More than 90.0% of the global agricultural land is dedicated to the cultivation of field crops.
- Generally, there is more demand for water-soluble fertilizers in horticultural crops, as they are well-equipped for irrigation like sprinkler or micro irrigation systems. Water-soluble fertilizers can be applied using the foliar or fertigation method. Horticultural crops are the second-largest crop types that consume water-soluble fertilizers, and they accounted for about 18.8% of the global water-soluble fertilizer market volume in 2022. Foliar water-soluble fertilizers play an important role in fruit crops, as foliar spraying is known to improve the quality of the fruits.
- Turf & ornamental crops account for about 3.5% of the global water-soluble fertilizer market volume and consume 984.0 thousand million metric tons. The growing demand for these crops in various applications and the adoption of environmentally friendly fertilizers are increasing the market for water-soluble fertilizers in these crops. The market is expected to register a CAGR of 5.4% due to the increasing area under cultivation of turf & ornamental crops. This is due to the increasing concern over pollution and the growing importance of aesthetic landscaping gardens and ecotourism globally.
- Therefore, the global consumption of water-soluble fertilizers in respective crop types is anticipated to grow during 2023-2030.
The market is witnessing growth as farmers prioritize maximizing crop yields
- The Asia-Pacific water-soluble fertilizer market accounted for 43.9% of the market share and witnessed stable growth during the study period, with an overall value in the region amounting to USD 10.1 billion in 2022. Field crops occupied the largest share of 81.6%, followed by horticultural crops.
- Over the past few years, the soluble fertilizer industry in China has experienced significant growth and development due to its numerous benefits. This industry has proven to be an effective solution for reducing fertilizer usage, water, labor, and cost while simultaneously increasing crop yield and quality. This growth has been facilitated by the government's favorable policies toward modern agriculture development and substantial investment in the industry.
- The market for specialty fertilizers in North America is largely dominated by water-soluble fertilizers, which held a market share of 52.8% in 2022. The demand for these fertilizers is influenced by the variety of nutrient grades available, as well as the different application modes such as foliar or fertigation, depending on the specific application requirements. Based on the analysis, the fertigation mode accounted for 54.7% of the market share in 2022, while the foliar application mode accounted for 45.3%.
- In recent years, there has been a considerable surge in the demand for specialized fertilizers, such as water-soluble fertilizers, among farmers worldwide. The primary reason behind this trend is that farmers are increasingly looking to maximize their crop yield per hectare. These fertilizers are known to provide the required nutrients to the crops in a readily available form, promoting better plant growth and yield. As a result, the market is expected to continue to grow during 2023-2030.
Global Water Soluble Fertilizer Market Trends
The rising pressure on the agriculture industry to meet the growing food demand is expected to increase the area under field crop cultivation
- The global agricultural sector is currently facing many challenges. According to the United Nations, the world population may exceed 9 billion by 2050. This population growth could overburden the agricultural industry, which is already experiencing an output loss due to a lack of laborers and the shrinkage of agricultural fields caused by rising urbanization. According to the Food and Agriculture Organization, 70% of the global population is expected to live in cities by 2050. Due to the global loss of arable land, farmers now need to utilize more fertilizers to increase crop yields.
- Asia-Pacific is the world's largest producer of agricultural products. Agriculture is critical to the region's economy, as it employs about 20% of the total available workforce. Field crop cultivation dominates the region, accounting for more than 95% of the total crop area in the region. Rice, wheat, and corn are the major field crops produced in the region, together accounting for about 24.3% of the total crop area in 2022.
- North America ranks as the second-largest arable region globally. Its farms cultivate a diverse range of crops, with a focus on field crops. Notably, corn, cotton, rice, soybean, and wheat are the prominent field crops, as highlighted by the USDA. In 2022, the United States accounted for 46.2% of North America's crop cultivation area. However, the country witnessed a significant drop in crop acreage between 2017 and 2019, primarily due to adverse environmental conditions, leading to severe flooding in regions like Texas and Houston.
The global average application rate of primary nutrient nitrogen, potassium, and phosphorus in field crops is 164.31 kg/ha
- Corn, rapeseed, cotton, sorghum, rice, wheat, and soybean are among the primary nutrient-intensive crops globally. The average application rates for primary nutrients in these crops were 230.57 kg/ha, 255.75 kg/ha, 172.70 kg/ha, 158.46 kg/ha, 154.49 kg/ha, 135.35 kg/ha, and 120.97 kg/ha, respectively. Primary nutrient fertilizers are vital for crops as they facilitate crucial plant metabolic processes and contribute to the formation of key tissues, including cells, cell membranes, and chlorophyll. Phosphorus is pivotal for cultivating high-quality crops, while potassium activates enzymes crucial for plant growth.
- The global average application rate for nitrogen, potassium, and phosphorus in field crops stands at 164.31 kg/ha. Nitrogen leads the pack as the most widely used primary nutrient fertilizer, with an application rate of 224.6 kg/ha, followed by potassic fertilizers at 150.3 kg/ha. Phosphorus ranks third, with an application rate of 117.9 kg/ha in 2022.
- In 2022, rapeseed recorded the highest nitrogen application rate at 347.4 kg/ha, while corn topped the phosphorus application rate at 156.3 kg/ha. Canola took the lead for potassium application, with a rate of 248.6 kg/ha.
- The global cultivation area for field crops is on the rise, notably in South America and the Asia-Pacific region, making them potential growth markets for fertilizers. Developed regions like Europe and North America, along with areas grappling with nutrient deficiencies, are increasingly turning to specialty fertilizers for their efficacy. These factors are poised to propel the primary nutrient fertilizers market in the coming years.
Water Soluble Fertilizer Industry Overview
The Water Soluble Fertilizer Market is fragmented, with the top five companies occupying 27.25%. The major players in this market are ICL Group Ltd, Indian Farmers Fertiliser Cooperative Limited, K+S Aktiengesellschaft, Sociedad Quimica y Minera de Chile SA and Yara International ASA (sorted alphabetically).
Additional Benefits:
- The market estimate (ME) sheet in Excel format
- 3 months of analyst support
TABLE OF CONTENTS
1 EXECUTIVE SUMMARY & KEY FINDINGS
2 REPORT OFFERS
3 INTRODUCTION
- 3.1 Study Assumptions & Market Definition
- 3.2 Scope of the Study
- 3.3 Research Methodology
4 KEY INDUSTRY TRENDS
- 4.1 Acreage Of Major Crop Types
- 4.1.1 Field Crops
- 4.1.2 Horticultural Crops
- 4.2 Average Nutrient Application Rates
- 4.2.1 Micronutrients
- 4.2.1.1 Field Crops
- 4.2.1.2 Horticultural Crops
- 4.2.2 Primary Nutrients
- 4.2.2.1 Field Crops
- 4.2.2.2 Horticultural Crops
- 4.2.3 Secondary Macronutrients
- 4.2.3.1 Field Crops
- 4.2.3.2 Horticultural Crops
- 4.2.1 Micronutrients
- 4.3 Agricultural Land Equipped For Irrigation
- 4.4 Regulatory Framework
- 4.5 Value Chain & Distribution Channel Analysis
5 MARKET SEGMENTATION (includes market size in Value in USD and Volume, Forecasts up to 2030 and analysis of growth prospects)
- 5.1 Type
- 5.1.1 Complex
- 5.1.2 Straight
- 5.1.2.1 By Nutrient
- 5.1.2.1.1 Micronutrients
- 5.1.2.1.2 Nitrogenous
- 5.1.2.1.3 Phosphatic
- 5.1.2.1.4 Potassic
- 5.1.2.1.5 Secondary Macronutrients
- 5.2 Application Mode
- 5.2.1 Fertigation
- 5.2.2 Foliar
- 5.3 Crop Type
- 5.3.1 Field Crops
- 5.3.2 Horticultural Crops
- 5.3.3 Turf & Ornamental
- 5.4 Region
- 5.4.1 Asia-Pacific
- 5.4.1.1 Australia
- 5.4.1.2 Bangladesh
- 5.4.1.3 China
- 5.4.1.4 India
- 5.4.1.5 Indonesia
- 5.4.1.6 Japan
- 5.4.1.7 Pakistan
- 5.4.1.8 Philippines
- 5.4.1.9 Thailand
- 5.4.1.10 Vietnam
- 5.4.1.11 Rest of Asia-Pacific
- 5.4.2 Europe
- 5.4.2.1 France
- 5.4.2.2 Germany
- 5.4.2.3 Italy
- 5.4.2.4 Netherlands
- 5.4.2.5 Russia
- 5.4.2.6 Spain
- 5.4.2.7 Ukraine
- 5.4.2.8 United Kingdom
- 5.4.2.9 Rest of Europe
- 5.4.3 Middle East & Africa
- 5.4.3.1 Nigeria
- 5.4.3.2 Saudi Arabia
- 5.4.3.3 South Africa
- 5.4.3.4 Turkey
- 5.4.3.5 Rest of Middle East & Africa
- 5.4.4 North America
- 5.4.4.1 Canada
- 5.4.4.2 Mexico
- 5.4.4.3 United States
- 5.4.4.4 Rest of North America
- 5.4.5 South America
- 5.4.5.1 Argentina
- 5.4.5.2 Brazil
- 5.4.5.3 Rest of South America
- 5.4.1 Asia-Pacific
6 COMPETITIVE LANDSCAPE
- 6.1 Key Strategic Moves
- 6.2 Market Share Analysis
- 6.3 Company Landscape
- 6.4 Company Profiles
- 6.4.1 BMS Micro-Nutrients NV
- 6.4.2 Coromandel International Ltd.
- 6.4.3 Grupa Azoty S.A. (Compo Expert)
- 6.4.4 Haifa Group
- 6.4.5 ICL Group Ltd
- 6.4.6 Indian Farmers Fertiliser Cooperative Limited
- 6.4.7 K+S Aktiengesellschaft
- 6.4.8 Sociedad Quimica y Minera de Chile SA
- 6.4.9 Yara International ASA
7 KEY STRATEGIC QUESTIONS FOR FERTILIZER CEOS
8 APPENDIX
- 8.1 Global Overview
- 8.1.1 Overview
- 8.1.2 Porter's Five Forces Framework
- 8.1.3 Global Value Chain Analysis
- 8.1.4 Market Dynamics (DROs)
- 8.2 Sources & References
- 8.3 List of Tables & Figures
- 8.4 Primary Insights
- 8.5 Data Pack
- 8.6 Glossary of Terms
 水溶性肥料市場規模、佔有率和成長分析(按類型、形態、應用方法、作物類型、分銷管道和地區分類)—產業預測(2026-2033 年)
 全球水溶性肥料市場按類型、產品類型、配方、包裝類型、作物類型、分銷管道和最終用途分類-預測至2025-2030年
 水溶性肥料市場機會、成長動力、產業趨勢分析及2025-2034年預測
 2025年全球含氮水溶肥市場報告2025年全球水溶性肥料市場報告
 水溶性肥料市場規模、佔有率和趨勢分析報告:按產品、作物、應用、地區和細分市場預測,2025-2033 年
 2032年水溶性肥料市場預測:按肥料類型、作物類型、形態、應用、最終用戶和地區分類的全球分析
 2025-2029年全球水溶性肥料市場
 水溶性肥料市場 - 全球產業規模、佔有率、趨勢、機會和預測,按類型、成分、作物、應用、地區和競爭細分,2020-2030 年
 水溶肥市場:2025年至2030年預測