


 |
市場調查報告書
商品編碼
1693520
次生大分子營養肥料:市場佔有率分析、產業趨勢與統計、成長預測(2025-2030)Secondary Macronutrients Fertilizer - Market Share Analysis, Industry Trends & Statistics, Growth Forecasts (2025 - 2030) |
||||||
※ 本網頁內容可能與最新版本有所差異。詳細情況請與我們聯繫。
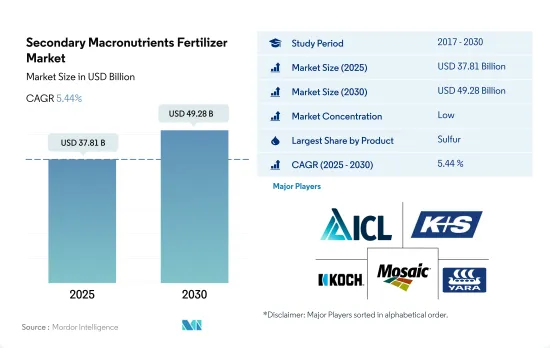
預計 2025 年次要營養素肥料市場規模將達到 378.1 億美元,到 2030 年將達到 492.8 億美元,預測期內(2025-2030 年)的複合年成長率為 5.44%。
硫肥的採用率高於其他次要營養元素
- 2021年,硫佔全球次要營養元素肥料市場的42.6%。 2021年,歐洲硫磺市場價值約為11.9億美元。其中特種硫肥的市場佔有率約為49.4%,常規硫肥的市場佔有率約為50.1%。專用硫肥的採用率高於其他中量營養素。預計預測期結束時特種硫肥市場規模將達 18.2 億美元。
- 2021 年,鎂佔全球次要營養元素肥料市場的 48.9% 。田間作物佔比最大,為 88.8%,其次是草坪和觀賞作物,為 3.9%,園藝作物為 7.3%。耗肥最多的作物是小麥和玉米,總合佔土地面積的40.0%。
- 鈣佔全球次要營養素肥料市場總量的 8.4%,2021 年的價值約為 5.387 億美元。亞太地區在鈣肥市場佔據主導地位,約佔全球鈣肥市場的 41.1%,2021 年的價值為 2.216 億美元。亞太地區在鈣肥市場的主導地位主要是由於土壤酸化,導致鈣和鎂等鹼性陽離子的流失,並被鐵和鋁錯合等酸性元素所取代。
- 由於作物種植面積減少,進而需要提高生產率,因此預測期內對次生大量營養肥料的需求預計會增加。
氣候變遷和土壤 pH 值的波動可能會推動市場
- 施用中量營養素肥料對作物產量有正面的影響。隨著現代產量作物系統的出現,對鈣、鎂和硫的需求不斷增加,這些元素已被證明在植物生產力中發揮著至關重要的作用。
- 亞太地區在全球二次大宗營養肥料市場中佔據主導地位,到 2022 年將佔 39.2% 的佔有率。在該地區,硫佔大部分佔有率,為 63.5%,其次是鎂,為 30.0%。水稻是亞太地區最主要的穀物作物,佔全球產量和消費量的90%。該地區的土壤缺乏硫,因此需要透過施肥來補充重要的微量元素硫,以促進植物的生長和產量。
- 在 2022 年全球次生大分子營養肥料市場中,歐洲以 26.9% 的佔有率位居第二。硫磺是2022年最主要的次要營養元素肥料,佔市佔率的67.4%。俄羅斯成為歐洲市場的主導者,市場佔有率19.2%。
- 2022年,南美洲的次要大分子營養元素肥料市場佔全球市場的11.5%。最近的乾旱和熱浪阻礙了該地區土壤的養分供應,促使人們採用二次大量營養肥料來彌補這些缺陷。
- 次要營養素在維持植物營養平衡方面發揮著至關重要的作用,每種營養素都會影響特定的代謝過程。隨著人們越來越認知到最佳化植物營養的重要性,這種動態可能會在未來幾年推動市場成長。
中量營養素肥料的全球市場趨勢
為滿足日益成長的糧食需求,農業部門面臨越來越大的壓力,預計田間作物的種植面積將會增加。
- 當前全球農業領域面臨許多挑戰。根據聯合國預測,到2050年世界人口將超過90億。人口成長可能會給農業部門帶來過度壓力,而由於勞動力短缺和都市化進程加快導致的耕地減少,農業部門的產量已經下降。根據聯合國糧食及農業組織預測,2050年,全球70%的人口預計將居住在城市。隨著全球可耕地面積減少,農民需要使用更多的肥料來提高作物產量。
- 亞太地區是世界上最大的農產品生產地區。農業對該地區的經濟至關重要,約佔總勞動力的 20%。該地區以大田作物為主,佔作物總面積的95%以上。水稻、小麥和玉米是該地區的主要田間作物,2022年約佔總耕地面積的24.3%。
- 北美洲是世界上第二大可耕地。該農場種植多種作物,主要為田間作物。尤其是玉米、棉花、稻米、大豆和小麥,都是美國農業部強調的主要田間作物。 2022年,美國佔北美作物種植面積的46.2%。然而,2017年至2019年期間,該國種植面積大幅下降,主要原因是惡劣天氣導致德克薩斯和休士頓等地區發生嚴重洪災。
硫在植物體內無法移動,需要從早期生長到收穫期間的穩定供應;供應不足會限制產量。
- 2022年全球田間作物中次生大量營養元素的平均施用率為33.73公斤/公頃。同年鈣施用量約39.20公斤/公頃,鎂施用量約34.51公斤/公頃,硫施用量為27.47公斤/公頃。鈣有助於其他必需營養素的吸收。鎂是促進植物生長和開花的優良酵素活化劑。植物對次要大量營養素的需求量很小,且不能被主要營養素取代。
- 2022 年平均硫施用量最高的是玉米,為 34.33 公斤/公頃,其次是棉花,為 29.72 公斤/公頃,油菜籽/油菜籽為 27.57 公斤/公頃。硫在植物內部無法移動,因此從生長初期直到收穫都需要穩定的供應。生長過程中任何階段缺乏硫都會導致產量下降。隨著 N、P 和 K 的需求幾乎得到滿足,其他營養物質的缺乏開始出現。硫是繼氮、磷、鉀之後的第四大重要營養元素,但通常只需要少量。
- 南美洲、中東和非洲以及亞太地區是次要大量營養素的主要消耗地區,平均施肥量最高,2022 年分別為 39.27 公斤/公頃、32.79 公斤/公頃和 32.74 公斤/公頃。種植者認知到次要大量營養素的重要性,因為它們是植物的重要營養素,可以支持更強的細胞壁,減少擦傷並預防田間作物的疾病。儘管次要大量營養素對產量的限制小於主要大量營養素,但作物仍需要次要大量營養素來最佳化生產力。
二次大量營養肥料產業概況
中次大營養元素肥料市場較為分散,前五大公司佔比為10.61%。該市場的主要企業有:ICL Group Ltd、K+S Aktiengesellschaft、Koch Industries Inc.、The Mosaic Company 和 Yara International ASA(按字母順序排列)
其他福利
- Excel 格式的市場預測 (ME) 表
- 3個月的分析師支持
目錄
第1章執行摘要和主要發現
第2章 報告要約
第3章 引言
- 研究假設和市場定義
- 研究範圍
- 調查方法
第4章 產業主要趨勢
- 主要作物種植面積
- 田間作物
- 園藝作物
- 平均養分施用量
- 次要宏量營養素
- 田間作物
- 園藝作物
- 次要宏量營養素
- 灌溉農田
- 法律規範
- 價值鍊和通路分析
第5章市場區隔
- 類型
- 直的
- 次要營養物質
- 鈣
- 鎂
- 硫
- 直的
- 應用模式
- 受精
- 葉面噴布
- 土壤
- 作物類型
- 田間作物
- 園藝作物
- 草坪和觀賞植物
- 地區
- 亞太地區
- 澳洲
- 孟加拉
- 中國
- 印度
- 印尼
- 日本
- 巴基斯坦
- 菲律賓
- 泰國
- 越南
- 其他亞太地區
- 歐洲
- 法國
- 德國
- 義大利
- 荷蘭
- 俄羅斯
- 西班牙
- 烏克蘭
- 英國
- 其他歐洲國家
- 中東和非洲
- 奈及利亞
- 沙烏地阿拉伯
- 南非
- 土耳其
- 其他中東和非洲地區
- 北美洲
- 加拿大
- 墨西哥
- 美國
- 北美其他地區
- 南美洲
- 阿根廷
- 巴西
- 南美洲其他地區
- 亞太地區
第6章 競爭格局
- 關鍵策略趨勢
- 市場佔有率分析
- 商業狀況
- 公司簡介
- Coromandel International Ltd.
- Deepak fertilizers & Petrochemicals Corporation Ltd
- Grupa Azoty SA(Compo Expert)
- Haifa Group
- ICL Group Ltd
- K+S Aktiengesellschaft
- Koch Industries Inc.
- The Mosaic Company
- Yara International ASA
第7章:CEO面臨的關鍵策略問題
第 8 章 附錄
- 世界概況
- 概述
- 五力分析框架
- 全球價值鏈分析
- 市場動態(DRO)
- 資訊來源及延伸閱讀
- 圖片列表
- 關鍵見解
- 資料包
- 詞彙表
The Secondary Macronutrients Fertilizer Market size is estimated at 37.81 billion USD in 2025, and is expected to reach 49.28 billion USD by 2030, growing at a CAGR of 5.44% during the forecast period (2025-2030).
The adoption of sulfur fertilizer is more than other secondary macronutrients
- In 2021, sulfur accounted for 42.6% of the global secondary macronutrient fertilizer market. In 2021, the value of the European sulfur market was about USD 1.19 billion. In this market, specialty sulfur fertilizer accounted for a market share of approximately 49.4%, and conventional sulfur fertilizer accounted for about 50.1%. The adoption of specialty sulfur fertilizer is higher than that of other secondary macronutrients. The specialty sulfur fertilizer market is anticipated to reach USD 1.82 billion by the end of the forecast period.
- Magnesium accounted for 48.9% of the global secondary macronutrient fertilizer market in 2021. Field crops accounted for a maximum share of 88.8%, followed by turf and ornamental crops and horticulture crops, holding shares of 3.9% and 7.3%, respectively. The largest fertilizer-consuming crops are wheat and corn, accounting for a total of 40.0% of the land area.
- Calcium recorded 8.4% of the total value of the global secondary macronutrient fertilizer market, accounting for about USD 538.7 million in 2021. The Asia-Pacific region dominated the calcium fertilizer market and accounted for about 41.1% of the global calcium fertilizer market's value, registering USD 221.6 million in 2021. The dominance of the Asia-Pacific region in the calcium fertilizer market is mainly due to the acidification of soils, which means the loss of base cations, such as calcium and magnesium, and replacement with acidic elements, like iron and aluminum complexes.
- The demand for secondary macronutrient fertilizer is anticipated to grow during the forecast period, as the need for higher productivity is increasing due to the decline in the area under the cultivation of crops.
Climate changes and fluctuation in pH levels in soils may drive the market
- Applying secondary macronutrient fertilizers impacts crop yields positively. The demand for calcium, magnesium, and sulfur has risen in tandem with modern high-yield crop systems, underscoring their pivotal role in plant productivity.
- Asia-Pacific dominates the global secondary macronutrient fertilizer market, capturing 39.2% of its value in 2022. Within the region, sulfur claims the majority share at 63.5%, trailed by magnesium at 30.0%. Rice is the major grown cereal crop in Asia-Pacific, with the region accounting for 90% of global production and consumption. Given the region's sulfur-deficient soils, sulfur, a crucial trace element, is supplemented through fertilization to enhance plant growth and yield.
- Europe secured the second-largest share of the global secondary macronutrient fertilizer market in 2022, with a share of 26.9%. Sulfur, commanding a hefty 67.4% of the market's value, emerged as the leading secondary macronutrient fertilizer in 2022. Russia, with a 19.2% market share, emerged as the dominant player in Europe's market landscape.
- In 2022, the South American secondary macronutrient fertilizer market held an 11.5% share of the global market. Recent droughts and heat waves disrupted nutrient availability in the region's soils, driving up the adoption of secondary macronutrient fertilizers to counteract these deficiencies.
- Secondary macronutrients play a pivotal role in maintaining balanced plant nutrition, with each nutrient influencing specific metabolic processes. This dynamic is poised to fuel the growth of the market in the coming years as the importance of optimized plant nutrition becomes increasingly recognized.
Global Secondary Macronutrients Fertilizer Market Trends
The rising pressure on the agriculture sector to meet the growing demand for food is expected to increase the area under field crop cultivation
- The global agricultural sector is currently facing many challenges. According to the United Nations, the world population may exceed 9 billion by 2050. This population growth may overburden the agricultural sector, which is already experiencing an output loss due to a lack of laborers and the shrinkage of agricultural fields caused by rising urbanization. According to the Food and Agriculture Organization, 70% of the global population is expected to live in cities by 2050. Due to the global loss of arable land, farmers now need to utilize more fertilizers to increase crop yields.
- Asia-Pacific is the world's largest producer of agricultural products. Agriculture is critical to the region's economy, as it employs about 20% of the total available workforce. Field crop cultivation dominates the region, accounting for more than 95% of the total crop area. Rice, wheat, and corn are the major field crops produced in the region, together accounting for about 24.3% of the total crop area in 2022.
- North America ranks as the second-largest arable region across the world. Its farms cultivate a diverse range of crops, with a focus on field crops. Notably, corn, cotton, rice, soybean, and wheat are the prominent field crops, as highlighted by the USDA. In 2022, the United States commanded 46.2% of North America's crop cultivation area. However, the country witnessed a significant drop in crop acreage between 2017 and 2019, primarily due to adverse environmental conditions, leading to severe flooding in regions like Texas and Houston.
A steady supply of sulfur is required from early growth stages until harvest as it is immobile in plants, and any shortage in supply can limit the yield
- The global average application rate of secondary macronutrients in field crops was 33.73 kg/ha in 2022. In the same year, the calcium application rate was about 39.20 kg/hectare, magnesium was about 34.51 kg/hectare, and sulfur application rate was 27.47 kg/hectare. Calcium aids in the absorption of other essential nutrients. Magnesium is an excellent enzyme activator that promotes plant growth and flowering. Plants require only a small amount of secondary macronutrients that cannot be replaced by any primary nutrients.
- In 2022, corn/maize recorded the highest average sulfur application rate of 34.33 kg/ha, followed by cotton at 29.72 kg/ha and rapeseed/canola at 27.57 kg/ha. A steady supply of sulfur is required from early growth stages until harvest as it is immobile in plants. At any stage of growth, a shortage of sulfur can lead to lower yields. As N, P, and K requirements have mostly been met, deficits of other nutrients have started to appear. Sulfur is the fourth most crucial nutrient after N, P, and K but is usually only needed in low quantities.
- South America, the Middle East & Africa, and Asia-Pacific were the major consumers of secondary macronutrients, with the highest average nutrient application rates, accounting for 39.27 kg/ha, 32.79 kg/ha, and 32.74 kg/ha, respectively, in 2022. Growers acknowledged the importance of secondary macronutrients because they are crucial nutrients for plants, support stronger cell walls, lower bruising, and prevent disease in field crops. Although secondary macronutrients are less yield-limiting than primary macronutrients, crops need them at a rate that will optimize productivity.
Secondary Macronutrients Fertilizer Industry Overview
The Secondary Macronutrients Fertilizer Market is fragmented, with the top five companies occupying 10.61%. The major players in this market are ICL Group Ltd, K+S Aktiengesellschaft, Koch Industries Inc., The Mosaic Company and Yara International ASA (sorted alphabetically).
Additional Benefits:
- The market estimate (ME) sheet in Excel format
- 3 months of analyst support
TABLE OF CONTENTS
1 EXECUTIVE SUMMARY & KEY FINDINGS
2 REPORT OFFERS
3 INTRODUCTION
- 3.1 Study Assumptions & Market Definition
- 3.2 Scope of the Study
- 3.3 Research Methodology
4 KEY INDUSTRY TRENDS
- 4.1 Acreage Of Major Crop Types
- 4.1.1 Field Crops
- 4.1.2 Horticultural Crops
- 4.2 Average Nutrient Application Rates
- 4.2.1 Secondary Macronutrients
- 4.2.1.1 Field Crops
- 4.2.1.2 Horticultural Crops
- 4.2.1 Secondary Macronutrients
- 4.3 Agricultural Land Equipped For Irrigation
- 4.4 Regulatory Framework
- 4.5 Value Chain & Distribution Channel Analysis
5 MARKET SEGMENTATION (includes market size in Value in USD and Volume, Forecasts up to 2030 and analysis of growth prospects)
- 5.1 Type
- 5.1.1 Straight
- 5.1.1.1 Secondary Macronutrients
- 5.1.1.1.1 Calcium
- 5.1.1.1.2 Magnesium
- 5.1.1.1.3 Sulfur
- 5.1.1 Straight
- 5.2 Application Mode
- 5.2.1 Fertigation
- 5.2.2 Foliar
- 5.2.3 Soil
- 5.3 Crop Type
- 5.3.1 Field Crops
- 5.3.2 Horticultural Crops
- 5.3.3 Turf & Ornamental
- 5.4 Region
- 5.4.1 Asia-Pacific
- 5.4.1.1 Australia
- 5.4.1.2 Bangladesh
- 5.4.1.3 China
- 5.4.1.4 India
- 5.4.1.5 Indonesia
- 5.4.1.6 Japan
- 5.4.1.7 Pakistan
- 5.4.1.8 Philippines
- 5.4.1.9 Thailand
- 5.4.1.10 Vietnam
- 5.4.1.11 Rest of Asia-Pacific
- 5.4.2 Europe
- 5.4.2.1 France
- 5.4.2.2 Germany
- 5.4.2.3 Italy
- 5.4.2.4 Netherlands
- 5.4.2.5 Russia
- 5.4.2.6 Spain
- 5.4.2.7 Ukraine
- 5.4.2.8 United Kingdom
- 5.4.2.9 Rest of Europe
- 5.4.3 Middle East & Africa
- 5.4.3.1 Nigeria
- 5.4.3.2 Saudi Arabia
- 5.4.3.3 South Africa
- 5.4.3.4 Turkey
- 5.4.3.5 Rest of Middle East & Africa
- 5.4.4 North America
- 5.4.4.1 Canada
- 5.4.4.2 Mexico
- 5.4.4.3 United States
- 5.4.4.4 Rest of North America
- 5.4.5 South America
- 5.4.5.1 Argentina
- 5.4.5.2 Brazil
- 5.4.5.3 Rest of South America
- 5.4.1 Asia-Pacific
6 COMPETITIVE LANDSCAPE
- 6.1 Key Strategic Moves
- 6.2 Market Share Analysis
- 6.3 Company Landscape
- 6.4 Company Profiles
- 6.4.1 Coromandel International Ltd.
- 6.4.2 Deepak fertilizers & Petrochemicals Corporation Ltd
- 6.4.3 Grupa Azoty S.A. (Compo Expert)
- 6.4.4 Haifa Group
- 6.4.5 ICL Group Ltd
- 6.4.6 K+S Aktiengesellschaft
- 6.4.7 Koch Industries Inc.
- 6.4.8 The Mosaic Company
- 6.4.9 Yara International ASA
7 KEY STRATEGIC QUESTIONS FOR FERTILIZER CEOS
8 APPENDIX
- 8.1 Global Overview
- 8.1.1 Overview
- 8.1.2 Porter's Five Forces Framework
- 8.1.3 Global Value Chain Analysis
- 8.1.4 Market Dynamics (DROs)
- 8.2 Sources & References
- 8.3 List of Tables & Figures
- 8.4 Primary Insights
- 8.5 Data Pack
- 8.6 Glossary of Terms
 硼肥市場-全球產業規模、佔有率、趨勢、機會和預測,依來源、應用、區域和競爭格局分類,2020-2030年預測全球糞肥市場-產業規模、佔有率、趨勢、機會及預測,依類型、形態、應用、區域及競爭格局分類,2020-2030年預測昆蟲肥料市場-全球產業規模、佔有率、趨勢、機會和預測,按類型、形態、應用、地區和競爭格局分類,2020-2030年預測海藻肥料市場-全球產業規模、佔有率、趨勢、機會和預測,按形態(液體和粉末)、應用(農場、花園及其他)、地區和競爭格局分類,2020-2030年預測聚合物包膜肥料市場-全球產業規模、佔有率、趨勢、機會和預測,按類型、作物類型、地區和競爭格局分類,2020-2030年預測
 按營養類型、形態、施用方法、作物類型、品種和地區分類的啟動肥市場規模、佔有率和成長分析 - 2025-2032 年行業預測
 矽肥市場:預測(2025-2030 年)鐵螯合物市場-2025-2030年預測
 膠囊肥料市場依營養成分、釋放機制、作物用途及地區分類
 化肥市場按產品類型、作物類型、包裝、施用方法、最終用戶和分銷管道分類-2025-2032年全球預測