


 |
市場調查報告書
商品編碼
1693519
鉀肥:市場佔有率分析、產業趨勢與統計、成長預測(2025-2030 年)Potash Fertilizer - Market Share Analysis, Industry Trends & Statistics, Growth Forecasts (2025 - 2030) |
||||||
價格
※ 本網頁內容可能與最新版本有所差異。詳細情況請與我們聯繫。
簡介目錄
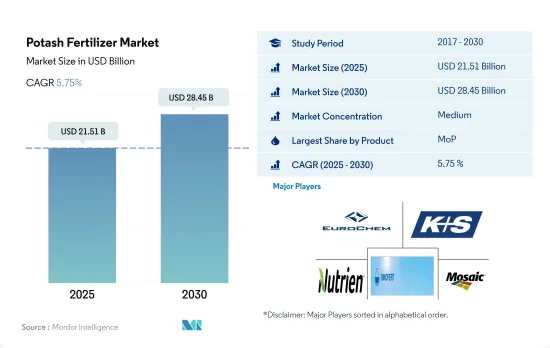
鉀肥市場規模預計在 2025 年為 215.1 億美元,預計到 2030 年將達到 284.5 億美元,預測期內(2025-2030 年)的複合年成長率為 5.75%。
儘管 SoP 肥料品質優良,但由於價格較高,市場佔有率一直難以超越 MoP 肥料。
- 氯化鉀(MoP)是鉀含量為60.0%的最高鉀肥,2022年全球價值為224.4億美元。同時,其消費量達到3,730萬噸,佔全球鉀肥消費量的86.5%。
- 硫酸鉀(SoP)含鉀量為50.0%,是全球第二大最受歡迎的鉀肥。預計 2022 年全球 SoP 肥料市場規模為 24.1 億美元,消費量為 280 萬噸。
- 2022年,南美洲將成為第二大鉀肥市場,市場佔有率為28.6%,領先亞太地區的30.0%。主要是因為巴西等南美國家是鉀肥生產大國,農作物對鉀肥的需求強勁。
- 其他值得注意的鉀肥如鉀鎂礬和光鹵石總合佔全球鉀肥消費量的4.1%。 2022 年,該產業價值 10.6 億美元,消費量為 170 萬噸。
- 鉀肥的價格一直高於磷肥和其他鉀肥。例如,自2017年以來,SoP的價格幾乎是MoP的兩倍,而2021年則上漲了一倍以上。儘管 SoP 品質優良,但由於其價格高於 MoP,因此其市場佔有率有限。
- 受提高作物生產率的需求不斷成長等因素的推動,鉀肥市場預計將在 2023 年至 2030 年間成長。
亞太地區主導全球鉀肥市場
- 亞太地區在全球鉀肥市場佔據主導地位,佔2022年市場價值的40.0%。分析顯示,預計2022年亞太地區鉀肥市場規模將達103.7億美元。依肥料類型分類,常規鉀肥約佔總量的71.1%,其次是特種鉀肥,2022年特種鉀肥將佔28.8%。
- 受農作物需求旺盛的推動,亞太地區對鉀肥的依賴程度較高,是最大的消費地區。 2017-2018年,該地區進口了700萬噸鉀肥。
- 2022年,南美洲的全球市場佔有率達到18.5%。尤其值得注意的是鉀肥產業的快速成長,這主要得益於巴西大豆種植面積的擴大。鉀肥有助於提高大豆產量,因為它非常適合巴西低肥力、酸性的熱帶土壤。 2017年,巴西是南美洲唯一一個鉀肥使用量增加的國家,達630萬噸。
- 歐洲在鉀肥市場中排名第三,2022 年的市場佔有率為 9.4%。值得注意的是,波蘭、比利時和東南歐國家是主要消費國,總合佔歐洲肥料市值的 70.5%。預計該產業在 2023 年至 2030 年期間的複合年成長率將達到 5.0%。
- 在新興市場,土壤缺鉀是一個常見的問題。農民擴大使用鉀肥,不僅是為了糾正鉀缺乏症,也是為了提高整體生產力。這一趨勢是市場成長的主要驅動力。
全球鉀肥市場趨勢
為了滿足日益成長的糧食需求,農業面臨的壓力越來越大,預計將導致田間作物種植面積的增加。
- 當前全球農業領域面臨許多挑戰。根據聯合國預測,到 2050 年,世界人口可能會超過 90 億。人口成長可能會對農業造成過度壓力,而由於勞動力短缺和都市化進程加劇導致農地面積減少,農業產量已經下降。根據聯合國糧食及農業組織預測,2050年,全球70%的人口預計將居住在城市。隨著全球可耕地面積減少,農民需要使用更多的肥料來提高作物產量。
- 亞太地區是世界上最大的農產品生產地區。農業對該地區的經濟至關重要,約佔總勞動力的 20%。該地區以田間作物種植為主,約佔全部區域作物總面積的95%以上。水稻、小麥和玉米是該地區的主要田間作物,2022年約佔總耕地面積的24.3%。
- 北美洲是世界上第二大可耕地。該農場種植多種作物,主要為田間作物。尤其是玉米、棉花、稻米、大豆和小麥,都是美國農業部強調的主要田間作物。 2022年,美國佔北美作物種植面積的46.2%。然而,2017年至2019年期間,該國作物種植面積大幅下降,主要原因是惡劣天氣導致德克薩斯和休士頓等地區發生嚴重洪災。
鉀激活植物生長發育所必需的酶
- 玉米、油菜籽、棉花、高粱、水稻、小麥和大豆是世界著名作物,以營養需求高而聞名。 2022 年這些作物的平均鉀施用量為:玉米(196.8 公斤/公頃)、油菜(248.6 公斤/公頃)、棉花(164.3 公斤/公頃)、高粱(185.3 公斤/公頃)、水稻(67.9 公斤/公頃)、小麥(96.417 公斤/公頃)。作為作物營養均衡方法的一部分,鉀不僅在實現最大經濟產量方面發揮重要作用,而且還影響作物品質。
- 2022年田間作物鉀肥平均施用量為150.3公斤/公頃。油菜籽施鉀量最高,248.6公斤/公頃。在嚴重缺鉀的情況下,油菜籽葉片會出現邊緣或葉脈間失綠,隨後壞死。它們也更容易受到乾旱的影響,擁有更多的多年生根,減少光合作用,並限制水分和養分的流動。
- 根據倫敦大學學院的研究,全球整體約有20%的農業土壤面臨嚴重缺鉀問題,某些地區更容易出現嚴重缺鉀現象,其中東南亞為44%,撒哈拉以南非洲為30%,東亞為20%。
- 全球田間作物種植面積正在擴大,南美洲和亞太地區的成長尤其顯著。這些地區正成為化肥的主要市場。在歐洲和北美等發展中地區以及營養缺乏的地區,特種肥料因其有效性而得到越來越多的採用。預計這些趨勢將在 2023 年至 2030 年期間推動鉀肥市場的發展。
鉀肥業概況
鉀肥市場適度整合,前五大企業佔46.81%。市場的主要企業有:EuroChem Group、K+S Aktiengesellschaft、Nutrien Ltd.、Sinofert Holdings Limited 和 The Mosaic Company(按字母順序排列)
其他福利
- Excel 格式的市場預測 (ME) 表
- 3個月的分析師支持
目錄
第1章執行摘要和主要發現
第2章 報告要約
第3章 引言
- 研究假設和市場定義
- 研究範圍
- 調查方法
第4章 產業主要趨勢
- 主要作物種植面積
- 田間作物
- 園藝作物
- 平均養分施用量
- 主要營養素
- 田間作物
- 園藝作物
- 主要營養素
- 灌溉農田
- 法律規範
- 價值鍊和通路分析
第5章市場區隔
- 類型
- 直的
- 鉀
- MoP
- SoP
- 其他
- 直的
- 應用
- 受精
- 葉面噴布
- 土壤
- 作物類型
- 田間作物
- 園藝作物
- 草坪和觀賞植物
- 地區
- 亞太地區
- 澳洲
- 孟加拉
- 中國
- 印度
- 印尼
- 日本
- 巴基斯坦
- 菲律賓
- 泰國
- 越南
- 其他亞太地區
- 歐洲
- 法國
- 德國
- 義大利
- 荷蘭
- 俄羅斯
- 西班牙
- 烏克蘭
- 英國
- 其他歐洲國家
- 中東和非洲
- 奈及利亞
- 沙烏地阿拉伯
- 南非
- 土耳其
- 其他中東和非洲地區
- 北美洲
- 加拿大
- 墨西哥
- 美國
- 北美其他地區
- 南美洲
- 阿根廷
- 巴西
- 南美洲其他地區
- 亞太地區
第6章競爭格局
- 關鍵策略趨勢
- 市場佔有率分析
- 商業狀況
- 公司簡介
- Coromandel International Ltd.
- EuroChem Group
- Intrepid Potash Inc.
- K+S Aktiengesellschaft
- Nutrien Ltd.
- Sinofert Holdings Limited
- Sociedad Quimica y Minera de Chile SA
- The Mosaic Company
第7章:CEO面臨的關鍵策略問題
第 8 章 附錄
- 世界概況
- 概述
- 五力分析框架
- 全球價值鏈分析
- 市場動態(DRO)
- 資訊來源及延伸閱讀
- 圖片列表
- 關鍵見解
- 資料包
- 詞彙表
簡介目錄
Product Code: 92583
The Potash Fertilizer Market size is estimated at 21.51 billion USD in 2025, and is expected to reach 28.45 billion USD by 2030, growing at a CAGR of 5.75% during the forecast period (2025-2030).
Despite its superior quality, SoP fertilizer has struggled to gain market share over MoP, primarily due to its higher price
- Muriate of potash (MoP), a potassic fertilizer boasting the highest potash content at 60.0%, commanded a global market valuation of USD 22.44 billion in 2022. Concurrently, its consumption reached 37.3 million metric tons, representing a dominant 86.5% of the global potassium fertilizer consumption.
- Sulphate of potash (SoP), with a potassium content of 50.0%, emerged as the second most favored potassium fertilizer worldwide. The global SoP fertilizer market, in 2022, was valued at USD 2.41 billion, with a consumption volume of 2.8 million metric tons.
- South America, with a 28.6% market share in 2022, stands as the second-largest potassic fertilizer market, trailing the Asia-Pacific's 30.0% share. This is primarily due to South American countries, notably Brazil, boasting significant potassic fertilizer production, coupled with a robust demand from their crops.
- Other notable potassic fertilizers, such as langbeinite and carnallite, collectively account for 4.1% of the global potassic fertilizer consumption. In 2022, this segment was valued at USD 1.06 billion, with a consumption volume of 1.7 million metric tons.
- The price of SoP consistently surpasses that of MoP and other potassic fertilizers. For instance, since 2017, the price of SoP has nearly doubled that of MoP, and by 2021, it had more than doubled. Despite its superior quality, the higher price of SoP has limited its market share compared to MoP.
- The potassic fertilizer market is poised for growth during 2023-2030, driven by factors like the escalating demand for enhanced crop productivity.
Asia-Pacific dominates the global potash fertilizers market
- Asia-Pacific dominates the global potash fertilizers market, accounting for 40.0% of the market value in 2022. According to the analysis, the Asia-Pacific potash fertilizer market was valued at USD 10.37 billion in 2022. By fertilizer type, conventional potash fertilizers dominate the fertilizer market, accounting for about 71.1%, followed by specialty potash fertilizers contributing to 28.8% in 2022.
- The Asia-Pacific, driven by its robust crop demand, notably relies on potash fertilizers, making it the largest consumer. Between 2017 and 2018, the region imported a substantial 7.0 million metric tons of potash fertilizers.
- South America secured the global market share of 18.5% slice in 2022. Notably, the potassic fertilizer segment is witnessing rapid growth, primarily fueled by the expanding soybean cultivation in Brazil. Given its suitability for Brazil's low-fertility and acidic tropical soils, potassic fertilizers are aiding in boosting soybean yields. In 2017, Brazil alone accounted for the highest potash fertilizer usage in South America, reaching 6.3 million metric tons.
- Europe, with an 9.4% market share in 2022, stood as the third-largest potash fertilizer market. Notably, countries like Poland, Belgium, and those in Southeastern Europe are the major consumers, collectively representing 70.5% of Europe's fertilizer market value. This segment is projected to register a CAGR of 5.0% from 2023 to 2030.
- Across developing markets, potassium deficiency is a common issue in soils. Farmers are increasingly turning to potash fertilizers, not only to rectify potassium deficiencies but also to enhance their overall productivity. This trend is a significant driver for the market's growth.
Global Potash Fertilizer Market Trends
The rising pressure on the agriculture industry to meet the growing demand for food is expected to increase the area under field crop cultivation
- The global agricultural sector is currently facing many challenges. According to the UN, the world population will likely exceed nine billion by 2050. This population growth may overburden the agricultural industry, which is already experiencing an output loss due to a lack of laborers and the shrinkage of agricultural fields caused by rising urbanization. According to the Food and Agriculture Organization, 70% of the global population is expected to live in cities by 2050. Due to the global loss of arable land, farmers now need to utilize more fertilizers to increase crop yields.
- Asia-Pacific is the world's largest producer of agricultural products. Agriculture is critical to the region's economy, as it employs about 20% of the total available workforce. Field crop cultivation dominates the region, accounting for about more than 95% of the total crop area in the region. Rice, wheat, and corn are the major field crops produced in the region, together accounting for about 24.3% of the total crop area in 2022.
- North America ranks as the second-largest arable region globally. Its farms cultivate a diverse range of crops, with a focus on field crops. Notably, corn, cotton, rice, soybean, and wheat are the prominent field crops, as highlighted by the USDA. In 2022, the United States commanded 46.2% of North America's crop cultivation area. However, the country witnessed a significant drop in crop acreage between 2017 and 2019, primarily due to adverse environmental conditions, leading to severe flooding in regions like Texas and Houston.
Potassium activates the enzymes needed for plant growth and development
- Corn, rapeseed, cotton, sorghum, rice, wheat, and soybean are prominent crops globally, known for their high nutrient requirements. The average potassium application rates for these crops in 2022 were as follows: corn (196.8 kg/ha), rapeseed (248.6 kg/ha), cotton (164.3 kg/ha), sorghum (185.3 kg/ha), rice (67.9 kg/ha), wheat (96.4 kg/ha), and soybean (181.7 kg/ha). Potassium plays a major role in achieving the maximum economic yield, as part of a balanced approach to crop nutrition, as well as influencing crop quality.
- The average application rate for potassium in field crops stood at 150.3 kg/ha in 2022. The rapeseed had the highest potassium application rate recorded at 248.6 kg/ha. In the case of acute potassium deficiency, the leaves of rapeseed show marginal or interveinal chlorosis followed by patches of necrosis. It will also lead to greater drought susceptibility, increased lodging, reduced photosynthesis, and restricted movement of water and nutrients around the plant.
- According to University College London, The researchers reported that globally, about 20% of agricultural soils face severe potassium deficiency, with particular regions likely to experience more critical shortages, including 44% of agricultural soils in Southeast Asia, 30% in Sub-Saharan Africa, and 20% in East Asia which will further drive the potash fertilizers usage.
- The cultivation area for field crops is expanding globally, with notable growth in South America and Asia-Pacific. These regions are emerging as key markets for fertilizers. Developed regions like Europe and North America and areas grappling with nutrient deficiencies are increasingly adopting specialty fertilizers for their efficacy. These trends are expected to fuel the potash fertilizers market during 2023-2030.
Potash Fertilizer Industry Overview
The Potash Fertilizer Market is moderately consolidated, with the top five companies occupying 46.81%. The major players in this market are EuroChem Group, K+S Aktiengesellschaft, Nutrien Ltd., Sinofert Holdings Limited and The Mosaic Company (sorted alphabetically).
Additional Benefits:
- The market estimate (ME) sheet in Excel format
- 3 months of analyst support
TABLE OF CONTENTS
1 EXECUTIVE SUMMARY & KEY FINDINGS
2 REPORT OFFERS
3 INTRODUCTION
- 3.1 Study Assumptions & Market Definition
- 3.2 Scope of the Study
- 3.3 Research Methodology
4 KEY INDUSTRY TRENDS
- 4.1 Acreage Of Major Crop Types
- 4.1.1 Field Crops
- 4.1.2 Horticultural Crops
- 4.2 Average Nutrient Application Rates
- 4.2.1 Primary Nutrients
- 4.2.1.1 Field Crops
- 4.2.1.2 Horticultural Crops
- 4.2.1 Primary Nutrients
- 4.3 Agricultural Land Equipped For Irrigation
- 4.4 Regulatory Framework
- 4.5 Value Chain & Distribution Channel Analysis
5 MARKET SEGMENTATION (includes market size in Value in USD and Volume, Forecasts up to 2030 and analysis of growth prospects)
- 5.1 Type
- 5.1.1 Straight
- 5.1.1.1 Potassic
- 5.1.1.1.1 MoP
- 5.1.1.1.2 SoP
- 5.1.1.1.3 Others
- 5.1.1 Straight
- 5.2 Application Mode
- 5.2.1 Fertigation
- 5.2.2 Foliar
- 5.2.3 Soil
- 5.3 Crop Type
- 5.3.1 Field Crops
- 5.3.2 Horticultural Crops
- 5.3.3 Turf & Ornamental
- 5.4 Region
- 5.4.1 Asia-Pacific
- 5.4.1.1 Australia
- 5.4.1.2 Bangladesh
- 5.4.1.3 China
- 5.4.1.4 India
- 5.4.1.5 Indonesia
- 5.4.1.6 Japan
- 5.4.1.7 Pakistan
- 5.4.1.8 Philippines
- 5.4.1.9 Thailand
- 5.4.1.10 Vietnam
- 5.4.1.11 Rest of Asia-Pacific
- 5.4.2 Europe
- 5.4.2.1 France
- 5.4.2.2 Germany
- 5.4.2.3 Italy
- 5.4.2.4 Netherlands
- 5.4.2.5 Russia
- 5.4.2.6 Spain
- 5.4.2.7 Ukraine
- 5.4.2.8 United Kingdom
- 5.4.2.9 Rest of Europe
- 5.4.3 Middle East & Africa
- 5.4.3.1 Nigeria
- 5.4.3.2 Saudi Arabia
- 5.4.3.3 South Africa
- 5.4.3.4 Turkey
- 5.4.3.5 Rest of Middle East & Africa
- 5.4.4 North America
- 5.4.4.1 Canada
- 5.4.4.2 Mexico
- 5.4.4.3 United States
- 5.4.4.4 Rest of North America
- 5.4.5 South America
- 5.4.5.1 Argentina
- 5.4.5.2 Brazil
- 5.4.5.3 Rest of South America
- 5.4.1 Asia-Pacific
6 COMPETITIVE LANDSCAPE
- 6.1 Key Strategic Moves
- 6.2 Market Share Analysis
- 6.3 Company Landscape
- 6.4 Company Profiles
- 6.4.1 Coromandel International Ltd.
- 6.4.2 EuroChem Group
- 6.4.3 Intrepid Potash Inc.
- 6.4.4 K+S Aktiengesellschaft
- 6.4.5 Nutrien Ltd.
- 6.4.6 Sinofert Holdings Limited
- 6.4.7 Sociedad Quimica y Minera de Chile SA
- 6.4.8 The Mosaic Company
7 KEY STRATEGIC QUESTIONS FOR FERTILIZER CEOS
8 APPENDIX
- 8.1 Global Overview
- 8.1.1 Overview
- 8.1.2 Porter's Five Forces Framework
- 8.1.3 Global Value Chain Analysis
- 8.1.4 Market Dynamics (DROs)
- 8.2 Sources & References
- 8.3 List of Tables & Figures
- 8.4 Primary Insights
- 8.5 Data Pack
- 8.6 Glossary of Terms


