


 |
市場調查報告書
商品編碼
1693518
氮肥:市場佔有率分析、產業趨勢與統計、成長預測(2025-2030)Nitrogenous Fertilizer - Market Share Analysis, Industry Trends & Statistics, Growth Forecasts (2025 - 2030) |
||||||
價格
※ 本網頁內容可能與最新版本有所差異。詳細情況請與我們聯繫。
簡介目錄
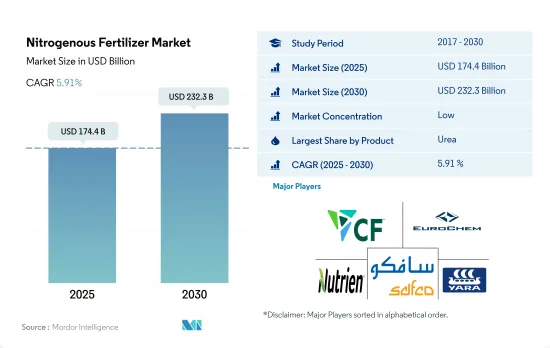
預計 2025 年氮肥市場規模為 1,744 億美元,到 2030 年將達到 2,323 億美元,預測期內(2025-2030 年)的複合年成長率為 5.91%。
預計增加產量的需求將推動市場成長。
- 尿素是世界上最重要、使用最廣泛的氮肥。 2022年,尿素佔全球氮肥消費量的48.6%。預計2022年全球尿素市場規模為750億美元,同年消費量為1.402億噸。
- 無水氨是所有氮肥中氮含量最高的(82%),氮以 NH3 的形式容易被利用。 2022年全球無水氨市場價值為2,450萬美元,同年消費量為43億噸。然而,無水氨作為肥料的使用僅限於北美國家,在那裡它通常用於該地區的玉米帶,因為它是一種高氮消費量作物。
- 預計到 2022 年,硝酸銨市場將佔氮肥市場總量的 6.3%(按以金額為準計算),佔氮肥市場總量的 8.5%(按數量計算),預計在 2023-2030 年預測期內,硝酸銨市場以金額為準的複合年成長率為 4.9%。硝酸銨受到種植者的歡迎,因為它比許多其他氮肥便宜,並且適合在所有季節使用。
- 此外,2022 年的氮肥市場在亞太地區最大。市場價值佔有率為34.6%。在亞太地區,中國和印度由於人口不斷成長且耕地面積廣闊,是兩個最大的消費國。
- 由於氮肥是最需要的營養物質,預計預測期內全球氮肥市場價值將以 5.6% 的複合年成長率成長。
主要作物缺氮和氮利用效率下降可能推動氮肥市場
- 2022年,全球氮肥市場規模預估為1,847億美元,消費量將達2.888億噸。氮肥使用量的激增主要是因為作物利用土壤中氮的效率下降。
- 亞太地區將主導氮肥市場,2022年將佔據39.0%的佔有率。特別是農業大國中國和印度受益於充足的耕地、人口成長帶來的糧食需求成長以及政府的大力支持。這些因素可能會進一步推動該地區的氮肥消費。
- 北美市佔率為23.2%。在北美,美國憑藉其廣闊的耕地面積佔據了大部分市場,田間作物佔耕地面積的69%,因此需要更高的氮投入。
- 歐洲是僅次於北美的第三大市場,2022 年的銷售佔有率為 16.7%。該地區正面臨乾旱和熱浪等挑戰,這些挑戰阻礙了土壤中氮的利用,導致作物減產。因此,歐洲農民越來越依賴氮肥,帶來了潛在的市場擴張。
- 氮肥在農業生產中至關重要。儘管種植面積不斷縮小,但由於耕作方式的改善和為提高農業產量和生產率而增加的施肥量,全球氮肥市場預計仍將成長。
全球氮肥市場趨勢
農業部門生產更多糧食的壓力越來越大,預計將導致田間作物種植面積增加。
- 當前全球農業領域面臨許多挑戰。根據聯合國預測,到2050年,世界人口可能會超過90億。人口成長可能會給農業部門帶來過度壓力,而由於勞動力短缺和都市化進程加快導致的耕地減少,農業部門的產量已經下降。根據聯合國糧食及農業組織預測,2050年,全球70%的人口預計將居住在城市。隨著全球可耕地面積的減少,農民需要更多的肥料來提高作物產量。
- 亞太地區是世界上最大的農產品生產地區。農業對該地區的經濟至關重要,約佔總勞動力的 20%。該地區以大田作物為主,佔該地區作物總面積的95%以上。水稻、小麥和玉米是該地區的主要田間作物,佔2022年總耕地面積的42.5%左右。
- 就農業用地總面積而言,北美洲是世界上第二大可耕地地區。北美的農場種植多種作物,以田間作物為主。根據美國農業部的數據,玉米、棉花、稻米、大豆和小麥是該地區的主要田間作物。美國佔據市場主導地位,研究期間美國作物面積達1.5509億公頃,其中田間作物佔據市場的大部分,到2022年將佔65.7%的佔有率。 2017年至2019年間,美國作物種植面積大幅下降,主要原因是不利的環境條件導致德克薩斯州和休士頓等地區發生嚴重洪災。
氮肥是田間作物使用最廣泛的主要肥料,佔總消費量的45.57%。
- 2023年田間作物平均基肥施用量為每公頃164.3公斤。特別是玉米、水稻、小麥、高粱、大豆、油菜籽和棉花等主要田間作物,需要較高的營養水平來支持其生長。集約化耕作方式和持續種植小麥等主要作物導致營養缺乏,因此需要增加營養施用。在這些條件下,需要更多的營養投入來維持土壤肥力。
- 在所有主要營養物質中,氮是田間作物消耗的主要營養物質。氮肥平均施用量達每公頃224.6公斤。由於pH值高、土壤成分沙質以及反覆乾旱和熱浪造成的持續乾燥條件,土壤缺氮。這些因素共同增加了農業實踐中對氮營養的需求。
- 油菜籽成為氮營養的重要消耗作物,平均施肥量為347.4公斤/公頃。油菜種植對氮的需求量大,這主要與這些作物的氮利用效率(NUE)降低有關。中國、加拿大、印度、澳洲和歐洲國家是油菜籽的主要生產國。近期乾旱、洪澇等氣候條件的變化導致土壤氮流失,影響油菜籽的生長和產量形成。必須將氮的施用量保持在一定範圍內。充足的氮含量可提高光合作用能力、代謝量、形態發生,並提高產量。
氮肥業概況
氮肥市場分散,前五大企業佔19.67%的市佔率。該市場的主要企業有:CF Industries Holdings, Inc.、EuroChem Group、Nutrien Ltd.、SABIC Agri-Nutrients Co. 和 Yara International ASA(按字母順序排列)
其他福利
- Excel 格式的市場預測 (ME) 表
- 3個月的分析師支持
目錄
第1章執行摘要和主要發現
第2章 報告要約
第3章 引言
- 研究假設和市場定義
- 研究範圍
- 調查方法
第4章 產業主要趨勢
- 主要作物種植面積
- 田間作物
- 園藝作物
- 平均養分施用量
- 主要營養素
- 田間作物
- 園藝作物
- 主要營養素
- 灌溉農田
- 法律規範
- 價值鍊和通路分析
第5章市場區隔
- 產品
- 硝酸銨
- 無水氨
- 尿素
- 其他
- 形式
- 傳統的
- 特別的
- CRF
- 液體肥料
- SRF
- 水溶性
- 施肥方式
- 受精
- 葉面噴布
- 土壤
- 作物類型
- 田間作物
- 園藝作物
- 草坪和觀賞植物
- 地區
- 亞太地區
- 澳洲
- 孟加拉
- 中國
- 印度
- 印尼
- 日本
- 巴基斯坦
- 菲律賓
- 泰國
- 越南
- 其他亞太地區
- 歐洲
- 法國
- 德國
- 義大利
- 荷蘭
- 俄羅斯
- 西班牙
- 烏克蘭
- 英國
- 其他歐洲國家
- 中東和非洲
- 奈及利亞
- 沙烏地阿拉伯
- 南非
- 土耳其
- 其他中東和非洲地區
- 北美洲
- 加拿大
- 墨西哥
- 美國
- 北美其他地區
- 南美洲
- 阿根廷
- 巴西
- 南美洲其他地區
- 亞太地區
第6章競爭格局
- 關鍵策略趨勢
- 市場佔有率分析
- 商業狀況
- 公司簡介
- CF Industries Holdings, Inc.
- Coromandel International Ltd.
- EuroChem Group
- Grupa Azoty SA(Compo Expert)
- Indian Farmers Fertiliser Cooperative Limited
- Koch Industries Inc.
- Nutrien Ltd.
- SABIC Agri-Nutrients Co.
- Yara International ASA
第7章:CEO面臨的關鍵策略問題
第 8 章 附錄
- 世界概況
- 概述
- 五力分析框架
- 全球價值鏈分析
- 市場動態(DRO)
- 資訊來源及延伸閱讀
- 圖片列表
- 關鍵見解
- 資料包
- 詞彙表
簡介目錄
Product Code: 92582
The Nitrogenous Fertilizer Market size is estimated at 174.4 billion USD in 2025, and is expected to reach 232.3 billion USD by 2030, growing at a CAGR of 5.91% during the forecast period (2025-2030).
The growing need to increase the production is expected to bolster the growth of the market.
- Urea is the most important and most used nitrogenous fertilizer globally. In 2022, it accounted for a 48.6% share of the total consumption of nitrogenous fertilizers globally. The global urea market was valued at USD 75.0 billion in 2022, with a volume consumption of 140.2 million metric ton in the same year.
- Anhydrous ammonia has the highest nitrogen content (82%) among all nitrogenous fertilizers, where nitrogen is readily available in the form of NH3. The global market for anhydrous ammonia was valued at USD 24.5 million in 2022, with a volume consumption of 4.3 billion metric tons in the same year. However, the usage of anhydrous ammonia as a fertilizer is restricted to the countries in North America and is commonly used in the region's corn belts since it is a highly nitrogen-consuming crop.
- The ammonium nitrate market accounted for 6.3% and 8.5%, by value and volume, respectively, of the total nitrogenous fertilizers in 2022 and it is anticipated to grow over the forecasted period 2023-2030 at 4.9% CAGR in terms of value. Ammonium Nitrate is more inexpensive than many other nitrogen fertilizers and suitable for all seasons, making it a preferred choice for growers.
- Moreover, Asia-Pacific was the largest market for nitrogenous fertilizers in 2022. It accounted for a market value share of 34.6%. In the Asia-Pacific region, China and India are the two largest consumers owing to their increasing population and large areas under cultivation.
- The global nitrogenous fertilizer market value is anticipated to grow during the forecast period at 5.6% CAGR as it is the most demanded nutrient.
Nitrogen deficiency in major crops and reducing nitrogen use efficiency may drive the nitrogenous fertilizers market
- In 2022, the global nitrogenous fertilizer market reached a value of USD 184.7 billion, with a consumption volume of 288.8 million metric tons. This surge in nitrogen fertilizer adoption is primarily driven by the reduced efficiency of crops in utilizing nitrogen from the soil.
- Asia-Pacific dominates the nitrogenous fertilizer market, commanding a 39.0% share in 2022. Notably, China and India, both agricultural powerhouses, benefit from ample arable land, a rising food demand due to increasing population, and significant government support. These factors are poised to propel nitrogenous fertilizer consumption in the region further.
- North America accounted for market volume shares of 23.2%. In North America, the United States dominates the market, boasting the majority share due to its extensive arable land, with field crops occupying 69% of the cropland, necessitating higher nitrogen inputs.
- Followed by North America, Europe, the third-largest market, held a 16.7% volume share in 2022. The region grapples with challenges like droughts and heatwaves, which hamper nitrogen availability in the soil, leading to crop losses. Consequently, farmers in Europe increasingly turn to nitrogenous fertilizers, indicating a potential market upswing.
- Nitrogenous fertilizers hold paramount importance in agricultural production. Despite shrinking cultivated areas, the global market for these fertilizers is projected to witness growth, driven by intensified cultivation practices and increased fertilizer application, all aimed at bolstering yields and productivity in the agricultural sector.
Global Nitrogenous Fertilizer Market Trends
The rising pressure on the agricultural sector to increase food production is expected to drive area under field crop cultivation
- The global agricultural sector is currently facing many challenges. According to the UN, the world population will likely exceed nine billion by 2050. This population growth may overburden the agricultural sector, which is already experiencing an output loss due to a lack of laborers and the shrinkage of agricultural fields caused by rising urbanization. According to the Food and Agriculture Organization, 70% of the global population is expected to live in cities by 2050. Due to the global loss of arable land, farmers need more fertilizers to increase crop yields.
- Asia-Pacific is the world's largest producer of agricultural products. Agriculture is critical to the region's economy, as it employs about 20% of the total available workforce. Field crop cultivation dominates the region, accounting for more than 95% of the total crop area in the region. Rice, wheat, and corn are the major field crops produced in the region, together accounting for about 42.5% of the total crop area in 2022.
- North America is the second-largest arable region in terms of total agricultural land area in the world. Diverse varieties of crops are grown on North American farms, primarily field crops. According to the USDA, corn, cotton, rice, soybean, and wheat are among the region's dominant field crops. The United States dominated the market by accounting for 155.09 million hectares of the total area under crop cultivation in the region during the study period, with field crops covering the majority of the area, accounting for a share of 65.7% in 2022. Crop acreage in the country fell significantly between 2017 and 2019, primarily due to unfavorable environmental conditions that resulted in heavy floods in areas such as Texas and Houston.
Nitrogen is the most widely used primary nutrient fertilizer in field crops, accounting for 45.57% of the total consumption
- In 2023, the average primary nutrient application rate for field crops stood at 164.3 kg per hectare. Notably, corn, rice, wheat, sorghum, soybean, rapeseed, and cotton represented the primary field crops cultivated, and these crops need higher nutrient levels to support their growth. The nutrient deficiency arising from intensive agricultural practices and the continuous cultivation of major crops, such as wheat, necessitates an increased application of nutrients. This situation calls for higher nutrient input to maintain soil fertility.
- Nitrogen stands out as the predominant nutrient consumed by field crops among all the primary nutrients. The average nutrient application rate of nitrogen reached a substantial 224.6 kg per hectare. The soils experience nitrogen deficiency due to their high pH levels, sandy soil composition, and persistent dry conditions resulting from recurrent droughts and heat waves. These factors collectively drive an increased demand for nitrogen nutrients in agricultural practices.
- Rapeseed emerged as a significant consumer of nitrogen nutrients, with an average nutrient application rate of 347.4 kg per hectare. This substantial nitrogen demand in rapeseed cultivation is primarily linked to the reduced nitrogen use efficiency (NUE) by these crops. China, Canada, India, Australia, and European countries are major producers of rapeseed crops. Changing climatic conditions like recent droughts and heavy flooding conditions lead to N loss from soils, which affects crop growth and yield formation of rapeseed. It is necessary to control the nitrogen application rate to keep it within the limits. Appropriate levels of nitrogen can boost the photosynthetic capacity, metabolic levels, and morphogenesis and increase yield.
Nitrogenous Fertilizer Industry Overview
The Nitrogenous Fertilizer Market is fragmented, with the top five companies occupying 19.67%. The major players in this market are CF Industries Holdings, Inc., EuroChem Group, Nutrien Ltd., SABIC Agri-Nutrients Co. and Yara International ASA (sorted alphabetically).
Additional Benefits:
- The market estimate (ME) sheet in Excel format
- 3 months of analyst support
TABLE OF CONTENTS
1 EXECUTIVE SUMMARY & KEY FINDINGS
2 REPORT OFFERS
3 INTRODUCTION
- 3.1 Study Assumptions & Market Definition
- 3.2 Scope of the Study
- 3.3 Research Methodology
4 KEY INDUSTRY TRENDS
- 4.1 Acreage Of Major Crop Types
- 4.1.1 Field Crops
- 4.1.2 Horticultural Crops
- 4.2 Average Nutrient Application Rates
- 4.2.1 Primary Nutrients
- 4.2.1.1 Field Crops
- 4.2.1.2 Horticultural Crops
- 4.2.1 Primary Nutrients
- 4.3 Agricultural Land Equipped For Irrigation
- 4.4 Regulatory Framework
- 4.5 Value Chain & Distribution Channel Analysis
5 MARKET SEGMENTATION (includes market size in Value in USD and Volume, Forecasts up to 2030 and analysis of growth prospects)
- 5.1 Product
- 5.1.1 Ammonium Nitrate
- 5.1.2 Anhydrous Ammonia
- 5.1.3 Urea
- 5.1.4 Others
- 5.2 Form
- 5.2.1 Conventional
- 5.2.2 Speciality
- 5.2.2.1 CRF
- 5.2.2.2 Liquid Fertilizer
- 5.2.2.3 SRF
- 5.2.2.4 Water Soluble
- 5.3 Application Mode
- 5.3.1 Fertigation
- 5.3.2 Foliar
- 5.3.3 Soil
- 5.4 Crop Type
- 5.4.1 Field Crops
- 5.4.2 Horticultural Crops
- 5.4.3 Turf & Ornamental
- 5.5 Region
- 5.5.1 Asia-Pacific
- 5.5.1.1 Australia
- 5.5.1.2 Bangladesh
- 5.5.1.3 China
- 5.5.1.4 India
- 5.5.1.5 Indonesia
- 5.5.1.6 Japan
- 5.5.1.7 Pakistan
- 5.5.1.8 Philippines
- 5.5.1.9 Thailand
- 5.5.1.10 Vietnam
- 5.5.1.11 Rest of Asia-Pacific
- 5.5.2 Europe
- 5.5.2.1 France
- 5.5.2.2 Germany
- 5.5.2.3 Italy
- 5.5.2.4 Netherlands
- 5.5.2.5 Russia
- 5.5.2.6 Spain
- 5.5.2.7 Ukraine
- 5.5.2.8 United Kingdom
- 5.5.2.9 Rest of Europe
- 5.5.3 Middle East & Africa
- 5.5.3.1 Nigeria
- 5.5.3.2 Saudi Arabia
- 5.5.3.3 South Africa
- 5.5.3.4 Turkey
- 5.5.3.5 Rest of Middle East & Africa
- 5.5.4 North America
- 5.5.4.1 Canada
- 5.5.4.2 Mexico
- 5.5.4.3 United States
- 5.5.4.4 Rest of North America
- 5.5.5 South America
- 5.5.5.1 Argentina
- 5.5.5.2 Brazil
- 5.5.5.3 Rest of South America
- 5.5.1 Asia-Pacific
6 COMPETITIVE LANDSCAPE
- 6.1 Key Strategic Moves
- 6.2 Market Share Analysis
- 6.3 Company Landscape
- 6.4 Company Profiles
- 6.4.1 CF Industries Holdings, Inc.
- 6.4.2 Coromandel International Ltd.
- 6.4.3 EuroChem Group
- 6.4.4 Grupa Azoty S.A. (Compo Expert)
- 6.4.5 Indian Farmers Fertiliser Cooperative Limited
- 6.4.6 Koch Industries Inc.
- 6.4.7 Nutrien Ltd.
- 6.4.8 SABIC Agri-Nutrients Co.
- 6.4.9 Yara International ASA
7 KEY STRATEGIC QUESTIONS FOR FERTILIZER CEOS
8 APPENDIX
- 8.1 Global Overview
- 8.1.1 Overview
- 8.1.2 Porter's Five Forces Framework
- 8.1.3 Global Value Chain Analysis
- 8.1.4 Market Dynamics (DROs)
- 8.2 Sources & References
- 8.3 List of Tables & Figures
- 8.4 Primary Insights
- 8.5 Data Pack
- 8.6 Glossary of Terms
02-2729-4219
+886-2-2729-4219
 全球氮肥市場(按類型、形態、作物類型和分銷管道分類)預測 2025-2032
 2025年氮肥全球市場報告
 日本氮肥市場報告(按類型(尿素、硝酸銨、硫酸銨、硝酸銨鈣等)、作物類型、形式、施用方式和地區)2025-20332025 年至 2033 年氮肥市場報告(按類型分類,包括尿素、硝酸銨、硫酸銨、硝酸銨鈣等)、作物類型、形式、施用方式和地區
 全球氮肥市場研究報告-產業分析、規模、佔有率、成長、趨勢與預測 2025 年至 2033 年
 氮肥市場 - 全球產業規模、佔有率、趨勢、機會和預測,按產品、應用、地區和競爭細分,2020-2030 年
 氮肥市場評估:按產品類型、形式、作物類型、應用模式和地區劃分的機會和預測(2018-2032 年)
 氮肥市場規模、佔有率、成長分析、按類型、按作物類型、按應用、按形式、按地區 - 行業預測,產業預測,2024-2031年
 2030 年氮肥市場預測:按產品、形式、應用和地區分類的全球分析