


 |
市場調查報告書
商品編碼
1693516
肥料:市場佔有率分析、行業趨勢和統計數據、成長預測(2025-2030 年)Fertilizers - Market Share Analysis, Industry Trends & Statistics, Growth Forecasts (2025 - 2030) |
||||||
價格
※ 本網頁內容可能與最新版本有所差異。詳細情況請與我們聯繫。
簡介目錄
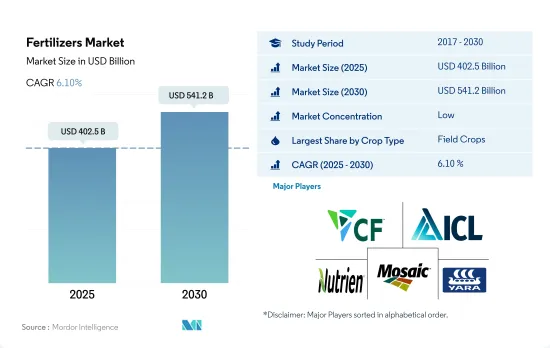
預計 2025 年肥料市場規模將達到 4,025 億美元,到 2030 年將達到 5,412 億美元,預測期內(2025-2030 年)的複合年成長率為 6.10%。
農業種植面積的下降預計將增加肥料需求並推動肥料市場的發展。
- 2022年,田間作物將佔全球肥料市場的約82.1%,價值約3,539億美元。田間作物生產在全球占主導地位,全球超過 95.0% 的農業用地用於田間作物種植。稻米、小麥和玉米是世界主要田間作物,這三種作物約佔世界農業用地的38.0%。
- 園藝作物約佔全球肥料市場總量的 15.0%。園藝作物生產以開發中國家為主,特別是亞太國家。亞太地區在全球園藝肥料市場的主導地位主要歸功於其在世界園藝種植面積中的佔有率,約佔73.0%(約1.3766億公頃)。
- 草坪和觀賞植物領域是最小的肥料市場,其次是園藝作物。 2022 年,草坪和觀賞植物領域將佔全球肥料市場的約 2.4%,價值約 104.2 億美元。草坪和觀賞肥料市場是一個分散的市場。不過,與亞太和南美相比,北美和歐洲等新興市場佔有更大的佔有率。
- 亞太地區在田間和園藝作物種植領域佔據全球主導地位。亞太地區肥料市場正在快速成長。歐洲是第二大肥料市場,其次是亞太地區。許多地區都市化的加速和整體農業面積的下降正在增加對化肥的需求,預計這將在 2023 年至 2030 年期間推動化肥市場的發展。
亞太地區主導全球肥料市場
- 研究期間,全球肥料市場呈現穩定的成長率,2022年達到4,290億美元。
- 2022年亞太地區將佔最大佔有率,達到44.8%,其次是歐洲和南美洲。根據美國農業部統計,中國是該地區乃至全球最大的化肥生產國和出口國,佔全球化肥產量的25%。預計2022年中國化肥市場規模將達703億美元,消費量將達9,420萬噸。
- 2022年,北美將佔全球肥料市場的17.8%。在北美,美國和加拿大按價值和數量計佔肥料市場的90.0%以上。北美擁有磷酸鹽和鉀肥資源,但一半以上的氮肥和85.0%以上的鉀肥都仰賴進口。
- 2022年歐洲將佔全球肥料市場的15.1%。法國是歐洲最大的肥料消費國之一,預計到2022年底將佔全球肥料市場的20.1%。預計到2022年底市場規模將達到90億美元,與前一年同期比較增5.8%。先進耕作方法的採用也將導致專用肥料的使用增加。
- 2022 年,南美洲佔據了 11.2% 的市場佔有率。田間作物在南美肥料市場佔據主導地位,佔 2022 年市場佔有率的 95%。南美洲種植最多的三種作物是大豆、玉米和甘蔗。
- 由於田間作物種植面積的增加以及肥料需求的相應增加,預計市場將在 2023 年至 2030 年間成長。
全球肥料市場趨勢
為滿足日益成長的糧食需求,農業面臨的壓力日益增大,預計將導致田間作物種植面積增加
- 全球農業部門面臨許多挑戰。根據聯合國預測,到 2050 年,世界人口可能超過 90 億。人口成長可能對農業造成過度壓力,而由於勞動力短缺和都市化進程加劇導致農地面積減少,農業產量已經下降。根據聯合國糧食及農業組織預測,2050年,全球70%的人口預計將居住在城市。隨著全球可耕地面積減少,農民需要使用更多的肥料來提高作物產量。
- 亞太地區是世界上最大的農產品生產地區。農業對該地區的經濟至關重要,約佔總勞動力的 20%。該地區以田間作物種植為主,約佔全部區域作物總面積的95%以上。水稻、小麥和玉米是該地區的主要田間作物,2022年約佔總耕地面積的24.3%。
- 北美洲是世界上第二大可耕地。該農場種植多種作物,主要為田間作物。尤其是玉米、棉花、稻米、大豆和小麥,都是美國農業部強調的主要田間作物。 2022年,美國佔北美作物種植面積的46.2%。然而,2017年至2019年期間,該國作物面積大幅下降,主要原因是惡劣天氣導致德克薩斯和休士頓等地區發生嚴重洪災。
全球田間作物主要養分氮、鉀、磷的平均施用量為164.31公斤/公頃。
- 玉米、油菜籽、棉花、高粱、水稻、小麥和大豆是世界主要的營養密集型作物。 2022 年這些作物的平均施用量為:玉米:230.57 公斤/公頃、油菜籽:255.75 公斤/公頃、棉花:172.70 公斤/公頃、高粱:158.46 公斤/公頃、水稻:154.49 公斤/公頃、小麥:135.35 公斤/公頃公頃:154.49 公斤/公頃、小麥:135。主要營養素對作物至關重要,因為它們支持植物的基本代謝過程,並有助於細胞、細胞膜和葉綠素等關鍵組織的形成。特別是磷對於種植優質作物至關重要,而鉀在激活植物生長所必需的酵素方面起著至關重要的作用。
- 全球田間作物氮、鉀、磷的平均施用量為164.31公斤/公頃。氮肥是最廣泛使用的基肥,2022 年施用量為 224.6 公斤/公頃。其次是鉀肥,施用量 150.3 公斤/公頃,磷肥位居第三,施用量為 117.9 公斤/公頃。
- 2022年,油菜籽施用氮量最高,為347.4公斤/公頃,玉米施用磷量最高,為156.3公斤/公頃。菜籽鉀施用量最高,為每公頃 248.6 公斤。
- 世界各地田間作物種植正在興起,尤其是在南美洲和亞太地區。這些地區正成為化肥的主要市場。歐洲和北美等已開發地區以及遭受營養缺乏的地區擴大採用特種肥料,因為它們具有功效。預計這些趨勢將在 2023 年至 2030 年期間推動主要營養肥料市場的發展。
肥料行業概況
肥料市場分散,前五大企業市佔率為14.27%。該市場的主要企業有:CF Industries Holdings, Inc.、ICL Group Ltd、Nutrien Ltd.、The Mosaic Company 和 Yara International ASA(按字母順序排列)
其他福利
- Excel 格式的市場預測 (ME) 表
- 3個月的分析師支持
目錄
第1章執行摘要和主要發現
第2章 報告要約
第3章 引言
- 研究假設和市場定義
- 研究範圍
- 調查方法
第4章 產業主要趨勢
- 主要作物種植面積
- 田間作物
- 園藝作物
- 平均養分施用量
- 微量營養素
- 田間作物
- 園藝作物
- 主要營養素
- 田間作物
- 園藝作物
- 次要宏量營養素
- 田間作物
- 園藝作物
- 微量營養素
- 灌溉農田
- 法律規範
- 價值鍊和通路分析
第5章市場區隔
- 類型
- 複合型
- 直的
- 微量營養素
- 硼
- 銅
- 鐵
- 錳
- 鉬
- 鋅
- 其他
- 氮
- 硝酸銨
- 無水氨
- 尿素
- 其他
- 磷酸
- DAP
- MAP
- SSP
- TSP
- 其他
- 鉀
- MoP
- SoP
- 其他
- 次要營養物質
- 鈣
- 鎂
- 硫
- 形式
- 傳統的
- 特別的
- CRF
- 液體肥料
- SRF
- 水溶性
- 施肥方式
- 受精
- 葉面噴布
- 土壤
- 作物類型
- 田間作物
- 園藝作物
- 草坪和觀賞植物
- 地區
- 亞太地區
- 澳洲
- 孟加拉
- 中國
- 印度
- 印尼
- 日本
- 巴基斯坦
- 菲律賓
- 泰國
- 越南
- 其他亞太地區
- 歐洲
- 法國
- 德國
- 義大利
- 荷蘭
- 俄羅斯
- 西班牙
- 烏克蘭
- 英國
- 其他歐洲國家
- 中東和非洲
- 奈及利亞
- 沙烏地阿拉伯
- 南非
- 土耳其
- 其他中東和非洲地區
- 北美洲
- 加拿大
- 墨西哥
- 美國
- 北美其他地區
- 南美洲
- 阿根廷
- 巴西
- 南美洲其他地區
- 亞太地區
第6章 競爭格局
- 關鍵策略趨勢
- 市場佔有率分析
- 商業狀況
- 公司簡介
- CF Industries Holdings, Inc.
- Coromandel International Ltd.
- Grupa Azoty SA(Compo Expert)
- Haifa Group
- ICL Group Ltd
- Indian Farmers Fertiliser Cooperative Limited
- Nutrien Ltd.
- Sociedad Quimica y Minera de Chile SA
- The Mosaic Company
- Yara International ASA
第7章:CEO面臨的關鍵策略問題
第 8 章 附錄
- 世界概況
- 概述
- 五力分析框架
- 全球價值鏈分析
- 市場動態(DRO)
- 資訊來源及延伸閱讀
- 圖片列表
- 關鍵見解
- 資料包
- 詞彙表
簡介目錄
Product Code: 92580
The Fertilizers Market size is estimated at 402.5 billion USD in 2025, and is expected to reach 541.2 billion USD by 2030, growing at a CAGR of 6.10% during the forecast period (2025-2030).
Decreasing agricultural area is increasing the demand for fertilizers and is expected to drive the fertilizer market
- In 2022, field crops dominated the global fertilizers market, accounting for about 82.1% of the market value of the global fertilizer market, at about USD 353.9 billion. Field crop production is dominant worldwide, and more than 95.0% of the agricultural land in the world is under field crop cultivation. Rice, wheat, and corn are the major field crops produced globally, and these three crops account for about 38.0% of the global agricultural land.
- Horticultural crops account for about 15.0% of the total fertilizer market value worldwide. Horticultural crop production is dominant in developing countries, particularly in Asia-Pacific. Asia-Pacific's dominance in the global horticultural fertilizer market is primarily due to the presence of about 73.0% of the global horticultural cultivation area, which is about 137.66 million hectares of land under horticulture cultivation.
- The turf and ornamentals segment is the smallest fertilizer market, followed by horticultural crops. In 2022, the turf and ornamentals segment accounted for about 2.4% of the market value of the global fertilizer market, at about USD 10.42 billion. The turf and ornamental fertilizer market is a fragmented market. However, developed regions like North America and Europe occupy a major market share compared to Asia-Pacific and South America.
- Asia-Pacific dominates in growing both field and horticultural crops worldwide. The Asia-Pacific fertilizer market is growing at a fast rate. Europe is the second-largest fertilizer market, followed by Asia-Pacific. The increasing urbanization in many regions and the decreasing overall agricultural area are increasing the demand for fertilizers and are expected to drive the fertilizer market between 2023 and 2030.
Asia Pacific is dominating the global fertilizer market
- The global fertilizer market grew at a stable rate during the study period, registering a value of USD 429.0 billion in 2022.
- Asia-Pacific occupied the largest share of 44.8% in 2022, followed by Europe and South America. China is the largest producer and exporter of fertilizers in the region and the world, contributing 25% to global fertilizer production, according to the USDA. The Chinese fertilizer market is estimated to be valued at USD 70.3 billion in 2022, with a volume consumption of 94.2 million metric tons.
- North America accounted for 17.8% of the global fertilizer market in 2022. In North America, the United States and Canada constitute more than 90.0% of the fertilizer market's value and volume. Although North America has phosphate and potash resources, the region is a net importer of more than half of its nitrogenous fertilizers and over 85.0% of its potash from international sources.
- Europe accounted for 15.1% of the global fertilizer market in 2022. France is one of the largest fertilizer-consuming countries in Europe, with an expected overall share of 20.1% by the end of 2022. The market value is expected to reach USD 9 billion by the end of 2022, with a 5.8% y-o-y growth rate. The adoption of advanced cultivation methods will also increase the usage of specialty fertilizers.
- South America accounted for 11.2% of the market share in 2022. Field crops dominated the South American fertilizer market and accounted for 95% of the market share in 2022. The top three crops grown in South America are soybean, corn, and sugarcane.
- With the increasing cultivation of field crops, along with a subsequently increased demand for fertilizers, the market is anticipated to grow between 2023 and 2030.
Global Fertilizers Market Trends
The rising pressure on the agriculture industry to meet the growing demand for food is expected to increase the area under field crop cultivation
- The global agricultural sector is facing many challenges. According to the UN, the world population may exceed 9 billion by 2050. This population growth may overburden the agricultural industry, which is already experiencing an output loss due to a lack of laborers and the shrinkage of agricultural fields caused by rising urbanization. According to the Food and Agriculture Organization, 70% of the global population is expected to live in cities by 2050. Due to the global loss of arable land, farmers now need to utilize more fertilizers to increase crop yields.
- Asia-Pacific is the world's largest producer of agricultural products. Agriculture is critical to the region's economy, as it employs about 20% of the total available workforce. Field crop cultivation dominates the region, accounting for about more than 95% of the total crop area in the region. Rice, wheat, and corn are the major field crops produced in the region, together accounting for about 24.3% of the total crop area in 2022.
- North America ranks as the second-largest arable region globally. Its farms cultivate a diverse range of crops, with a focus on field crops. Notably, corn, cotton, rice, soybean, and wheat are the prominent field crops, as highlighted by the USDA. In 2022, the United States commanded 46.2% of North America's crop cultivation area. However, the country witnessed a significant drop in crop acreage between 2017 and 2019, primarily due to adverse environmental conditions, leading to severe flooding in regions like Texas and Houston.
The global average application rate of primary nutrient nitrogen, potassium, and phosphorus in field crops is 164.31 kg/ha
- Corn, rapeseed, cotton, sorghum, rice, wheat, and soybean are among the primary nutrient-intensive crops globally. In 2022, the average application rates for these crops were as follows: corn - 230.57 kg/ha, rapeseed - 255.75 kg/ha, cotton - 172.70 kg/ha, sorghum - 158.46 kg/ha, rice - 154.49 kg/ha, wheat - 135.35 kg/ha, and soybean - 120.97 kg/ha. Primary nutrients are vital for crops as they support essential plant metabolic processes and contribute to the formation of key tissues like cells, cell membranes, and chlorophyll. Notably, phosphorus is crucial for cultivating high-quality crops, while potassium plays a pivotal role in activating enzymes necessary for plant growth.
- On a global scale, field crops have an average application rate of 164.31 kg/ha for nitrogen, potassium, and phosphorus. Nitrogen stands out as the most widely used primary nutrient fertilizer, with an application rate of 224.6 kg/ha in 2022. Potassic fertilizers follow, with an application rate of 150.3 kg/ha, and phosphorus ranks third, with an application rate of 117.9 kg/ha.
- In 2022, rapeseed had the highest nitrogen application rate at 347.4 kg/ha, while corn led in phosphorus application at 156.3 kg/ha. Canola took the lead in potassium application, with a rate of 248.6 kg/ha.
- Field crop cultivation is on the rise globally, particularly in South America and Asia-Pacific. These regions are emerging as key markets for fertilizers. Developed regions like Europe and North America, along with areas grappling with nutrient deficiencies, are increasingly adopting specialty fertilizers for their efficacy. These trends are poised to propel the primary nutrient fertilizers market during 2023-2030.
Fertilizers Industry Overview
The Fertilizers Market is fragmented, with the top five companies occupying 14.27%. The major players in this market are CF Industries Holdings, Inc., ICL Group Ltd, Nutrien Ltd., The Mosaic Company and Yara International ASA (sorted alphabetically).
Additional Benefits:
- The market estimate (ME) sheet in Excel format
- 3 months of analyst support
TABLE OF CONTENTS
1 EXECUTIVE SUMMARY & KEY FINDINGS
2 REPORT OFFERS
3 INTRODUCTION
- 3.1 Study Assumptions & Market Definition
- 3.2 Scope of the Study
- 3.3 Research Methodology
4 KEY INDUSTRY TRENDS
- 4.1 Acreage Of Major Crop Types
- 4.1.1 Field Crops
- 4.1.2 Horticultural Crops
- 4.2 Average Nutrient Application Rates
- 4.2.1 Micronutrients
- 4.2.1.1 Field Crops
- 4.2.1.2 Horticultural Crops
- 4.2.2 Primary Nutrients
- 4.2.2.1 Field Crops
- 4.2.2.2 Horticultural Crops
- 4.2.3 Secondary Macronutrients
- 4.2.3.1 Field Crops
- 4.2.3.2 Horticultural Crops
- 4.2.1 Micronutrients
- 4.3 Agricultural Land Equipped For Irrigation
- 4.4 Regulatory Framework
- 4.5 Value Chain & Distribution Channel Analysis
5 MARKET SEGMENTATION (includes market size in Value in USD and Volume, Forecasts up to 2030 and analysis of growth prospects)
- 5.1 Type
- 5.1.1 Complex
- 5.1.2 Straight
- 5.1.2.1 Micronutrients
- 5.1.2.1.1 Boron
- 5.1.2.1.2 Copper
- 5.1.2.1.3 Iron
- 5.1.2.1.4 Manganese
- 5.1.2.1.5 Molybdenum
- 5.1.2.1.6 Zinc
- 5.1.2.1.7 Others
- 5.1.2.2 Nitrogenous
- 5.1.2.2.1 Ammonium Nitrate
- 5.1.2.2.2 Anhydrous Ammonia
- 5.1.2.2.3 Urea
- 5.1.2.2.4 Others
- 5.1.2.3 Phosphatic
- 5.1.2.3.1 DAP
- 5.1.2.3.2 MAP
- 5.1.2.3.3 SSP
- 5.1.2.3.4 TSP
- 5.1.2.3.5 Others
- 5.1.2.4 Potassic
- 5.1.2.4.1 MoP
- 5.1.2.4.2 SoP
- 5.1.2.4.3 Others
- 5.1.2.5 Secondary Macronutrients
- 5.1.2.5.1 Calcium
- 5.1.2.5.2 Magnesium
- 5.1.2.5.3 Sulfur
- 5.2 Form
- 5.2.1 Conventional
- 5.2.2 Speciality
- 5.2.2.1 CRF
- 5.2.2.2 Liquid Fertilizer
- 5.2.2.3 SRF
- 5.2.2.4 Water Soluble
- 5.3 Application Mode
- 5.3.1 Fertigation
- 5.3.2 Foliar
- 5.3.3 Soil
- 5.4 Crop Type
- 5.4.1 Field Crops
- 5.4.2 Horticultural Crops
- 5.4.3 Turf & Ornamental
- 5.5 Region
- 5.5.1 Asia-Pacific
- 5.5.1.1 Australia
- 5.5.1.2 Bangladesh
- 5.5.1.3 China
- 5.5.1.4 India
- 5.5.1.5 Indonesia
- 5.5.1.6 Japan
- 5.5.1.7 Pakistan
- 5.5.1.8 Philippines
- 5.5.1.9 Thailand
- 5.5.1.10 Vietnam
- 5.5.1.11 Rest of Asia-Pacific
- 5.5.2 Europe
- 5.5.2.1 France
- 5.5.2.2 Germany
- 5.5.2.3 Italy
- 5.5.2.4 Netherlands
- 5.5.2.5 Russia
- 5.5.2.6 Spain
- 5.5.2.7 Ukraine
- 5.5.2.8 United Kingdom
- 5.5.2.9 Rest of Europe
- 5.5.3 Middle East & Africa
- 5.5.3.1 Nigeria
- 5.5.3.2 Saudi Arabia
- 5.5.3.3 South Africa
- 5.5.3.4 Turkey
- 5.5.3.5 Rest of Middle East & Africa
- 5.5.4 North America
- 5.5.4.1 Canada
- 5.5.4.2 Mexico
- 5.5.4.3 United States
- 5.5.4.4 Rest of North America
- 5.5.5 South America
- 5.5.5.1 Argentina
- 5.5.5.2 Brazil
- 5.5.5.3 Rest of South America
- 5.5.1 Asia-Pacific
6 COMPETITIVE LANDSCAPE
- 6.1 Key Strategic Moves
- 6.2 Market Share Analysis
- 6.3 Company Landscape
- 6.4 Company Profiles
- 6.4.1 CF Industries Holdings, Inc.
- 6.4.2 Coromandel International Ltd.
- 6.4.3 Grupa Azoty S.A. (Compo Expert)
- 6.4.4 Haifa Group
- 6.4.5 ICL Group Ltd
- 6.4.6 Indian Farmers Fertiliser Cooperative Limited
- 6.4.7 Nutrien Ltd.
- 6.4.8 Sociedad Quimica y Minera de Chile SA
- 6.4.9 The Mosaic Company
- 6.4.10 Yara International ASA
7 KEY STRATEGIC QUESTIONS FOR FERTILIZER CEOS
8 APPENDIX
- 8.1 Global Overview
- 8.1.1 Overview
- 8.1.2 Porter's Five Forces Framework
- 8.1.3 Global Value Chain Analysis
- 8.1.4 Market Dynamics (DROs)
- 8.2 Sources & References
- 8.3 List of Tables & Figures
- 8.4 Primary Insights
- 8.5 Data Pack
- 8.6 Glossary of Terms
02-2729-4219
+886-2-2729-4219
 緩釋肥料市場:2026-2032年全球市場預測(以包膜類型、作物類型、釋放週期、養分類型、施用方法、最終用途和銷售管道)
 2026年全球生物炭肥料市場報告幾丁質肥料市場:2026-2032年全球市場預測(按應用、類型、原料、配方和分銷管道分類)肥料包膜市場:2026-2032年全球市場預測(以包膜化學、釋放機制、包膜養分類型、外形規格、製造流程、最終用途及通路分類)化肥市場:2026-2032年全球市場預測(依產品類型、作物類型、包裝、施用方法、最終用戶和分銷管道分類)
 海藻土壤改良劑市場預測至 2034 年—按產品類型、海藻種類、形態、應用、養殖方法、通路和地區進行全球分析。藻類肥料市場:2026-2032年全球市場預測(依原料、產品類型、通路及應用分類)複合肥料市場:按產品類型、作物類型、物理形態和應用分類的全球市場預測,2026-2032年顆粒肥料市場:依產品類型、作物類型、配方類型、施用方法、包裝類型、使用時間、最終用戶和銷售管道分類-2026-2032年全球預測
 矽肥市場報告:按類型、形態、應用和地區分類(2026-2034年)
▼