


 |
市場調查報告書
商品編碼
1693515
印度尿素:市場佔有率分析、行業趨勢和統計數據、成長預測(2025-2030 年)India Urea - Market Share Analysis, Industry Trends & Statistics, Growth Forecasts (2025 - 2030) |
||||||
※ 本網頁內容可能與最新版本有所差異。詳細情況請與我們聯繫。
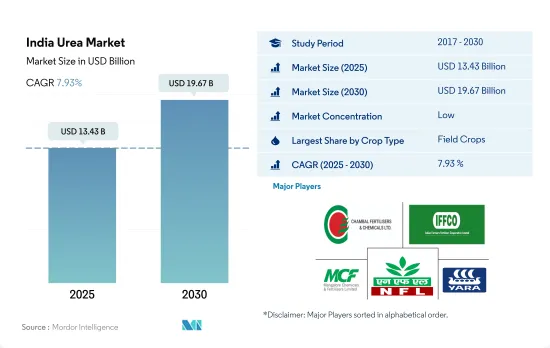
印度尿素市場規模預計在 2025 年為 134.3 億美元,預計到 2030 年將達到 196.7 億美元,預測期內(2025-2030 年)的複合年成長率為 7.93%。
預計各類作物對尿素的消費量不斷增加以及對高效肥料的需求不斷增加將推動尿素肥料市場的發展。
- 在印度,由於尿素成本低且在該國廣泛普及,僅田間作物就佔了整個尿素肥料市場的約 89.3% 價值佔有率,並在 2022 年消耗了約 89.7% 的傳統尿素肥料。然而,在大田作物中,由於尿素肥料的高效性,使用專用尿素肥料的趨勢正在成長。因此,預計其市場價值在 2023 年至 2030 年期間的複合年成長率將達到 7.8%。
- 園藝作物約佔尿素肥料市場總量的10.2%,2022年市場規模為12億美元。印度是世界第二大水果和蔬菜生產國,其中香蕉、芒果、檸檬、木瓜和秋葵產量排名第一。水果和蔬菜需求的成長以及種植面積的擴大預計將推動市場成長。
- 在過去的幾十年裡,施氮量不斷增加,而氮氣利用效率卻不斷下降。在印度,預計2050年化肥消費量將加倍,因此提高化肥使用效率迫在眉睫。控制釋放肥料可以提高肥料利用率,減少肥料污染,尤其是在園藝作物中。預計這些因素將在未來幾年推動所有作物領域的控制釋放肥料的成長。
- 花卉栽培是近年來發展較快的產業之一。例如,2020-21 年,該國出口了 15,600 噸花卉產品,總價值 780 萬美元。受國內外花卉種植需求不斷成長的推動,預計 2023 年至 2030 年期間草坪和觀賞作物的市場價值將以 7.1% 的複合年成長率成長。
印度尿素市場趨勢
錳缺乏症是歐洲國家常見的問題,最常發生在pH值高於6的沙質土壤和有機土壤。
- 2017年至2022年間,該國田間作物種植面積增加了3.5%。由於國內外消費需求不斷成長,該國穀物、豆類和油籽種植面積擴大是種植面積增加的主要驅動力。
- 依作物類型分類,水稻、小麥和大豆的種植面積最大,到2022年分別為4,700萬公頃、3,110萬公頃和1,230萬公頃。水稻是印度最重要的作物,約佔全國種植面積的四分之一,養活了全國約一半的人口。幾乎全國各地都有種植,主要分佈在西孟加拉邦、北方邦、安得拉邦、旁遮普邦和泰米爾納德邦。
- 因此,預計該國的米消費量將從 2016 年的 9,580 萬噸增加到 2022 年的 1.07 億噸,顯示該國對作物的需求不斷成長。預計這一趨勢將在 2023 年至 2030 年期間進一步推高化肥需求。同樣,國內小麥種植量從 2017 年的 9,850 萬噸增加到 2020 年的 1.076 億噸。小麥主要種植在旁遮普邦、西孟加拉邦、哈里亞納邦和拉賈斯坦邦。小麥是印度第二大穀物作物,在該國的糧食和營養安全中發揮著至關重要的作用。因此,該國的穀物種植業蓬勃發展,再加上國內外需求的不斷成長,預計將在 2023 年至 2030 年期間推動印度肥料市場的發展。
在主要營養元素中,氮是田間作物最常使用的營養元素。
- 2022年主要養分平均施用率為125.1公斤/公頃。特別值得注意的是氮肥,其施用量最高,平均施用量為 223.5 公斤/公頃。鑑於其作為主要營養素的重要性,氮在支持該國廣泛種植的水稻等產量作物發揮著至關重要的作用。然而,營養物質的缺乏,尤其是氮的缺乏,阻礙了全國水稻的生產。正如《生物肥料和有機肥料現況報告》所強調的那樣,印度土壤的健康狀況令人擔憂。報告發現,人們對化學肥料的依賴日益增加,經測試的土壤中分別有97.0%、83.0%和71.0%缺乏氮、磷和鉀。
- 主要作物中,2022年小麥、水稻、玉米養分施用量最高,分別為平均每公頃231公斤、156公斤、149公斤。小麥和米是國內和全球的主糧,但由於多種營養缺乏而面臨挑戰。除了氮、磷和鉀之外,這些作物還需要硫、硼、鐵和鋅等微量營養素來達到最佳生長。有效的營養管理對於提高作物產量至關重要,從而推動市場成長。
- 田間作物,尤其是穀物和穀類,對主要營養素有著極大的需求,尤其是氮肥。由於這些作物在印度廣泛種植,土壤養分正在迅速耗盡。因此,農民擴大使用肥料來填補缺口,預計這一趨勢將在 2023 年至 2030 年推動市場發展。
印度尿素產業概況
印度尿素市場較為分散,前五大公司市佔率為12.09%。市場的主要企業有:Chambal Fertilizers & Chemicals Ltd、Indian Farmers Fertiliser Cooperative Limited、Mangalore Chemicals & Fertilizers Ltd.、National Fertilizers Ltd 和 Yara International ASA(按字母順序排列)
其他福利
- Excel 格式的市場預測 (ME) 表
- 3個月的分析師支持
目錄
第1章執行摘要和主要發現
第2章 報告要約
第3章 引言
- 研究假設和市場定義
- 研究範圍
- 調查方法
第4章 產業主要趨勢
- 主要作物種植面積
- 田間作物
- 園藝作物
- 平均養分施用量
- 主要營養素
- 田間作物
- 園藝作物
- 主要營養素
- 灌溉農田
- 法律規範
- 價值鍊和通路分析
第5章市場區隔
- 專業類型
- CRF
- 聚合物塗層
- 聚合硫塗層
- 其他
- 液體肥料
- SRF
- 水溶性
- CRF
- 作物類型
- 田間作物
- 園藝作物
- 草坪和觀賞植物
- 形式
- 傳統的
- 特色作物
第6章 競爭格局
- 重大策略舉措
- 市場佔有率分析
- 商業狀況
- 公司簡介
- Chambal Fertilizers & Chemicals Ltd
- Coromandel International Ltd.
- Gujarat Narmada Valley Fertilizers & Chemicals Ltd
- Indian Farmers Fertiliser Cooperative Limited
- Mangalore Chemicals & Fertilizers Ltd.
- National Fertilizers Ltd
- Yara International ASA
- Zuari Agro Chemicals Ltd
第7章:CEO面臨的關鍵策略問題
第 8 章 附錄
- 世界概況
- 概述
- 五力分析框架
- 全球價值鏈分析
- 市場動態(DRO)
- 資訊來源及延伸閱讀
- 圖片列表
- 關鍵見解
- 資料包
- 詞彙表
The India Urea Market size is estimated at 13.43 billion USD in 2025, and is expected to reach 19.67 billion USD by 2030, growing at a CAGR of 7.93% during the forecast period (2025-2030).
The rising consumption of urea in all crop types and increasing demand for highly efficient fertilizers are expected to boost the urea fertilizer market
- In India, field crops alone account for about 89.3% value share of the total urea fertilizer market and consumed about 89.7% of conventional urea fertilizers in 2022 due to their low cost and widespread availability in the country. However, in field crops, there is an increasing trend in adopting specialty urea fertilizers due to their efficiency. Due to this, its market value is projected to register a CAGR of 7.8% between 2023 and 2030.
- Horticulture crops account for about 10.2% of the total urea fertilizer market, which was valued at USD 1.2 billion in 2022. India is the world's second-largest producer of fruits and vegetables, and the country ranks first in banana, mango, lemon, papaya, and okra. The rising demand for fruits and vegetables, coupled with the expansion of cultivation area, is anticipated to drive the growth of the market.
- Since the last few decades, there has been an increase in nitrogen application rates and a decrease in nitrogen use efficiency. It is estimated that fertilizer consumption in India may double by 2050, and there is an urgent need to improve the country's fertilizer use efficiency. The controlled-release fertilizers can improve fertilizer use efficiency and decrease fertilizer pollution, particularly in horticultural crops. These factors are anticipated to fuel the growth of control-release fertilizers in all crop segments in the coming years.
- The floriculture has been one of the growing industries in recent years. For instance, in 2020-21, the country exported 15.6 thousand metric tons of floriculture products for a total value of USD 7.8 million. The rising domestic and international demand for flowers is expected to increase the market value of turf and ornamental crops at 7.1% CAGR from 2023 to 2030.
India Urea Market Trends
Manganese deficiency is a common problem in European countries, which most frequently affects sandy and organic soils with a pH above 6
- The area under field crop cultivation in the country increased by 3.5% during 2017-2022. The increased cultivation of cereals, pulses, and oilseeds in the country due to the rising consumer demand domestically and internationally is the major driving factor for the rising acreage.
- By crop type, rice, wheat, and soybean occupied the largest area under cultivation in the country, accounting for 47 million ha, 31.1 million ha, and 12.3 million ha in 2022. Rice is the most important food crop of India, covering about one-fourth of the total cropped area and providing food to about half of the Indian population. It is cultivated in almost all the states of the country, mainly in West Bengal, Uttar Pradesh, Andhra Pradesh, Punjab, and Tamil Nadu.
- Accordingly, rice consumption in the country increased from 95.8 million tons in 2016 to 107 million tons in 2022, which shows the rising demand for the crop in the country. This trend is further anticipated to drive the demand for fertilizers during 2023-2030. Similarly, wheat cultivation in the country increased from 98.5 million tons in 2017 to 107.6 million tons in 2020. It is cultivated majorly in Punjab, West Bengal, Haryana, and Rajasthan. Wheat is the second most important cereal crop in India and plays a vital role in the food and nutritional security of the country. Therefore, the intense cereal cultivation in the country, coupled with rising domestic and international demand, is anticipated to drive the Indian fertilizer market during 2023-2030.
Among the primary nutrients, nitrogen is the most-applied nutrient in field crops.
- In 2022, the average application rate for primary nutrients stood at 125.1 kg/ha. Notably, nitrogen topped the list with an average application rate of 223.5 kg/ha. Given its significance as a primary nutrient, nitrogen plays a pivotal role in supporting high-yield crops like rice, which is extensively cultivated in the country. However, nutrient deficiencies, particularly in nitrogen, are hampering rice productivity nationwide. The soil health in India, as highlighted in the State of Biofertilizers and Organic Fertilizers report, is a cause for concern. It reveals a rising reliance on chemical fertilizers, with 97.0%, 83.0%, and 71.0% of tested soils showing deficiencies in nitrogen, phosphorous, and potassium, respectively.
- Among the major crops, wheat, rice, and corn/maize led the pack in nutrient application rates in 2022, averaging 231, 156, and 149 kg/ha, respectively. Wheat and rice, being staple foods both domestically and globally, face challenges due to multiple nutrient deficiencies. Apart from nitrogen, phosphorous, and potassium, these crops also require micronutrients like sulfur, boron, iron, and zinc for optimal growth. Effective nutrient management is crucial for boosting crop production, thereby fueling market growth.
- Field crops, especially grains and cereals, have a voracious appetite for primary nutrients, particularly nitrogen fertilizers. Given the extensive cultivation of these crops in India, the soil's nutrient content is rapidly depleting. Consequently, farmers are increasingly relying on fertilizers to bridge the gap, a trend projected to drive the market from 2023 to 2030.
India Urea Industry Overview
The India Urea Market is fragmented, with the top five companies occupying 12.09%. The major players in this market are Chambal Fertilizers & Chemicals Ltd, Indian Farmers Fertiliser Cooperative Limited, Mangalore Chemicals & Fertilizers Ltd., National Fertilizers Ltd and Yara International ASA (sorted alphabetically).
Additional Benefits:
- The market estimate (ME) sheet in Excel format
- 3 months of analyst support
TABLE OF CONTENTS
1 EXECUTIVE SUMMARY & KEY FINDINGS
2 REPORT OFFERS
3 INTRODUCTION
- 3.1 Study Assumptions & Market Definition
- 3.2 Scope of the Study
- 3.3 Research Methodology
4 KEY INDUSTRY TRENDS
- 4.1 Acreage Of Major Crop Types
- 4.1.1 Field Crops
- 4.1.2 Horticultural Crops
- 4.2 Average Nutrient Application Rates
- 4.2.1 Primary Nutrients
- 4.2.1.1 Field Crops
- 4.2.1.2 Horticultural Crops
- 4.2.1 Primary Nutrients
- 4.3 Agricultural Land Equipped For Irrigation
- 4.4 Regulatory Framework
- 4.5 Value Chain & Distribution Channel Analysis
5 MARKET SEGMENTATION (includes market size in Value in USD and Volume, Forecasts up to 2030 and analysis of growth prospects)
- 5.1 Speciality Type
- 5.1.1 CRF
- 5.1.1.1 Polymer Coated
- 5.1.1.2 Polymer-Sulfur Coated
- 5.1.1.3 Others
- 5.1.2 Liquid Fertilizer
- 5.1.3 SRF
- 5.1.4 Water Soluble
- 5.1.1 CRF
- 5.2 Crop Type
- 5.2.1 Field Crops
- 5.2.2 Horticultural Crops
- 5.2.3 Turf & Ornamental
- 5.3 Form
- 5.3.1 Conventional
- 5.3.2 Speciality
6 COMPETITIVE LANDSCAPE
- 6.1 Key Strategic Moves
- 6.2 Market Share Analysis
- 6.3 Company Landscape
- 6.4 Company Profiles
- 6.4.1 Chambal Fertilizers & Chemicals Ltd
- 6.4.2 Coromandel International Ltd.
- 6.4.3 Gujarat Narmada Valley Fertilizers & Chemicals Ltd
- 6.4.4 Indian Farmers Fertiliser Cooperative Limited
- 6.4.5 Mangalore Chemicals & Fertilizers Ltd.
- 6.4.6 National Fertilizers Ltd
- 6.4.7 Yara International ASA
- 6.4.8 Zuari Agro Chemicals Ltd
7 KEY STRATEGIC QUESTIONS FOR FERTILIZER CEOS
8 APPENDIX
- 8.1 Global Overview
- 8.1.1 Overview
- 8.1.2 Porter's Five Forces Framework
- 8.1.3 Global Value Chain Analysis
- 8.1.4 Market Dynamics (DROs)
- 8.2 Sources & References
- 8.3 List of Tables & Figures
- 8.4 Primary Insights
- 8.5 Data Pack
- 8.6 Glossary of Terms
 尿素市場分析及預測(至2035年):類型、產品、應用、最終用戶、形態、技術、製程、材料類型、安裝類型
 全球硫包覆尿素市場規模、佔有率、趨勢及成長分析報告(2026-2034)
 尿素市場規模、佔有率、趨勢及預測(依等級、應用、最終用途產業及地區分類),2026-2034年
 2026年全球尿素市場報告
 尿素:市佔率分析、產業趨勢與統計、成長預測(2026-2031)工業尿素:市場佔有率分析、產業趨勢與統計、成長預測(2026-2031)日本尿素市場報告(依等級、應用、最終用途產業及地區分類,2026-2034年)全球尿素市場:市場規模、佔有率、成長率、產業分析、按類型、應用和地區劃分的考量、未來預測(2026-2034)
 尿素市場規模、佔有率和成長分析(按等級、類型、應用和地區分類)-2026-2033年產業預測
 尿素市場按形態、等級、純度、分銷管道(間接和直接)和地區分類