


 |
市場調查報告書
商品編碼
1940794
水泥:市場佔有率分析、產業趨勢與統計、成長預測(2026-2031)Cement - Market Share Analysis, Industry Trends & Statistics, Growth Forecasts (2026 - 2031) |
||||||
※ 本網頁內容可能與最新版本有所差異。詳細情況請與我們聯繫。
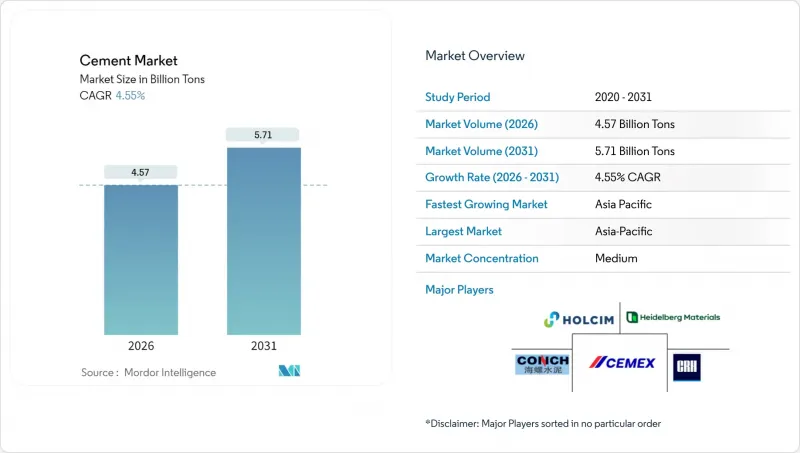
預計到 2026 年,水泥市場規模將達到 45.7 億噸,高於 2025 年的 43.7 億噸。
預計到 2031 年產量將達到 57.1 億噸,2026 年至 2031 年的複合年成長率為 4.55%。
建設業的復甦、基礎設施建設的推進以及向低碳接合材料的加速轉型構成了需求的核心。隨著採購部門將環境、社會和管治)要求納入考量,混合料正逐漸被接受,而資料中心和物流設施的建置也將推動需求的成長。生產商正透過窯爐數位化和燃料轉換來應對能源價格波動,從而穩定成本。日益嚴格的二氧化碳排放法規正在加速水泥熟料替代,而輔助膠凝材料在主要水泥市場中被視為策略性投入品。
全球水泥市場趨勢與洞察
亞洲和非洲新興地區與都市化相關的基礎建設熱潮
特大城市計畫、區域鐵路走廊和大型住宅建設計畫將持續推動亞太地區所有主要水泥市場的需求。中國的「一帶一路」計劃正在擴大對夥伴國家的需求,而印度每年的基礎設施支出接近GDP的5%,支撐著國內消費。住宅短缺(例如,預計到2028年,菲律賓的住房供不應求將達到1,000萬套)將進一步刺激住宅需求。非洲的城市化與亞洲領先的周期類似,加納的價格法規結構正在平衡住房的可負擔性和供應量。每位農村人口湧入都市區,都會使交通、住宅、公共產業和商業設施等水泥密集型資產增加三到四倍。
政府對低碳公共基礎設施的獎勵策略(新冠疫情後)
疫情後的經濟復甦計畫將把排放上限納入計劃規範,並在先進水泥市場優先發展低碳替代方案。美國兩黨共同提出的基礎設施法案撥款5,500億美元用於新業務,波特蘭水泥協會預計這些項目將在五年內增產4,600萬噸。聯邦政府的支持也延伸至製程創新,能源部資助了CEMEX公司位於諾克斯維爾工廠的碳捕獲試點計畫。每投資1美元,將產生超過3.5美元的乘數效應,從而建立永續的合約管道,並確保對混合水泥和替代燃料產品的穩定需求。
嚴格的二氧化碳排放上限和水泥熟料與水泥比例
歐盟排放交易體系和加州淨零排放指令等合規計畫需要對窯爐進行高成本的維修。燃煤發電廠的退役導致飛灰短缺日益嚴重,迫使生產商尋找替代補充資料。美國國家水泥公司與Carbon TerraVolt公司合作建造加州首個淨零排放工廠,凸顯了合規監管帶來的巨大資金負擔。 ISO 14001等認證標準逐漸演變為進入要求,提高了資金匱乏企業的進入門檻。
細分市場分析
到2025年,混合水泥將佔水泥出貨量的68.45%,成為該細分市場中水泥市場規模最大的組成部分。石灰石基混合水泥將推動需求成長,因為它兼具商業性性能和低碳排放。普通矽酸鹽水泥是道路和預鑄面板的重要材料,這些材料需要較高的早期強度,但由於法規限制水泥熟料含量,其市場佔有率正在下降。白水泥已在裝飾應用領域開闢了一個利基市場,尤其是建築幕牆牆板方面,土耳其是北美的主要出口國。纖維水泥板因其耐用性和防火性能,已成功打入住宅牆板市場。
投資趨勢也印證了這個轉變。豪瑞集團(Holcim)在瑞士工廠投資2.78億美元,旨在將替代燃料的使用率從57%提高到85%以上,這表明提升環境績效需要巨額投資。海德堡材料公司(Heidelberg Materials)正在加納擴建全球最大的煅燒黏土生產線之一,因此能夠向該地區供應低碳接合材料。這些舉措強化了支撐混合水泥產業4.88%複合年成長率預測的結構調整,鞏固了主導地位。
此水泥報告按產品類型(混合水泥、纖維水泥、普通矽酸鹽水泥、白水泥及其他)、最終用途領域(住宅、商業、基礎設施、工業及公共)和地區(亞太、北美、歐洲、南美、中東和非洲)進行細分。市場預測以噸為單位。
區域分析
亞太地區預計到2025年將佔全球水泥產量的74.60%,鞏固其作為水泥市場核心的地位。受房地產市場調整的影響,中國2024年的水泥產量下降了10%,但大型國有企業透過將剩餘產能出口到東南亞和非洲,抵消了國內市場的疲軟。印度繼續保持成長勢頭,這得益於有利的人口結構和聯邦政府資本支出計劃帶來的訂單成長。越南、印尼和泰國也實現了兩位數的工廠使用率,主要得益於電子製造業和城市交通計劃的湧入。
預計到2031年,中東和非洲地區的複合年成長率將達到4.92%,成為全球水泥市場成長最快的區域。海灣地區的經濟多元化計劃,例如沙烏地阿拉伯的“2030願景”,催生了大規模基礎設施建設聯盟,但出口配額的周期性收緊也導致了當地供應受限。非洲各市場的擴張情況不盡相同。加納實施了價格上限以保護消費者權益,而肯亞則經歷了與公共工程資金流動相關的周期性波動。海德堡材料公司正利用其一體化網路克服物流挑戰,並挖掘尚未充分滿足的需求。北美和歐洲的水泥消費正趨於成熟,但由於資產維修計畫的推進,市場趨於穩定。碳定價和窯爐電氣化計劃正在主導歐洲的資本投資,而跨國公司則將研發重點放在製程最佳化上。 Holcim 計劃於 2025 年分拆 Amrise,估值超過 300 億美元,這標誌著該公司更加重視在北美實現盈利和高效的資本配置。
其他福利:
- Excel格式的市場預測(ME)表
- 3個月的分析師支持
目錄
第1章 引言
- 研究假設和市場定義
- 調查範圍
第2章調查方法
第3章執行摘要
第4章 市場情勢
- 市場概覽
- 市場促進因素
- 亞洲和非洲新興地區都市化帶來的基礎建設熱潮
- 政府對低碳公共基礎設施的獎勵策略(後疫情時代)
- 為滿足企業ESG目標,對混合水泥/環保水泥的需求不斷成長
- 在二、三線城市擴大預拌混凝土供應網路
- 3D混凝土列印技術創造了對特殊黏合劑的利基需求。
- 市場限制
- 嚴格的二氧化碳排放法規和水泥熟料與水泥比例
- 煤炭和石油焦價格的波動正在推高生產成本。
- 由於燃煤發電廠關閉,飛灰供應量減少
- 價值鏈分析
- 波特五力模型
- 供應商的議價能力
- 買方的議價能力
- 新進入者的威脅
- 替代品的威脅
- 競爭對手之間的競爭
第5章 市場規模與成長預測
- 依產品類型
- 混合水泥
- 纖維水泥
- 普通矽酸鹽水泥
- 白色水泥
- 其他類型
- 按最終用途
- 住宅
- 商業的
- 基礎設施
- 按行業/機構
- 按地區
- 亞太地區
- 中國
- 印度
- 印尼
- 日本
- 馬來西亞
- 韓國
- 泰國
- 越南
- 澳洲
- 亞太其他地區
- 北美洲
- 美國
- 加拿大
- 墨西哥
- 歐洲
- 法國
- 德國
- 義大利
- 俄羅斯
- 西班牙
- 英國
- 其他歐洲地區
- 南美洲
- 巴西
- 阿根廷
- 其他南美洲
- 中東和非洲
- 沙烏地阿拉伯
- 南非
- 其他中東和非洲地區
- 亞太地區
第6章 競爭情勢
- 市場集中度
- 策略趨勢
- 市佔率(%)/排名分析
- 公司簡介
- Adani Group
- Anhui Conch Cement Co., Ltd.
- BBMG Corporation
- Buzzi SpA
- CEMEX SAB de CV
- Cemros
- China National Building Material Group Corporation(CNBM)
- China Resources Building Materials Technology Holdings
- Concreat
- CRH
- Dangote Cement Plc
- Heidelberg Materials
- HOLCIM
- InterCement
- JSW Cement
- OYAK Cement
- SCG
- TCC GROUP HOLDINGS
- UltraTech Cement Ltd
- Vicat
- Votorantim Cimentos
第7章 市場機會與未來展望
Cement market size in 2026 is estimated at 4.57 Billion Tons, growing from 2025 value of 4.37 Billion Tons with 2031 projections showing 5.71 Billion Tons, growing at 4.55% CAGR over 2026-2031.
Construction recovery, infrastructure upgrades, and accelerated shifts toward low-carbon binders form the core demand engine. Blended formulations gain acceptance as procurement teams embed environmental, social, and governance requirements, while data-center and logistics construction spur incremental volumes. Producers respond with kiln digitalization and fuel switching to stabilize costs in a volatile energy landscape. Regulatory tightening on CO2 emissions accelerates clinker substitution, positioning supplementary cementitious materials as strategic inputs across every major cement market.
Global Cement Market Trends and Insights
Urbanization-Linked Infrastructure Boom in Emerging Asia and Africa
Mega-city projects, regional rail corridors, and mass-housing plans push sustained volumes into every major cement market across Asia-Pacific. China's Belt and Road Initiative extends demand into partner nations, while India sustains annual infrastructure spending near 5% of GDP, underpinning domestic consumption. Housing shortfalls, such as the Philippines' projected 10 million-unit backlog by 2028, amplify residential requirements. African urban growth mirrors earlier Asian cycles, with Ghana's price-regulation framework balancing affordability and supply. Each rural-to-urban migrant drives a three-to-four-fold increase in cement-intensive assets spanning transit, housing, utilities, and commercial space.
Government Stimulus for Low-Carbon Public Infrastructure (Post-COVID)
Post-pandemic recovery packages embed emissions ceilings into project specifications, favoring lower-carbon alternatives across developed cement markets. The U.S. Bipartisan Infrastructure Law earmarks USD 550 billion for new works, a program the Portland Cement Association links to a 46 million-ton five-year volume uplift. Federal support extends to process innovation, with the Department of Energy backing carbon-capture pilots at Cemex's Knoxville plant. Multiplier effects above USD 3.5 per dollar invested trigger sustained contractor pipelines, ensuring steady pull-through of blended cement and alternative-fuel output.
Stringent CO2-Emission Caps and Clinker-to-Cement Ratios
Compliance programs such as the EU Emissions Trading System and California's net-zero mandate obligate costly kiln upgrades. Fly-ash scarcity worsens as coal utilities retire, pressing producers to seek alternative supplementary materials. National Cement's partnership with Carbon TerraVault to construct California's first net-zero facility highlights the capital burden attached to regulatory alignment. Certification standards like ISO 14001 evolve into entry requirements, raising barriers for under-capitalized firms.
Other drivers and restraints analyzed in the detailed report include:
- Rising Demand for Blended/Green Cement to Meet Corporate ESG Targets
- Expansion of Ready-Mix Concrete Networks in Tier-2/3 Cities
- Volatile Coal and Pet-Coke Prices Inflating Production Costs
For complete list of drivers and restraints, kindly check the Table Of Contents.
Segment Analysis
Blended cement captured 68.45% of 2025 shipments, underpinning the largest portion of the cement market size at the segment level. Limestone-based formulations drive the uptick, aligning commercial performance with reduced embodied carbon. Ordinary Portland Cement remains vital for early-strength highways and precast panels, yet its share declines as regulations push for lower clinker content. White cement fills decorative niches, particularly for facade panels, with Turkey acting as the primary exporter into North America. Fiber cement boards penetrate residential siding thanks to their durability and fire resistance benefits.
Investment patterns confirm the pivot. Holcim's USD 278 million package across Swiss plants seeks to boost alternative-fuel usage from 57% to above 85%, illustrating the required spend to fortify environmental credentials. Heidelberg Materials is scaling the world's largest calcined clay line in Ghana, providing a regional supply of low-carbon binder. These moves reinforce a structural realignment that supports the blended segment's 4.88% forecast CAGR and consolidates leadership within the global cement market.
The Cement Report is Segmented by Product Type (Blended Cement, Fiber Cement, Ordinary Portland Cement, White Cement, and Other Types), End-Use Sector (Residential, Commercial, Infrastructural, and Industrial and Institutional), and Geography (Asia-Pacific, North America, Europe, South America, and Middle-East and Africa). The Market Forecasts are Provided in Terms of Volume (Tons).
Geography Analysis
Asia-Pacific accounted for 74.60% of 2025 volume, confirming the region's centrality to the cement market. China's 2024 output fell 10% amid property corrections, yet state-owned majors offset domestic softness by exporting surplus to Southeast Asia and Africa. India remains the growth engine as favorable demographics and federal capital-expenditure commitments strengthen order books. Vietnam, Indonesia, and Thailand also report double-digit factory utilization rates, supported by electronics manufacturing inflows and urban transport projects.
The Middle East and Africa advance at a 4.92% CAGR through 2031, the fastest regional trajectory in the global cement market. Gulf diversification plans, typified by Saudi Arabia's Vision 2030, generate large infrastructure consortia, albeit with periodic export quotas tightening local supply. African expansion varies by market; Ghana adopts price caps to protect consumers, while Kenya experiences cyclical volatility linked to public works funding streams. Heidelberg Materials leverages an integrated network to navigate logistic hurdles and capture underserved demand pockets. North American and European consumption is mature yet steadied by asset-refurbishment agendas. In Europe, carbon pricing and kiln electrification projects dominate capex, with multinationals clustering research and development around process optimization. Holcim's 2025 spin-off of Amrize, valued above USD 30 billion, signals a sharpened focus on North American profitability and efficient capital deployment
- Adani Group
- Anhui Conch Cement Co., Ltd.
- BBMG Corporation
- Buzzi S.p.A.
- CEMEX S.A.B. de C.V.
- Cemros
- China National Building Material Group Corporation (CNBM)
- China Resources Building Materials Technology Holdings
- Concreat
- CRH
- Dangote Cement Plc
- Heidelberg Materials
- HOLCIM
- InterCement
- JSW Cement
- OYAK Cement
- SCG
- TCC GROUP HOLDINGS
- UltraTech Cement Ltd
- Vicat
- Votorantim Cimentos
Additional Benefits:
- The market estimate (ME) sheet in Excel format
- 3 months of analyst support
TABLE OF CONTENTS
1 Introduction
- 1.1 Study Assumptions and Market Definition
- 1.2 Scope of the Study
2 Research Methodology
3 Executive Summary
4 Market Landscape
- 4.1 Market Overview
- 4.2 Market Drivers
- 4.2.1 Urbanisation-linked infrastructure boom in emerging Asia and Africa
- 4.2.2 Government stimulus for low-carbon public infrastructure (post-COVID)
- 4.2.3 Rising demand for blended/green cement to meet corporate ESG targets
- 4.2.4 Expansion of ready-mix concrete networks in Tier-2/3 cities
- 4.2.5 3-D concrete-printing creating niche demand for specialised binders
- 4.3 Market Restraints
- 4.3.1 Stringent CO2-emission caps and clinker-to-cement ratios
- 4.3.2 Volatile coal and pet-coke prices inflating production costs
- 4.3.3 Shrinking fly-ash supply as coal plants retire
- 4.4 Value Chain Analysis
- 4.5 Porter's Five Forces
- 4.5.1 Bargaining Power of Suppliers
- 4.5.2 Bargaining Power of Buyers
- 4.5.3 Threat of New Entrants
- 4.5.4 Threat of Substitutes
- 4.5.5 Competitive Rivalry
5 Market Size and Growth Forecasts (Value)
- 5.1 By Product Type
- 5.1.1 Blended Cement
- 5.1.2 Fiber Cement
- 5.1.3 Ordinary Portland Cement
- 5.1.4 White Cement
- 5.1.5 Other Types
- 5.2 By End-Use Sector
- 5.2.1 Residential
- 5.2.2 Commercial
- 5.2.3 Infrastructural
- 5.2.4 Industrial and Institutional
- 5.3 By Geography
- 5.3.1 Asia-Pacific
- 5.3.1.1 China
- 5.3.1.2 India
- 5.3.1.3 Indonesia
- 5.3.1.4 Japan
- 5.3.1.5 Malaysia
- 5.3.1.6 South Korea
- 5.3.1.7 Thailand
- 5.3.1.8 Vietnam
- 5.3.1.9 Australia
- 5.3.1.10 Rest of Asia-Pacific
- 5.3.2 North America
- 5.3.2.1 United States
- 5.3.2.2 Canada
- 5.3.2.3 Mexico
- 5.3.3 Europe
- 5.3.3.1 France
- 5.3.3.2 Germany
- 5.3.3.3 Italy
- 5.3.3.4 Russia
- 5.3.3.5 Spain
- 5.3.3.6 United Kingdom
- 5.3.3.7 Rest of Europe
- 5.3.4 South America
- 5.3.4.1 Brazil
- 5.3.4.2 Argentina
- 5.3.4.3 Rest of South America
- 5.3.5 Middle-East and Africa
- 5.3.5.1 Saudi Arabia
- 5.3.5.2 South Africa
- 5.3.5.3 Rest of Middle-East and Africa
- 5.3.1 Asia-Pacific
6 Competitive Landscape
- 6.1 Market Concentration
- 6.2 Strategic Moves
- 6.3 Market Share (%)/Ranking Analysis
- 6.4 Company Profiles (includes Global level Overview, Market level Overview, Core Segments, Financials as available, Strategic Information, Market Rank/Share for key companies, Products and Services, and Recent Developments)
- 6.4.1 Adani Group
- 6.4.2 Anhui Conch Cement Co., Ltd.
- 6.4.3 BBMG Corporation
- 6.4.4 Buzzi S.p.A.
- 6.4.5 CEMEX S.A.B. de C.V.
- 6.4.6 Cemros
- 6.4.7 China National Building Material Group Corporation (CNBM)
- 6.4.8 China Resources Building Materials Technology Holdings
- 6.4.9 Concreat
- 6.4.10 CRH
- 6.4.11 Dangote Cement Plc
- 6.4.12 Heidelberg Materials
- 6.4.13 HOLCIM
- 6.4.14 InterCement
- 6.4.15 JSW Cement
- 6.4.16 OYAK Cement
- 6.4.17 SCG
- 6.4.18 TCC GROUP HOLDINGS
- 6.4.19 UltraTech Cement Ltd
- 6.4.20 Vicat
- 6.4.21 Votorantim Cimentos
7 Market Opportunities and Future Outlook
- 7.1 White-space and Unmet-Need Assessment
- 7.2 Emerging Sustainable Cement Technologies
- 7.3 Digitalisation and Automation Opportunities
 水泥與混凝土市場:2026-2032年全球市場預測(依產品類型、養護時間、應用、採購方式、最終用途及通路分類)
 水泥助磨劑市場規模、佔有率和成長分析:按產品化學成分、產品形態、水泥應用和地區分類-2026-2033年產業預測
 低碳水泥替代品市場:預測(至2034年)-按產品類型、原料、技術、應用、最終用戶和地區分類的全球分析
 2026-2030年全球混凝土及水泥市場
 水泥助磨劑市場-全球產業規模、佔有率、趨勢、機會、預測:按產品、水泥類型、最終用途、地區和競爭格局分類,2021-2031年
 2026年全球低碳水化合物米替代品市場報告
 水泥市場規模、佔有率和成長分析:按產品類型、應用、最終用戶、分銷管道和地區分類-2026-2033年產業預測
 再生混凝土市場分析及預測(至2035年):類型、產品類型、技術、應用、材料類型、製造流程、最終用戶、功能、安裝配置
 注射式骨水泥市場規模、佔有率和成長分析:按材料類型、黏度等級、手術應用、終端用戶機構、分銷管道和地區分類-2026年至2033年產業預測2026年全球低熟料水泥市場報告