


 |
市場調查報告書
商品編碼
1692450
亞太資料中心:市場佔有率分析、產業趨勢與成長預測(2025-2030 年)Asia-Pacific Data Center - Market Share Analysis, Industry Trends & Statistics, Growth Forecasts (2025 - 2030) |
||||||
※ 本網頁內容可能與最新版本有所差異。詳細情況請與我們聯繫。
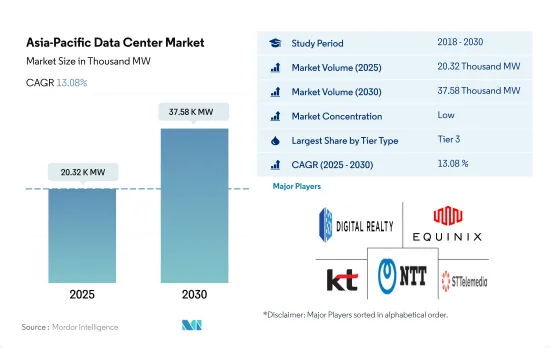
預計 2025 年亞太地區資料中心市場規模為 20,320 千瓦,到 2030 年將達到 37,580 千瓦,複合年成長率為 13.08%。
預計主機託管收益將在 2025 年達到 182.56 億美元,到 2030 年將達到 404.622 億美元,預測期內(2025-2030 年)的複合年成長率為 17.25%。
到 2023 年,Tier 3 資料中心將佔據主要佔有率,而 Tier 4 資料中心將成為成長最快的部分
- 在亞太地區,Tier 3類型憑藉其顯著的優勢佔據了大部分佔有率。這些層級具有高度冗餘,具有多個電源和冷卻路徑。邊緣和雲端連接預計將推動三級成長。
- 在澳大利亞,紐卡斯爾市議會的智慧城市策略重點關注巨量資料、物聯網和雲端連接如何幫助城市變得更宜居和創新。在新冠肺炎疫情期間,人們普遍認知到雲端處理是馬來西亞數位化之旅的基礎。阿里雲等一級供應商使中小企業能夠像大公司一樣有效率地進行交易,幫助他們最大限度地利用其服務。
- 2022 年,亞太地區的 Tier 3 類型資料中心投入營運,IT 負載容量為 6,705.97 MW。預計該容量將從 2023 年的 8,522.04 MW 成長到 2029 年的 13,981.5 MW,複合年成長率為 8.60%。
- 預計 Tier 4 類型的複合年成長率為 20.40%。新興國家正在採用 Tier-4 認證來實現容錯和冗餘。基於這個原因,開發中地區也正在採用 Tier 4 區域。例如,Supernap 泰國是該國唯一的 Tier 4 設施。
- 第 1 層和第 2 層段的成長速度最低,因為超過 70% 的總流量在伺服器之間移動。現代應用程式需要更多的資料在資料中心內以更快的速度傳輸,並且對延遲的容忍度更低。
預計到 2023 年,中國、澳洲和印度將佔據大部分市場佔有率。
- 中國和澳洲是亞太地區領先的資料中心市場。中國擁有全球最大的光纖網路以及獨立的4G、5G網路。目前,全球已建成5G基地台91.6萬個,連線數超過3.65億,佔全球5G連線數的70%至80%。對 OTT 服務和高顯示格式的線上串流內容的需求不斷成長,大大增加了資料消耗。中國沒有 Netflix,但有當地 OTT 供應商,例如酷炫、騰訊影片、芒果 TV 和嗶哩嗶哩。 2021年線上串流媒體產業的市場規模預計約為340億美元,並有望隨著用戶數量的增加而擴大。
- 澳洲也呈現類似的全球趨勢,目前約有 10-12% 的數據是在集中式資料中心或雲端之外創建和處理的,但預計到 2025 年這一比例將超過 65-70%。新冠疫情危機凸顯了澳洲迫切需要數位基礎設施來改善連通性。受高速網路服務需求不斷成長以及政府致力於在國家寬頻計劃(NBN) 計畫下積極擴展全國範圍內的 FTTx (光纖到 x) 網路的推動,預計到 2025 年,光纖線路仍將佔據固定寬頻技術的主導地位。
- 投資方面,2022年8月,澳洲通訊業者Telstra選定了新的傳輸網路基礎設施部署合作夥伴,以及一台可以同時鋪設兩條光纜的類似Mad Max的機器。
亞太資料中心市場趨勢
5G 的擴展以及科技公司和大學之間在 5G ICT 技能方面日益加強的夥伴關係將推動資料中心市場的發展
- 透過智慧型手機存取的雲端基礎的應用程式是智慧型手機用戶的主要成長市場趨勢之一。行動寬頻網路覆蓋亞太地區96%的地區,12億人使用行動網路服務。 2021年,智慧型手機普及率達74%。預計到 2025 年這一比例將上升至 84%。預計到 2025 年行動用戶普及率將達到 62%。
- 行動應用程式數量達890萬個,中國佔40%。截至2021年12月,我國行動網路用戶普及率達94.6%,行動上網應用程式總合達442個。 5G 網路在民眾中的普及率不斷提高,促進了 5G 設備的銷售。 5G 的可用性參差不齊,主要在東南亞。新加坡和印尼等國家已經部署 5G 一段時間了,並繼續為公民和組織創新使用案例。
- 到2022年,5G預計將覆蓋泰國85%以上的人口。新的夥伴關係和發展正在推動 5G 在智慧型手機中的普及。例如,2022 年 7 月,愛立信與泰國國王科技大學吞武里分校(KMUTT)宣佈建立合作關係,幫助泰國學生培養面向未來的 5G ICT 技能。家庭和企業有線寬頻連線的無線替代方案是 5G 早期的關鍵使用案例之一,尤其是在寬頻市場服務不足或低度開發的地區。
亞太國家光纖到府/建築 (FTTH/B) 服務的成長將推動該地區對資料中心的需求
- 平均寬頻網路連線的下載速度至少為 25Mbps,上傳速度至少為 3Mbps。 FTTH/B服務正在鞏固其作為亞太地區領先固定寬頻技術的地位。到2026年,新加坡的FTTH/B線路佔固定寬頻線路總量的佔有率預計將達到98%以上,位居亞太地區最高。緊隨新加坡之後的是越南、香港和馬來西亞。
- 馬來西亞通訊及多媒體部長表示,2023年將逐步淘汰銅線網路。政府的目標是將人口密集地區的寬頻普及率提高至少五倍,目標是人口密集地區的寬頻普及率達到98%左右,網路速度達到30Mbps或以上。
- 澳洲通訊業者Telstra選定了新的基礎設施合作夥伴和一台類似「瘋狂的麥斯」的機器,計劃於2022年8月同時鋪設兩條光纖電纜。該營運商計劃加快步伐,在以環境挑戰著稱的澳洲境內建設一張高容量數據傳輸網路,以滿足日益成長的數據連接需求。亞太地區銅纜網路的退役推動了光纖連接的發展。銅線維護成本高,操作困難。據估計,與光纖網路相比,傳統銅線網路的維護成本高出2-7倍,能源成本高出3-6倍,網路故障率高出5-10倍。
亞太資料中心產業概覽
亞太資料中心市場較為分散,前五大企業佔18.04%的市佔率。該市場的主要企業有:Digital Realty Trust, Inc.、Equinix, Inc.、KT Corporation、NTT Ltd. 和 STT GDC Pte Ltd(按字母順序排列)。
其他福利
- Excel 格式的市場預測 (ME) 表
- 3個月的分析師支持
目錄
第1章執行摘要和主要發現
第2章 報告要約
第3章 引言
- 研究假設和市場定義
- 研究範圍
- 調查方法
第4章 市場展望
- 負載能力
- 占地面積
- 主機代管收入
- 安裝的機架數量
- 機架空間利用率
- 海底電纜
第5章 產業主要趨勢
- 智慧型手機用戶數量
- 每部智慧型手機的數據流量
- 行動數據速度
- 寬頻數據速度
- 光纖連接網路
- 法律規範
- 澳洲
- 中國
- 香港
- 印度
- 印尼
- 日本
- 馬來西亞
- 紐西蘭
- 菲律賓
- 新加坡
- 韓國
- 台灣
- 泰國
- 越南
- 價值鍊和通路分析
第6章市場區隔
- 資料中心規模
- 大規模
- 超大規模
- 中等規模
- 百萬
- 小規模
- 等級類型
- 1級和2級
- 第 3 層
- 第 4 層
- 吸收量
- 未使用
- 使用
- 按主機託管類型
- 超大規模
- 零售
- 批發的
- 按最終用戶
- BFSI
- 雲
- 電子商務
- 政府
- 製造業
- 媒體與娛樂
- 電信
- 其他最終用戶
- 國家
- 澳洲
- 中國
- 印度
- 印尼
- 日本
- 馬來西亞
- 亞太地區其他國家
第7章競爭格局
- 市場佔有率分析
- 商業狀況
- 公司簡介.
- AirTrunk Operating Pty Ltd
- Canberra Data Centers
- Chindata Group Holdings Ltd.
- Digital Realty Trust, Inc.
- Equinix, Inc.
- Keppel DC REIT Management Pte. Ltd.
- KT Corporation
- NEXTDC Ltd
- NTT Ltd.
- Princeton Digital Group
- Space DC Pte Ltd.
- STT GDC Pte Ltd
- LIST OF COMPANIES STUDIED
第8章:CEO面臨的關鍵策略問題
第9章 附錄
- 世界概況
- 概述
- 五力分析框架
- 全球價值鏈分析
- 全球市場規模和DRO
- 資訊來源及延伸閱讀
- 圖表清單
- 關鍵見解
- 數據包
- 詞彙表
The Asia-Pacific Data Center Market size is estimated at 20.32 thousand MW in 2025, and is expected to reach 37.58 thousand MW by 2030, growing at a CAGR of 13.08%. Further, the market is expected to generate colocation revenue of USD 18,256 Million in 2025 and is projected to reach USD 40,462.2 Million by 2030, growing at a CAGR of 17.25% during the forecast period (2025-2030).
Tier 3 data center accounted for majority share in terms of volume in 2023; Tier 4 is the fastest-growing segment
- The Tier 3 type has a majority share in Asia-Pacific due to its major advantage. These tiers have high redundancy with multiple paths for power and cooling. Edge and cloud connectivity are expected to boost Tier 3 growth.
- In Australia, the Smart City Strategy developed by Newcastle Council focuses on how Big Data, the Internet of Things, and cloud connectivity can help create more livable and innovative cities. In the endemic phase of COVID-19, cloud computing was widely acknowledged as the foundation of Malaysia's digital journey. Primary providers such as Alibaba Cloud have enabled small businesses to trade as effectively as large enterprises, allowing such businesses to take full advantage of the services.
- The APAC tier 3 type operated at an IT load capacity of 6705.97 MW in 2022. The capacity is expected to grow from 8522.04 MW in 2023 to 13981.5 MW in 2029, registering a CAGR of 8.60%.
- The Tier 4 type is expected to register a CAGR of 20.40%. Developed countries adopt Tier-4 certification to achieve fault tolerance and redundancy. For this reason, Tier 4 zones are adopted even in developing regions. For instance, Supernap Thailand is the only Tier 4 facility in the country.
- The Tier 1 & 2 segment shows the least growth, as more than 70% of all traffic moves from server to server. Modern applications require significantly more data to travel within a data center at faster speeds and are less forgiving about latency.
China, Australia, and India held the majority market share in 2023; India is the fastest-growing country
- China and Australia are the leading countries in Asia-Pacific in terms of the data center market. China has the world's largest optical fiber network, 4G, and 5G independent networking networks. At present, 916,000 base stations have been built in 5G, accounting for more than 365 million of the world's 70% to 80% of 5G connections. The growing demand for OTT services and streaming content online on high-display formats is significantly increasing data consumption. China does not have Netflix but has local OTT providers, such as Yuoku, Tencent Video, Mango TV, and Bilibili. The online streaming industry was worth around USD 34 billion in 2021, which is expected to increase with the growing number of users.
- In Australia, currently, about 10-12% of data is created and processed outside a centralized data center or cloud, but the number is expected to cross 65-70% by 2025, a global trend that is also reflected in Australia. The COVID-19 crisis highlighted that Australia has a great need for digital infrastructure to improve connectivity. Fiber lines are expected to remain the dominant fixed broadband technology through 2025, supported by the rising demand for high-speed Internet services and the government's focus on aggressive fiber to the x (FTTx) network expansions nationwide under the National Broadband Network (NBN) project.
- In terms of investment, in August 2022, the Australian operator Telstra selected new transport network infrastructure rollout partners and Mad Max-like machinery capable of laying dual fiber cables simultaneously as the operator accelerates its efforts to build out high-capacity data transport networks across a country renowned for its distinctive environmental challenges.
Asia-Pacific Data Center Market Trends
Expansion in 5G and rising partnerships among tech companies and universities for 5G ICT skills in the region drive the data centers market
- Cloud-based applications accessed through smartphones are one of the major growing market trends with smartphone users. Mobile broadband networks cover 96% of Asia-Pacific, with 1.2 billion people accessing mobile internet services. In 2021, smartphone adoption reached 74%. It is expected to rise to 84% by 2025. Mobile subscriber penetration is expected to reach 62% in 2025.
- There are 8.9 million mobile apps, and China spends 40%. As of December 2021, China owned 442 apps that achieved a combined penetration rate of 94.6% among mobile internet users. The growing adoption of the 5G network among the population has complemented 5G-enabled device sales. 5G availability, primarily in Southeast Asia, is variable. Countries like Singapore and Indonesia have already seen 5G deployed for some time and continue to innovate use cases for the public and organizations.
- By 2022, 5G coverage was expected to reach over 85% of Thailand's population. With new partnerships and development, 5G adoption in smartphones is increasing. For instance, in July 2022, Ericsson and the King Mongkut University of Technology Thonburi (KMUTT) announced that they partnered to support Thai students in building 5G ICT skills for the future. A wireless alternative to wireline broadband connectivity for homes and businesses is one of the major early 5G use cases, particularly in regions with unserved or underserved broadband markets.
Growth in fiber-to-the-home/building (FTTH/B) service in various Asia-Pacific countries drives the demand for data centers in the region
- An average broadband internet connection has a minimum download speed of 25 Mbps and a minimum upload speed of 3 Mbps. Fiber-to-the-home/building (FTTH/B) service is set to cement its position as Asia-Pacific's leading fixed broadband technology. Singapore is anticipated to have the highest share of FTTH/B lines as a percentage of total fixed broadband lines in the region, with more than 98% by 2026. Singapore will be followed by Vietnam, Hong Kong, and Malaysia.
- According to the Malaysian Minister of Communications and Multimedia, copper networks will be phased out by 2023. The government looks to increase broadband coverage in populated areas by at least five-fold, and they look at about 98% broadband coverage in populated areas with a speed of at least 30 Mbps.
- The Australian operator Telstra selected new infrastructure rollout partners and Mad Max-like machinery to lay dual fiber cables simultaneously in August 2022. The operator intends to accelerate its efforts to build out high-capacity data transport networks across a country renowned for its distinct environmental challenges to meet increasing demands for data connectivity. Fiber connectivity is driven by the decommissioning of copper networks in Asia-Pacific. Copper is expensive to maintain and difficult to operate. Some estimates suggest that compared to fiber networks, legacy copper network maintenance OpEx is 2-7 times greater, energy costs are 3-6 times higher, and network fault rates are 5-10 times greater.
Asia-Pacific Data Center Industry Overview
The Asia-Pacific Data Center Market is fragmented, with the top five companies occupying 18.04%. The major players in this market are Digital Realty Trust, Inc., Equinix, Inc., KT Corporation, NTT Ltd. and STT GDC Pte Ltd (sorted alphabetically).
Additional Benefits:
- The market estimate (ME) sheet in Excel format
- 3 months of analyst support
TABLE OF CONTENTS
1 EXECUTIVE SUMMARY & KEY FINDINGS
2 REPORT OFFERS
3 INTRODUCTION
- 3.1 Study Assumptions & Market Definition
- 3.2 Scope of the Study
- 3.3 Research Methodology
4 MARKET OUTLOOK
- 4.1 It Load Capacity
- 4.2 Raised Floor Space
- 4.3 Colocation Revenue
- 4.4 Installed Racks
- 4.5 Rack Space Utilization
- 4.6 Submarine Cable
5 Key Industry Trends
- 5.1 Smartphone Users
- 5.2 Data Traffic Per Smartphone
- 5.3 Mobile Data Speed
- 5.4 Broadband Data Speed
- 5.5 Fiber Connectivity Network
- 5.6 Regulatory Framework
- 5.6.1 Australia
- 5.6.2 China
- 5.6.3 Hong Kong
- 5.6.4 India
- 5.6.5 Indonesia
- 5.6.6 Japan
- 5.6.7 Malaysia
- 5.6.8 New Zealand
- 5.6.9 Philippines
- 5.6.10 Singapore
- 5.6.11 South Korea
- 5.6.12 Taiwan
- 5.6.13 Thailand
- 5.6.14 Vietnam
- 5.7 Value Chain & Distribution Channel Analysis
6 MARKET SEGMENTATION (INCLUDES MARKET SIZE IN VOLUME, FORECASTS UP TO 2030 AND ANALYSIS OF GROWTH PROSPECTS)
- 6.1 Data Center Size
- 6.1.1 Large
- 6.1.2 Massive
- 6.1.3 Medium
- 6.1.4 Mega
- 6.1.5 Small
- 6.2 Tier Type
- 6.2.1 Tier 1 and 2
- 6.2.2 Tier 3
- 6.2.3 Tier 4
- 6.3 Absorption
- 6.3.1 Non-Utilized
- 6.3.2 Utilized
- 6.3.2.1 By Colocation Type
- 6.3.2.1.1 Hyperscale
- 6.3.2.1.2 Retail
- 6.3.2.1.3 Wholesale
- 6.3.2.2 By End User
- 6.3.2.2.1 BFSI
- 6.3.2.2.2 Cloud
- 6.3.2.2.3 E-Commerce
- 6.3.2.2.4 Government
- 6.3.2.2.5 Manufacturing
- 6.3.2.2.6 Media & Entertainment
- 6.3.2.2.7 Telecom
- 6.3.2.2.8 Other End User
- 6.4 Country
- 6.4.1 Australia
- 6.4.2 China
- 6.4.3 India
- 6.4.4 Indonesia
- 6.4.5 Japan
- 6.4.6 Malaysia
- 6.4.7 Rest of APAC
7 COMPETITIVE LANDSCAPE
- 7.1 Market Share Analysis
- 7.2 Company Landscape
- 7.3 Company Profiles (includes Global Level Overview, Market Level Overview, Core Business Segments, Financials, Headcount, Key Information, Market Rank, Market Share, Products and Services, and Analysis of Recent Developments).
- 7.3.1 AirTrunk Operating Pty Ltd
- 7.3.2 Canberra Data Centers
- 7.3.3 Chindata Group Holdings Ltd.
- 7.3.4 Digital Realty Trust, Inc.
- 7.3.5 Equinix, Inc.
- 7.3.6 Keppel DC REIT Management Pte. Ltd.
- 7.3.7 KT Corporation
- 7.3.8 NEXTDC Ltd
- 7.3.9 NTT Ltd.
- 7.3.10 Princeton Digital Group
- 7.3.11 Space DC Pte Ltd.
- 7.3.12 STT GDC Pte Ltd
- 7.4 LIST OF COMPANIES STUDIED
8 KEY STRATEGIC QUESTIONS FOR DATA CENTER CEOS
9 APPENDIX
- 9.1 Global Overview
- 9.1.1 Overview
- 9.1.2 Porter's Five Forces Framework
- 9.1.3 Global Value Chain Analysis
- 9.1.4 Global Market Size and DROs
- 9.2 Sources & References
- 9.3 List of Tables & Figures
- 9.4 Primary Insights
- 9.5 Data Pack
- 9.6 Glossary of Terms
 2025年全球資料中心資訊技術(IT)設備市場報告2025年全球配置自動化市場報告
 全球配電中心市場:依類型、應用和地區劃分 - 市場規模、行業趨勢、機會分析和預測(2025-2033 年)
 資料中心設備及基礎設施市場:2025-2030
 高階主管簡報:2025 年第四季
 資料中心遷移市場-2025-2030 年預測
 AI資料中心的設備投資的明細和未來預測
 全球資料中心服務市場按服務類型、設施服務、IT 服務、專業諮詢與認證、層級類型、資料中心規模與容量、資料中心類型、企業資料中心和地區分類 - 預測至 2030 年
 全球企業 IT 資產處置市場規模、佔有率和行業分析報告:2025 年至 2032 年按資產類型、服務、行業和地區分類的展望和預測
 資料中心市場:按組件、資料中心類型、層級、冷卻類型、電源、最終用戶和組織規模分類 - 全球預測,2025-2032 年